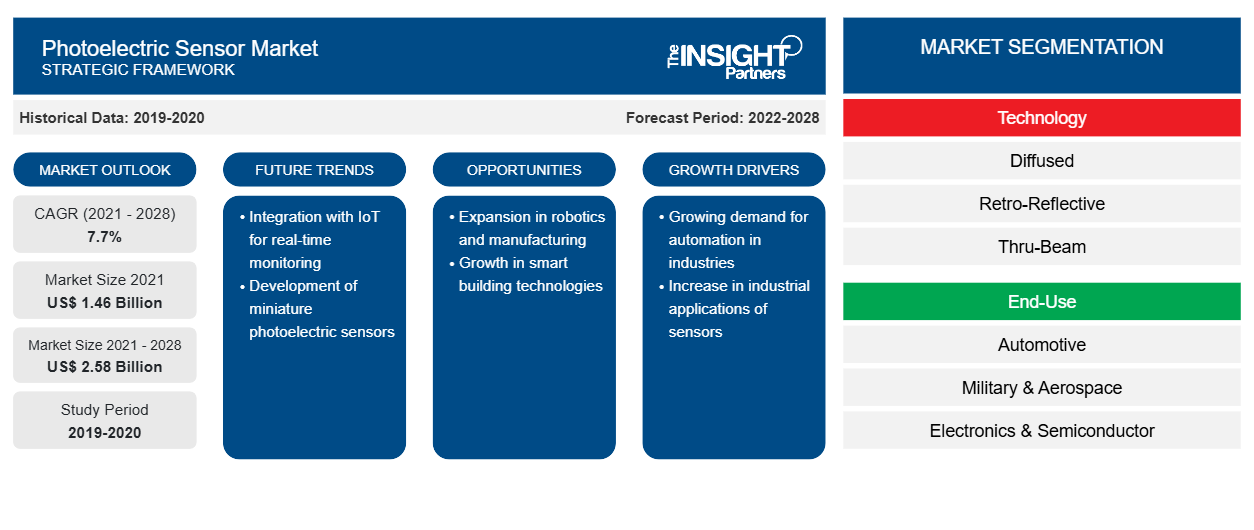
[تقرير بحثي] بلغت قيمة سوق المستشعرات الضوئية الكهربائية 1,458.23 مليون دولار أمريكي في عام 2021 ومن المتوقع أن تصل إلى 2,577.56 مليون دولار أمريكي بحلول عام 2028؛ ومن المتوقع أن تنمو بمعدل نمو سنوي مركب قدره 7.7٪ من عام 2021 إلى عام 2028.
تكتسب أجهزة الاستشعار الكهروضوئية شعبية كبيرة بسبب موثوقيتها العالية وقدراتها على اكتشاف الأجسام على مسافة بعيدة، بغض النظر عن حجم الأجسام وشكلها ولونها ومادتها وخصائص سطحها. تم تصميم هذه المستشعرات للعمل في ظل ظروف قاسية؛ علاوة على ذلك، فهي مزودة بتقنيات متقدمة لضمان قمع موثوق للانعكاسات غير المرغوب فيها. تجعلها هذه القدرات أكثر تنوعًا من العديد من أنواع المستشعرات الأخرى ومناسبة للاستخدام الصناعي. على سبيل المثال، تكتشف أجهزة الاستشعار العاكسة للضوء مع مرشحات الاستقطاب موضع عربة من أي شكل ومادة، والتي يجب وضعها على مسار الأفعوانية أو خارجه. علاوة على ذلك، تُستخدم أجهزة الاستشعار الكهروضوئية على نطاق واسع في الصناعات العسكرية والفضائية نظرًا لدقتها العالية وأدائها الموثوق. يتم استخدامها في طائرات الشحن للكشف عن الدخان والحرائق. بالإضافة إلى ذلك، تساعد أجهزة الاستشعار الكهروضوئية مصنعي هياكل الطائرات والمحركات على مراقبة معلمات أنظمة الطيران مثل الضغط ودرجة الحرارة والتسارع والموضع البصري والسرعة. علاوة على ذلك، تستخدم صناعة الدفاع على نطاق واسع معدات الكشف البيولوجي للكشف عن وجود المواد الكيميائية في البيئة وتقييم مخاطر التهديدات البيولوجية المحتملة من خلال الكشف عن المواد البيولوجية الضارة، لحماية السكان العسكريين والمدنيين على حد سواء. وبالتالي، فإن دقة وموثوقية عمليات أجهزة الاستشعار الكهروضوئية تجعلها نوع الاستشعار المفضل في الظروف الصناعية القاسية.
تأثير جائحة كوفيد-19 على سوق أجهزة الاستشعار الكهروضوئية
وفقًا لأحدث تقرير من منظمة الصحة العالمية، فإن الولايات المتحدة وإسبانيا وإيطاليا وفرنسا وألمانيا والمملكة المتحدة وروسيا وتركيا والبرازيل وإيران والصين من بين الدول الأكثر تضررًا بسبب تفشي فيروس كورونا المستجد. في عام 2020، عانى الاقتصاد العالمي من عواقب وخيمة، ومن المتوقع أن تستمر الآثار إلى حد ما في السنوات القادمة. أدى تفشي المرض إلى تعطيل الصناعات الأولية مثل الإلكترونيات وأشباه الموصلات والتصنيع. إن الانخفاض الحاد في نمو هذه الصناعات يحد من نمو سوق أجهزة الاستشعار الكهروضوئية . كما أثر إغلاق المصانع وحظر السفر والتجارة وإغلاق الحدود لمكافحة العدوى واحتوائها سلبًا على تصنيع وتوريد ومبيعات منتجات الاستشعار المختلفة.
قم بتخصيص هذا التقرير ليناسب متطلباتك
ستحصل على تخصيص لأي تقرير - مجانًا - بما في ذلك أجزاء من هذا التقرير، أو تحليل على مستوى الدولة، وحزمة بيانات Excel، بالإضافة إلى الاستفادة من العروض والخصومات الرائعة للشركات الناشئة والجامعات
سوق أجهزة الاستشعار الكهروضوئية:
- احصل على أهم اتجاهات السوق الرئيسية لهذا التقرير.ستتضمن هذه العينة المجانية تحليلاً للبيانات، بدءًا من اتجاهات السوق وحتى التقديرات والتوقعات.
يركز مصنعو أجهزة الاستشعار الكهروضوئية على خفض تكاليف التشغيل للحفاظ على القدرة التنافسية. ومع ذلك، من المتوقع أن يستأنفوا أنشطة الإنتاج خلال مرحلة ما بعد الإغلاق. ومن المتوقع أن تؤدي المبادرات الحكومية لتعزيز الاقتصادات والتخفيف من قيود الإغلاق إلى زيادة الطلب على أجهزة الاستشعار الكهروضوئية خلال فترة التوقعات. ومن المرجح أن يتوسع الطلب على أجهزة الاستشعار الكهروضوئية مع اعتماد التقنيات الجديدة على نطاق أوسع في صناعات السيارات والفضاء.post-lockdown phase. Government initiatives to boost economies and relaxations in the lockdowns are expected to fuel demand for photoelectric sensors during the forecast period. Demand for photoelectric sensors is likely to expand as new technologies become more widely adopted in the automotive and aerospace industries.
رؤى حول سوق أجهزة الاستشعار الكهروضوئية
الطلب المتزايد على أجهزة الاستشعار الكهروضوئية في صناعة الأدوية يدفع نمو سوق أجهزة الاستشعار الكهروضوئية
تركز شركات الأدوية على تحسين عمليات التصنيع الشاملة من خلال تجنب التناقضات مثل التعبئة الفارغة، والتي يمكن أن تحدث بسبب عدم توفر أقراص الدواء على خط الإنتاج. تنشر الصناعة بشكل متزايد أجهزة استشعار ضوئية كهربائية لحساب الأقراص، وملء الزجاجات، والتحقق من العد (في التجارب السريرية). تُستخدم هذه المستشعرات أيضًا في آلات استيفاء الوصفات الطبية الآلية في الصيدليات والمستشفيات. علاوة على ذلك، فإن التقدم في أجهزة الاستشعار الضوئية الكهربائية من حيث نطاق الاستشعار، مما يحسن دقة العد، إلى جانب الحفاظ على بيئات إنتاج صحية من خلال استبعاد الاتصالات البشرية أثناء تعبئة الدواء هي الفوائد المرتبطة بأجهزة الاستشعار الضوئية الكهربائية. كما يوفر المستشعر الضوئي حلاً فعالاً من حيث التكلفة، والذي يتم تحقيقه من خلال خط الإنتاج الآلي في صناعة الأدوية. وبالتالي،
يعود الارتفاع في اعتماد أجهزة الاستشعار الكهروضوئية في شركات الأدوية بشكل أساسي إلى قدرتها على تعزيز الكفاءة وتقليل تكاليف التشغيل في الصناعة وتسهيل مراقبة الإنتاج في الوقت الفعلي. تعمل هذه المستشعرات على أتمتة المستويات العلوية والسفلية لقياس السوائل في الجرة أو الخزان. يعد استخدام المواد الكيميائية المسببة للتآكل القوية (الحمضية أو القاعدية) أمرًا شائعًا في شركات الأدوية، وبالتالي فإن اكتشاف مستويات السوائل في خزانات التخزين يعد مهمة مهمة في هذه المصانع. وبالتالي، فإن الاستخدام المتزايد لأجهزة الاستشعار الكهروضوئية في صناعة الأدوية من شأنه أن يدفع نمو سوق أجهزة الاستشعار الكهروضوئية في السنوات القادمة.
رؤى السوق القائمة على التكنولوجيا
بناءً على التكنولوجيا، يتم تقسيم سوق المستشعرات الضوئية إلى مستشعرات منتشرة وعاكسة للضوء وشعاعية. في عام 2020، استحوذت شريحة العاكس للضوء على أكبر حصة في السوق.
رؤى السوق المستندة إلى المستخدم النهائي
بناءً على المستخدم النهائي، يتم تقسيم سوق المستشعرات الضوئية إلى السيارات والجيش والفضاء والإلكترونيات وأشباه الموصلات والتعبئة والتغليف وغيرها. في عام 2020، استحوذ قطاع السيارات على أكبر حصة في السوق.
يتبنى اللاعبون العاملون في سوق أجهزة الاستشعار الكهروضوئية استراتيجيات مثل عمليات الدمج والاستحواذ ومبادرات السوق للحفاظ على مواقعهم في السوق. فيما يلي بعض التطورات التي قام بها اللاعبون الرئيسيون:
- في أبريل 2020، قدمت Balluff Photoelectric Sensors بيانات مراقبة الحالة. تتضمن مجموعة أنظمة الأتمتة والمراقبة الذكية (SAMS) الاستشعار الكهروضوئي القوي ومراقبة الحالة وتقنيات IO-link المتقدمة، وكلها تهدف إلى توفير وقت التوقف عن العمل من خلال تسهيل استكشاف الأخطاء وإصلاحها والتبديل وإعداد الماكينة.
- في فبراير 2020، أدرجت مجلة فورتشن شركة Eaton Corp plc ضمن الشركات الأكثر إثارة للإعجاب في العالم لعام 2020.
رؤى إقليمية حول سوق أجهزة الاستشعار الكهروضوئية
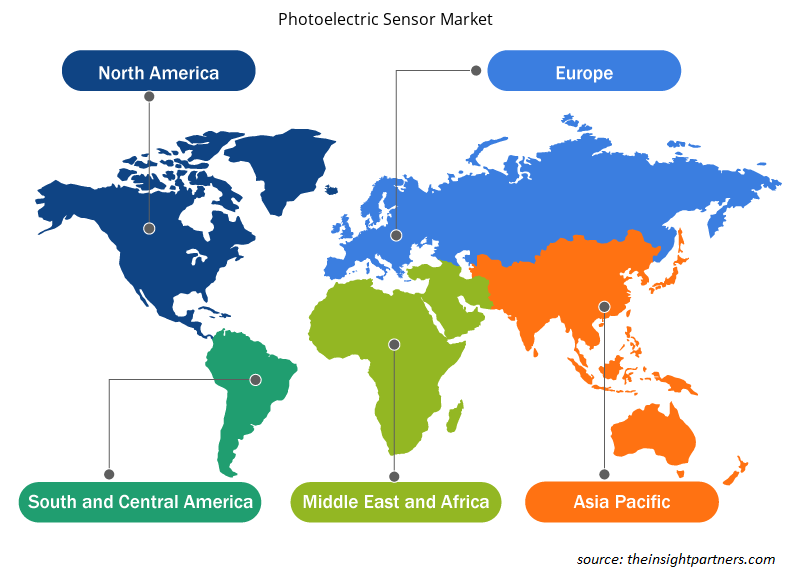
لقد قام المحللون في Insight Partners بشرح الاتجاهات والعوامل الإقليمية المؤثرة على سوق أجهزة الاستشعار الكهروضوئية طوال فترة التوقعات بشكل شامل. يناقش هذا القسم أيضًا قطاعات سوق أجهزة الاستشعار الكهروضوئية والجغرافيا في جميع أنحاء أمريكا الشمالية وأوروبا ومنطقة آسيا والمحيط الهادئ والشرق الأوسط وأفريقيا وأمريكا الجنوبية والوسطى.
- احصل على البيانات الإقليمية المحددة لسوق أجهزة الاستشعار الكهروضوئية
نطاق تقرير سوق المستشعرات الكهروضوئية
| سمة التقرير | تفاصيل |
|---|---|
| حجم السوق في عام 2021 | 1.46 مليار دولار أمريكي |
| حجم السوق بحلول عام 2028 | 2.58 مليار دولار أمريكي |
| معدل النمو السنوي المركب العالمي (2021 - 2028) | 7.7% |
| البيانات التاريخية | 2019-2020 |
| فترة التنبؤ | 2022-2028 |
| القطاعات المغطاة | حسب التكنولوجيا
|
| المناطق والدول المغطاة | أمريكا الشمالية
|
| قادة السوق وملفات تعريف الشركات الرئيسية |
|
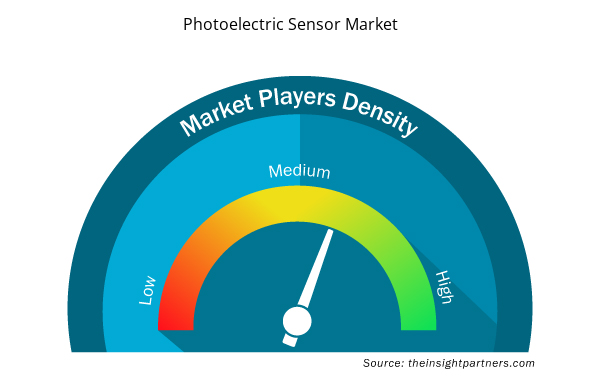
كثافة اللاعبين في السوق: فهم تأثيرها على ديناميكيات الأعمال
يشهد سوق أجهزة الاستشعار الكهروضوئية نموًا سريعًا، مدفوعًا بالطلب المتزايد من المستخدم النهائي بسبب عوامل مثل تفضيلات المستهلك المتطورة والتقدم التكنولوجي والوعي المتزايد بفوائد المنتج. ومع ارتفاع الطلب، تعمل الشركات على توسيع عروضها والابتكار لتلبية احتياجات المستهلكين والاستفادة من الاتجاهات الناشئة، مما يؤدي إلى زيادة نمو السوق.
تشير كثافة اللاعبين في السوق إلى توزيع الشركات أو المؤسسات العاملة في سوق أو صناعة معينة. وهي تشير إلى عدد المنافسين (اللاعبين في السوق) الموجودين في مساحة سوق معينة نسبة إلى حجمها أو قيمتها السوقية الإجمالية.
الشركات الرئيسية العاملة في سوق المستشعرات الضوئية الكهربائية هي:
- شركة أوتونيكس
- شركة بالوف المحدودة
- شركة إيتون المحدودة
- شركة Ifm الإلكترونية المحدودة
- شركة كينس
إخلاء المسؤولية : الشركات المذكورة أعلاه ليست مرتبة بأي ترتيب معين.
- احصل على نظرة عامة على أهم اللاعبين الرئيسيين في سوق أجهزة الاستشعار الكهروضوئية
تم تقسيم سوق أجهزة الاستشعار الكهروضوئية العالمية على النحو المذكور أدناه:
حسب التكنولوجيا
- منتشر
- عاكس للضوء
- عبر الشعاع
حسب المستخدم النهائي
- السيارات
- العسكرية والفضائية
- الالكترونيات وأشباه الموصلات
- التغليف
- آحرون
حسب الجغرافيا
- أمريكا الشمالية
- نحن
- كندا
- المكسيك
- أوروبا
- فرنسا
- ألمانيا
- إيطاليا
- المملكة المتحدة
- روسيا
- بقية أوروبا
- آسيا والمحيط الهادئ (APAC)
- الصين
- الهند
- كوريا الجنوبية
- اليابان
- أستراليا
- بقية منطقة آسيا والمحيط الهادئ
- الشرق الأوسط وأفريقيا
- جنوب أفريقيا
- المملكة العربية السعودية
- الامارات العربية المتحدة
- باقي منطقة الشرق الأوسط وأفريقيا
- أمريكا الجنوبية (SAM)
- البرازيل
- الأرجنتين
- بقية سام
نبذة عن الشركة
- شركة أوتونيكس
- شركة بالوف المحدودة
- شركة إيتون المحدودة
- شركة Ifm الإلكترونية المحدودة
- شركة كينس
- شركة أومرون
- روكويل أوتوميشن، المحدودة
- شركة باناسونيك
- مريض AG
- شركة شنايدر الكتريك
- التحليل التاريخي (سنتان)، السنة الأساسية، التوقعات (7 سنوات) مع معدل النمو السنوي المركب
- تحليل PEST و SWOT
- حجم السوق والقيمة / الحجم - عالميًا وإقليميًا وقطريًا
- الصناعة والمنافسة
- مجموعة بيانات Excel


Report Coverage
Revenue forecast, Company Analysis, Industry landscape, Growth factors, and Trends

Segment Covered
This text is related
to segments covered.

Regional Scope
North America, Europe, Asia Pacific, Middle East & Africa, South & Central America

Country Scope
This text is related
to country scope.
الأسئلة الشائعة
The rising need for of sensors and technological developments to solve complex challenges is encouraging innovations in photoelectric sensors. The pulse ranging technology (PRT), which can calculate object’s distance by using the principal of direct light propagation time measurement method, can be valuable in commercial industrial applications. PRT sensors provide accurate and continuous distance data with digital or analog outputs. In addition, positioning PRT sensors on each side of the carton and measuring these distances would also provide dimensions of pallets or cartons, which can be used to calculate the volume of the pallet or carton. The technology is expected to further improve the efficiency and accuracy of line assembly by providing comprehensive details of materials in production or operational process.
The growth of the Photoelectric Sensor market is primarily attributed to the accuracy and reliability of photoelectric sensors. Photoelectric sensors are gaining popularity due to their high reliability and long-range object detection capabilities, irrespective of the size, shape, color, material, and surface properties of objects. These sensors are designed to operate under harsh conditions; moreover, they are enabled with advanced technologies to ensure reliable suppression of undesirable reflections. These abilities makes them more versatile than many other sensor types and appropriate for industrial usage.
Rising demand for photoelectric sensors in pharmaceuticals industry is providing noteworthy opportunities to the Photoelectric Sensor market players. Pharmaceutical companies focus on improving their overall manufacturing operations by avoiding discrepancies such as empty packaging, which can be caused due to the unavailability of medicine tablets on the production line. The industry is increasingly deploying photoelectric sensors for tablet counting, bottle filling, and count verification (in clinical trials). These sensors are also being used in automated prescription fulfillment machines at retail pharmacies and hospitals.
The List of Companies - Photoelectric Sensor Market
- Autonics Corporation
- Balluff GmbH
- Eaton Corporation plc
- Ifm Electronic GmbH
- Keyence Corporation
- OMRON Corporation
- Rockwell Automation, Inc.
- Panasonic Corporation
- SICK AG
- Schneider Electric SE


The Insight Partners performs research in 4 major stages: Data Collection & Secondary Research, Primary Research, Data Analysis and Data Triangulation & Final Review.
- Data Collection and Secondary Research:
As a market research and consulting firm operating from a decade, we have published and advised several client across the globe. First step for any study will start with an assessment of currently available data and insights from existing reports. Further, historical and current market information is collected from Investor Presentations, Annual Reports, SEC Filings, etc., and other information related to company’s performance and market positioning are gathered from Paid Databases (Factiva, Hoovers, and Reuters) and various other publications available in public domain.
Several associations trade associates, technical forums, institutes, societies and organization are accessed to gain technical as well as market related insights through their publications such as research papers, blogs and press releases related to the studies are referred to get cues about the market. Further, white papers, journals, magazines, and other news articles published in last 3 years are scrutinized and analyzed to understand the current market trends.
- Primary Research:
The primarily interview analysis comprise of data obtained from industry participants interview and answers to survey questions gathered by in-house primary team.
For primary research, interviews are conducted with industry experts/CEOs/Marketing Managers/VPs/Subject Matter Experts from both demand and supply side to get a 360-degree view of the market. The primary team conducts several interviews based on the complexity of the markets to understand the various market trends and dynamics which makes research more credible and precise.
A typical research interview fulfils the following functions:
- Provides first-hand information on the market size, market trends, growth trends, competitive landscape, and outlook
- Validates and strengthens in-house secondary research findings
- Develops the analysis team’s expertise and market understanding
Primary research involves email interactions and telephone interviews for each market, category, segment, and sub-segment across geographies. The participants who typically take part in such a process include, but are not limited to:
- Industry participants: VPs, business development managers, market intelligence managers and national sales managers
- Outside experts: Valuation experts, research analysts and key opinion leaders specializing in the electronics and semiconductor industry.
Below is the breakup of our primary respondents by company, designation, and region:

Once we receive the confirmation from primary research sources or primary respondents, we finalize the base year market estimation and forecast the data as per the macroeconomic and microeconomic factors assessed during data collection.
- Data Analysis:
Once data is validated through both secondary as well as primary respondents, we finalize the market estimations by hypothesis formulation and factor analysis at regional and country level.
- Macro-Economic Factor Analysis:
We analyse macroeconomic indicators such the gross domestic product (GDP), increase in the demand for goods and services across industries, technological advancement, regional economic growth, governmental policies, the influence of COVID-19, PEST analysis, and other aspects. This analysis aids in setting benchmarks for various nations/regions and approximating market splits. Additionally, the general trend of the aforementioned components aid in determining the market's development possibilities.
- Country Level Data:
Various factors that are especially aligned to the country are taken into account to determine the market size for a certain area and country, including the presence of vendors, such as headquarters and offices, the country's GDP, demand patterns, and industry growth. To comprehend the market dynamics for the nation, a number of growth variables, inhibitors, application areas, and current market trends are researched. The aforementioned elements aid in determining the country's overall market's growth potential.
- Company Profile:
The “Table of Contents” is formulated by listing and analyzing more than 25 - 30 companies operating in the market ecosystem across geographies. However, we profile only 10 companies as a standard practice in our syndicate reports. These 10 companies comprise leading, emerging, and regional players. Nonetheless, our analysis is not restricted to the 10 listed companies, we also analyze other companies present in the market to develop a holistic view and understand the prevailing trends. The “Company Profiles” section in the report covers key facts, business description, products & services, financial information, SWOT analysis, and key developments. The financial information presented is extracted from the annual reports and official documents of the publicly listed companies. Upon collecting the information for the sections of respective companies, we verify them via various primary sources and then compile the data in respective company profiles. The company level information helps us in deriving the base number as well as in forecasting the market size.
- Developing Base Number:
Aggregation of sales statistics (2020-2022) and macro-economic factor, and other secondary and primary research insights are utilized to arrive at base number and related market shares for 2022. The data gaps are identified in this step and relevant market data is analyzed, collected from paid primary interviews or databases. On finalizing the base year market size, forecasts are developed on the basis of macro-economic, industry and market growth factors and company level analysis.
- Data Triangulation and Final Review:
The market findings and base year market size calculations are validated from supply as well as demand side. Demand side validations are based on macro-economic factor analysis and benchmarks for respective regions and countries. In case of supply side validations, revenues of major companies are estimated (in case not available) based on industry benchmark, approximate number of employees, product portfolio, and primary interviews revenues are gathered. Further revenue from target product/service segment is assessed to avoid overshooting of market statistics. In case of heavy deviations between supply and demand side values, all thes steps are repeated to achieve synchronization.
We follow an iterative model, wherein we share our research findings with Subject Matter Experts (SME’s) and Key Opinion Leaders (KOLs) until consensus view of the market is not formulated – this model negates any drastic deviation in the opinions of experts. Only validated and universally acceptable research findings are quoted in our reports.
We have important check points that we use to validate our research findings – which we call – data triangulation, where we validate the information, we generate from secondary sources with primary interviews and then we re-validate with our internal data bases and Subject matter experts. This comprehensive model enables us to deliver high quality, reliable data in shortest possible time.
 احصل على عينة مجانية لهذا التقرير