تقرير سوق أتمتة التصميم الفوتوني 2030 حسب القطاعات والجغرافيا والديناميكيات والتطورات الأخيرة والرؤى الاستراتيجية
البيانات التاريخية : 2020-2021 | سنة الأساس : 2022 | فترة التنبؤ : 2023-2030حجم سوق أتمتة التصميم الفوتوني وتوقعاته (2020-2030)، والحصة العالمية والإقليمية، والاتجاهات، وفرص النمو. يغطي التقرير: حسب المكون (الحل والخدمة)، والنشر (محليًا وسحابيًا)، وحجم المؤسسة (الشركات الصغيرة والمتوسطة والكبيرة)، والتطبيق (البحث الأكاديمي والبحث الصناعي والتصنيع)، والجغرافيا.
- تاريخ التقرير : Dec 2023
- رمز التقرير : TIPRE00033004
- الفئة : التكنولوجيا والإعلام والاتصالات
- الحالة : نُشرت
- تنسيقات التقارير المتاحة :


- عدد الصفحات : 162
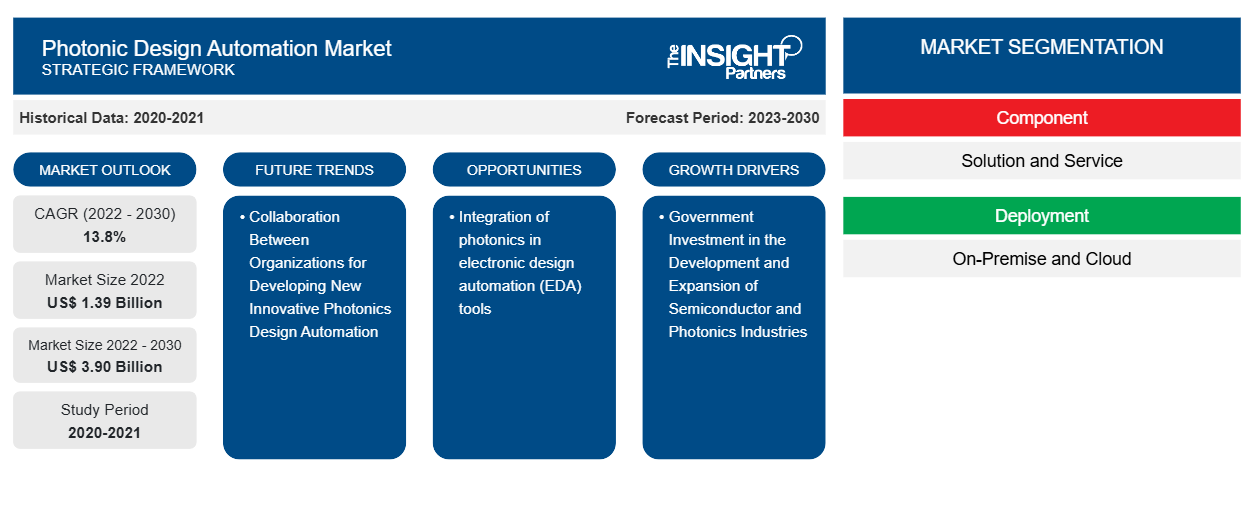
من المتوقع أن يصل حجم سوق أتمتة التصميم الفوتوني إلى 3.90 مليار دولار أمريكي بحلول عام 2030 من 1.39 مليار دولار أمريكي في عام 2022. ومن المتوقع أن يسجل السوق معدل نمو سنوي مركب بنسبة 13.8٪ خلال الفترة 2022-2030. ومن المرجح أن يظل دمج الفوتونيات في أدوات أتمتة التصميم الإلكتروني (EDA) أحد الاتجاهات الرئيسية في السوق.
تحليل سوق أتمتة التصميم الفوتوني
إن التعاون بين المنظمات لتطوير أتمتة تصميم الفوتونيات المبتكرة الجديدة والحاجة المتزايدة إلى الكفاءة والدقة هي المحرك الرئيسي للسوق. ومن المتوقع أن يتوسع السوق بوتيرة كبيرة خلال فترة التوقعات، بسبب الطلب المتزايد على الأتمتة. وعلاوة على ذلك، فإن الاستثمار الحكومي في تطوير وتوسيع صناعات أشباه الموصلات والفوتونيات والتركيز على الحلول عالية الأداء والمستدامة بيئيًا يخلق فرصًا مربحة للسوق.
نظرة عامة على سوق أتمتة التصميم الفوتوني
تتطلب أتمتة التصميم الفوتوني أدوات برمجية وتقنيات أتمتة تسهل تصميم وتطوير الأجهزة والأنظمة الفوتونية من خلال تحويل التصميمات المعقدة بنجاح إلى شرائح أو أجهزة وظيفية. تسعى أتمتة التصميم الفوتوني، مثل أتمتة التصميم الكهربائي (EDA) في صناعة الإلكترونيات، إلى تسريع وتبسيط عملية تصميم المكونات والأنظمة الفوتونية. إنها توفر للمصممين أدوات برمجية وطرق آلية لإنشاء المخططات التخطيطية والتخطيطات ومكونات التصميم الأخرى. تهدف أتمتة التصميم الفوتوني إلى تحسين الكفاءة والدقة والإنتاجية في تصميم وتطوير الأجهزة والأنظمة الفوتونية. تساعد أتمتة أنشطة معينة وتقديم قدرات محاكاة وتحليل شاملة المصممين على استكشاف خيارات تصميم متعددة وتعظيم الأداء وتقليل الوقت المستغرق لطرح المنتج في السوق. يتوسع السوق استجابة للطلب المتزايد على الأتمتة في مجموعة متنوعة من الصناعات، بما في ذلك التصنيع. هناك طلب كبير على الأتمتة بسبب فوائد استخدام أتمتة التصميم الفوتوني، مثل زيادة الإنتاجية وعمليات التصميم الأبسط وسرعة وقت طرح المنتج في السوق.
قم بتخصيص هذا التقرير ليناسب متطلباتك
ستحصل على تخصيص لأي تقرير - مجانًا - بما في ذلك أجزاء من هذا التقرير، أو تحليل على مستوى الدولة، وحزمة بيانات Excel، بالإضافة إلى الاستفادة من العروض والخصومات الرائعة للشركات الناشئة والجامعات
سوق أتمتة التصميم الفوتوني: رؤى استراتيجية
-
احصل على أهم اتجاهات السوق الرئيسية لهذا التقرير.ستتضمن هذه العينة المجانية تحليلاً للبيانات، بدءًا من اتجاهات السوق وحتى التقديرات والتوقعات.
محركات وفرص سوق أتمتة التصميم الفوتوني
التعاون بين المنظمات لتطوير أتمتة تصميم الفوتونيات المبتكرة الجديدة لصالح السوق
تتعاون الحكومة والصناعة والأوساط الأكاديمية في تطوير أتمتة تصميم الفوتونيات من خلال منظمات مثل المعهد الأمريكي لتصنيع الفوتونيات (AIM Photonics). تهدف AIM Photonics إلى تطوير صناعة الفوتونيات من خلال تعزيز الشراكات والابتكار في أتمتة تصميم الفوتونيات الإلكترونية (EPDA). على سبيل المثال، في مايو 2023، كشفت AIM Photonics عن أحدث عروضها: خدمات الاختبار الكهروضوئية الإلكترونية. توفر مجموعة الخدمات الجديدة هذه مجموعة شاملة من الأدوات والقدرات المتطورة لاختبار كل من الدوائر المتكاملة الفوتونية (PICs) والدوائر المتكاملة الإلكترونية التقليدية (ICs). تلبي خدمات الاختبار الكهروضوئية التي تقدمها AIM Photonics الطلب المتزايد على حلول الاختبار المتقدمة في مجال الدوائر المتكاملة. تمكن هذه الخدمات من التقييم الشامل والتحقق من أداء وموثوقية ووظائف كل من الدوائر المتكاملة الفوتونية والإلكترونية.
يمكن أن يُعزى نمو سوق أتمتة تصميم الفوتونيات إلى تطور صناعة أتمتة التصميم الإلكتروني (EDA). كانت أدوات أتمتة التصميم الإلكتروني تركز في البداية على تصميم الدوائر الإلكترونية المتكاملة (ICs) والتحقق منها، ولكنها توسعت لتشمل قدرات تصميم الفوتونيات.
الاستثمار الحكومي في تطوير وتوسيع صناعات أشباه الموصلات والفوتونيات
إن سوق أتمتة تصميم الفوتونيات هو قطاع ديناميكي يدعم تطوير التقنيات الفوتونية. وقد دعمت الحكومة الكندية مبادرات مثل تطوير صناعة أتمتة تصميم الفوتونيات العالمية وتوفير المنتجات الرائدة في هذا المجال. على سبيل المثال، في فبراير 2022، أعلنت الحكومة الكندية عن استثمار كبير بقيمة 240 مليون دولار أمريكي لصناعات أشباه الموصلات والفوتونيات. تهدف هذه الخطوة الاستراتيجية إلى تعزيز نمو هذه القطاعات وقدرتها التنافسية، ووضع كندا كقائد عالمي في مجال التصنيع المحسن والابتكار التكنولوجي . سيدعم الاستثمار تطوير التقنيات المتطورة ومبادرات البحث والتطوير وتوسيع قدرات التصنيع في صناعات أشباه الموصلات والفوتونيات في جميع أنحاء البلاد. كما سيعزز التعاون بين الصناعة والأوساط الأكاديمية والحكومة، مما يدفع الابتكار ويخلق فرص عمل جديدة.
تحليل تجزئة التقرير الفوتوني
إن القطاعات الرئيسية التي ساهمت في استنباط التحليل الفوتوني هي المكون، والنشر، وحجم المنظمة، والتطبيق.
- بناءً على المكون، ينقسم سوق أتمتة التصميم الفوتوني إلى حلول وخدمات. احتل قطاع الحلول حصة سوقية أكبر في عام 2022.
- من خلال النشر، ينقسم السوق إلى سوق محلي وسوق سحابي. وقد استحوذ قطاع السوق المحلي على حصة سوقية أكبر في عام 2022.
- من حيث حجم المنظمة، ينقسم السوق إلى الشركات الصغيرة والمتوسطة الحجم والشركات الكبيرة. احتلت شريحة الشركات الكبيرة حصة سوقية أكبر في عام 2022.
- على أساس التطبيق، يتم تقسيم سوق أتمتة التصميم الفوتوني إلى البحث الأكاديمي والبحث الصناعي والتصنيع. احتل قطاع البحث الصناعي والتصنيع حصة سوقية أكبر في عام 2022.
تحليل حصة سوق أتمتة التصميم الفوتوني حسب المنطقة الجغرافية
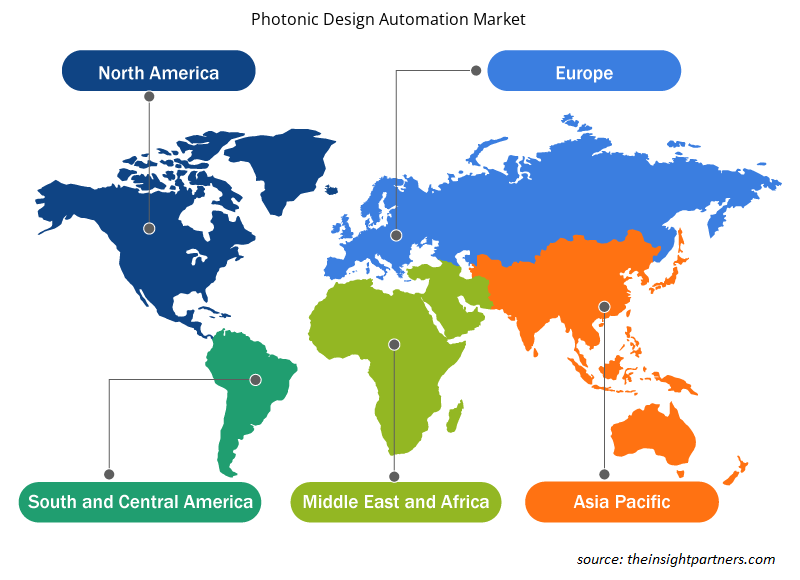
ينقسم النطاق الجغرافي لتقرير سوق أتمتة التصميم الفوتوني بشكل أساسي إلى خمس مناطق: أمريكا الشمالية، ومنطقة آسيا والمحيط الهادئ، وأوروبا، والشرق الأوسط وأفريقيا، وأمريكا الجنوبية والوسطى.
من المتوقع أن يتوسع السوق في منطقة آسيا والمحيط الهادئ خلال فترة التنبؤ، وذلك بسبب وجود صناعات الفوتونيات في الصين وكوريا الجنوبية واليابان والهند. تتمتع كوريا الجنوبية بحضور قوي في صناعة الفوتونيات وهي معروفة بتقدمها التكنولوجي في تكنولوجيا المعلومات والاتصالات. وقد ساهم ذلك في نمو سوق أتمتة تصميم الفوتونيات في البلاد. إن التقدم التكنولوجي والتعاون والاستثمارات في البحث والتطوير تدفع السوق في كوريا الجنوبية. كما يلعب تنفيذ الأتمتة في قطاع التصنيع دورًا في دفع السوق. تعد أتمتة تصميم الفوتونيات أمرًا بالغ الأهمية لتطبيقات مختلفة في كوريا الجنوبية، بما في ذلك الاتصالات ومراكز البيانات والرعاية الصحية والاستشعار. إنها تمكن من التلاعب الفعال بالموجات الكهرومغناطيسية الموجهة وتساهم في تطوير الأجهزة الفوتونية المتقدمة.
رؤى إقليمية حول سوق أتمتة التصميم الفوتوني
لقد قام المحللون في Insight Partners بشرح الاتجاهات والعوامل الإقليمية المؤثرة على سوق أتمتة التصميم الفوتوني طوال فترة التوقعات بشكل شامل. يناقش هذا القسم أيضًا قطاعات سوق أتمتة التصميم الفوتوني والجغرافيا في جميع أنحاء أمريكا الشمالية وأوروبا ومنطقة آسيا والمحيط الهادئ والشرق الأوسط وأفريقيا وأمريكا الجنوبية والوسطى.
- احصل على البيانات الإقليمية المحددة لسوق أتمتة التصميم الفوتوني
نطاق تقرير سوق أتمتة التصميم الفوتوني
| سمة التقرير | تفاصيل |
|---|---|
| حجم السوق في عام 2022 | 1.39 مليار دولار أمريكي |
| حجم السوق بحلول عام 2030 | 3.90 مليار دولار أمريكي |
| معدل النمو السنوي المركب العالمي (2022 - 2030) | 13.8% |
| البيانات التاريخية | 2020-2021 |
| فترة التنبؤ | 2023-2030 |
| القطاعات المغطاة |
حسب المكون
|
| المناطق والدول المغطاة |
أمريكا الشمالية
|
| قادة السوق وملفات تعريف الشركات الرئيسية |
|
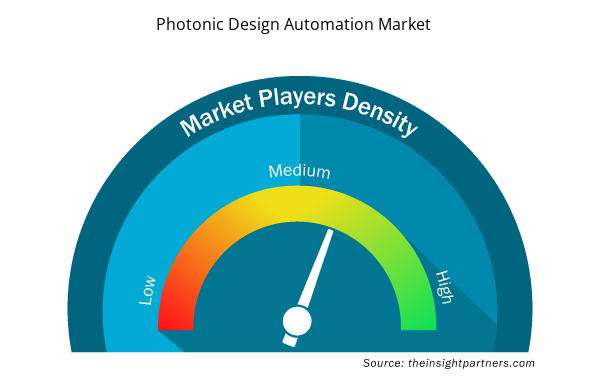
كثافة اللاعبين في السوق: فهم تأثيرها على ديناميكيات الأعمال
يشهد سوق أتمتة التصميم الفوتوني نموًا سريعًا، مدفوعًا بالطلب المتزايد من المستخدم النهائي بسبب عوامل مثل تفضيلات المستهلك المتطورة والتقدم التكنولوجي والوعي الأكبر بفوائد المنتج. ومع ارتفاع الطلب، تعمل الشركات على توسيع عروضها والابتكار لتلبية احتياجات المستهلكين والاستفادة من الاتجاهات الناشئة، مما يؤدي إلى زيادة نمو السوق.
تشير كثافة اللاعبين في السوق إلى توزيع الشركات أو المؤسسات العاملة في سوق أو صناعة معينة. وهي تشير إلى عدد المنافسين (اللاعبين في السوق) الموجودين في مساحة سوق معينة نسبة إلى حجمها أو قيمتها السوقية الإجمالية.
الشركات الرئيسية العاملة في سوق أتمتة التصميم الفوتوني هي:
- شركة أنسيس
- ليونيكس الدولية بي في
- شركة VPlphotonics GmbH
- شركة أوبتيويف سيستمز
- لوسيدا فوتونيكس
- شركة كادنس ديزاين سيستمز
إخلاء المسؤولية : الشركات المذكورة أعلاه ليست مرتبة بأي ترتيب معين.
- احصل على نظرة عامة على أهم اللاعبين الرئيسيين في سوق أتمتة التصميم الفوتوني
أخبار سوق أتمتة التصميم الفوتوني والتطورات الأخيرة
يتم تقييم سوق أتمتة التصميم الفوتوني من خلال جمع البيانات النوعية والكمية بعد البحث الأولي والثانوي، والتي تتضمن منشورات الشركات المهمة وبيانات الجمعيات وقواعد البيانات. فيما يلي بعض التطورات في سوق أتمتة التصميم الفوتوني:
- أعلنت شركة Luceda Photonics عن تعاونها مع شركة Aluvia Photonics، أول مصنع Al2O3 في العالم لتطبيقات الفوتونيات المتكاملة. يوفر هذا التعاون للمصممين مجموعة تصميم عملية متقدمة (PDK) ضمن منصة تصميم Luceda Photonics، مما يتيح الوصول إلى عمليات رقاقة المشروعات المتعددة (MPW) القادمة في Aluvia Photonics. (المصدر: Luceda Photonics، موقع الشركة على الويب، أغسطس 2023).
- أعلنت شركة AIM Photonics عن إطلاق خدمات الاختبار الكهروضوئية الجديدة، والتي تتميز بمجموعة كاملة من الأدوات المتقدمة لاختبار كل من الدوائر المتكاملة الفوتونية (PICs) وكذلك الدوائر المتكاملة الإلكترونية التقليدية. (المصدر: AIM Photonics Inc، موقع الشركة على الويب، مايو 2023).
تقرير سوق أتمتة التصميم الفوتوني والتغطية والنتائج المتوقعة
يوفر تقرير "حجم سوق أتمتة التصميم الفوتوني والتوقعات (2020-2030)" تحليلاً مفصلاً للسوق يغطي المجالات التالية:
- حجم سوق أتمتة التصميم الفوتوني وتوقعاته على المستويات العالمية والإقليمية والوطنية لجميع قطاعات السوق الرئيسية التي يغطيها النطاق
- اتجاهات سوق أتمتة التصميم الفوتوني بالإضافة إلى ديناميكيات السوق مثل المحركات والقيود والفرص الرئيسية
- تحليل مفصل لقوى PEST/Porter الخمس وSWOT
- تحليل سوق أتمتة التصميم الفوتوني الذي يغطي اتجاهات السوق الرئيسية والإطار العالمي والإقليمي واللاعبين الرئيسيين واللوائح والتطورات الأخيرة في السوق
- تحليل المشهد الصناعي والمنافسة الذي يغطي تركيز السوق، وتحليل خريطة الحرارة، واللاعبين البارزين، والتطورات الأخيرة لسوق أتمتة التصميم الفوتوني
- ملفات تعريف الشركة التفصيلية

أنكيتا خبيرة ديناميكية في أبحاث السوق والاستشارات، تتمتع بخبرة تزيد عن 8 سنوات في قطاعات التكنولوجيا والإعلام وتكنولوجيا المعلومات والاتصالات والإلكترونيات وأشباه الموصلات. وقد قادت ونفذت بنجاح أكثر من 100 مهمة استشارية وبحثية لعملاء عالميين مثل مايكروسوفت وأوراكل وشركة NEC وSAP وKPMG وExpeditors International. تشمل كفاءاتها الأساسية تقييم السوق، وتحليل البيانات، والتنبؤ، وصياغة الاستراتيجيات، والاستخبارات التنافسية، وكتابة التقارير.
أنكيتا بارعة في إدارة دورات المشاريع الكاملة، بدءًا من تصميم عروض ما قبل البيع ومناقشات العملاء، وصولًا إلى تقديم رؤى عملية بعد البيع. كما أنها ماهرة في إدارة فرق متعددة الوظائف، وهيكلة وحدات بحثية معقدة، ومواءمة الحلول مع أهداف العمل الخاصة بالعملاء. وقد مكنتها مهاراتها الممتازة في التواصل والقيادة والعرض التقديمي من تحقيق نتائج قيّمة باستمرار في بيئات سوقية سريعة التطور.
- التحليل التاريخي (سنتان)، سنة الأساس، التوقعات (7 سنوات) مع معدل النمو السنوي المركب
- تحليل PEST و SWOT
- حجم السوق والقيمة / الحجم - عالمي، إقليمي، بلد
- الصناعة والمنافسة
- مجموعة بيانات إكسل
التقارير الحديثة
شهادات العملاء
تقرير سوق أنظمة SCADA من Insight Partners شامل، ويقدم رؤى قيّمة حول الاتجاهات الحالية والتوقعات المستقبلية. تميّز الفريق باحترافية عالية وسرعة في الاستجابة ودعم مستمر طوال الوقت. نحن راضون جدًا ونوصي بشدة بخدماتهم.
ران كيديم شريك, شركة ريالي تكنولوجيز المحدودةطلبتُ تقريرًا عن سوق برمجيات محدد، وأعدّه الفريق في غضون أيام قليلة. كانت المعلومات ذات صلة وثيقة وعرضها جيد. ثم طلبتُ بعض التعديلات والإضافات على التقرير. وكان الفريق متجاوبًا للغاية، وحصلتُ على التقرير النهائي في أقل من أسبوع.
جان هيرفيه جين رئيس مجلس الإدارة, فيوتشر أناليتيكاعملنا مع شركة "إنسايت بارتنرز" لإجراء دراسة سوقية وتوقعات مهمة. زودونا برؤى واضحة حول الفرص والمخاطر، مما ساعدنا في صياغة خططنا. كانت أبحاثهم سهلة الاستخدام ومبنية على بيانات دقيقة، مما ساعدنا على اتخاذ قرارات ذكية وواثقة. نوصي بهم بشدة.
بيوش ناجبال نائب الرئيس الأول, شعاع عالي عالميقدّمت شركة Insight Partners أبحاثًا سوقية ثاقبة ومنظمة جيدًا بخبرة واسعة في هذا المجال. تميّز فريقهم بالاحترافية وسرعة الاستجابة طوال الوقت. وسهّل موقعهم الإلكتروني سهل الاستخدام الوصول إلى تقارير القطاع. نوصي بهم بشدة لخدمات بحثية موثوقة وعالية الجودة.
يوكيهيكو أداتشي المدير التنفيذي, ديب بلو، ذ.م.م.هذه أول مرة أشتري فيها تقرير سوق من The Insight Partners. رغم أنني كنت مترددًا في البداية، إلا أنني زرت موقعهم الإلكتروني وشعرت براحة أكبر للمخاطرة وشراء تقرير السوق. أنا راضٍ تمامًا عن جودة التقرير وخدمة العملاء. كانت لديّ عدة أسئلة وتعليقات حول التقرير الأولي، ولكن بعد بضع محادثات عبر البريد الإلكتروني مع محللهم، أعتقد أن لديّ تقريرًا يمكنني استخدامه كمدخل لعملية التخطيط الاستراتيجي لدينا. شكرًا جزيلاً لكم على تخصيص وقتكم الإضافي وجعل هذه التجربة إيجابية. سأوصي بخدماتكم للآخرين بالتأكيد، وستكونون أول من ألجأ إليه عندما نحتاج إلى المزيد من بيانات السوق.
جون سوزوكي الرئيس والرئيس التنفيذي وعضو مجلس الإدارة, بي كيه تكنولوجيزأود أن أقدّر دعمكم واحترافيتكم في الاستجابة لطلبي للحصول على معلومات بشأن سوق التشخيص المخبري للأمراض المعدية في نيجيريا. كما أُقدّر صبركم وتوجيهكم، واستعدادكم لتقديم خصم، مما مكّننا في النهاية من إتمام الصفقة. أتطلع إلى التعامل مع "ذا إنسايت بارتنرز" مستقبلًا، كل ذلك بفضل الانطباع الذي تركتموه لديّ نتيجةً لهذا اللقاء الأول.
الدكتور تشيجيوك أونيا المدير الإداري, شركة باينكريست للرعاية الصحية المحدودةسبب الشراء
- اتخاذ قرارات مدروسة
- فهم ديناميكيات السوق
- تحليل المنافسة
- رؤى العملاء
- توقعات السوق
- تخفيف المخاطر
- التخطيط الاستراتيجي
- مبررات الاستثمار
- تحديد الأسواق الناشئة
- تحسين استراتيجيات التسويق
- تعزيز الكفاءة التشغيلية
- مواكبة التوجهات التنظيمية


 احصل على عينة مجانية ل - سوق أتمتة التصميم الفوتوني