تحليلات تنبؤية لتحليل السوق والتنبؤ بها حسب الحجم والمشاركة والنمو والاتجاهات 2031
البيانات التاريخية : 2021-2022 | سنة الأساس : 2023 | فترة التنبؤ : 2024-2031حجم سوق التحليلات التنبؤية وتوقعاته (2021-2031)، والحصة العالمية والإقليمية، والاتجاهات، وفرص النمو. يغطي التقرير: حسب المكونات [الحل (تحليلات المخاطر، تحليلات التسويق، تحليلات المبيعات، تحليلات العملاء، وغيرها) والخدمة]، وطريقة النشر (محليًا وسحابيًا)، وحجم المؤسسة [الشركات الصغيرة والمتوسطة والشركات الكبيرة]، والقطاعات الصناعية (تكنولوجيا المعلومات والاتصالات، والخدمات المصرفية والمالية والتأمين، والطاقة والمرافق، والحكومة والدفاع، وتجارة التجزئة والتجارة الإلكترونية، والتصنيع، وغيرها)، والجغرافيا.
- تاريخ التقرير : Mar 2026
- رمز التقرير : TIPTE100000160
- الفئة : التكنولوجيا والإعلام والاتصالات
- الحالة : البيانات الصادرة
- تنسيقات التقارير المتاحة :


- عدد الصفحات : 150
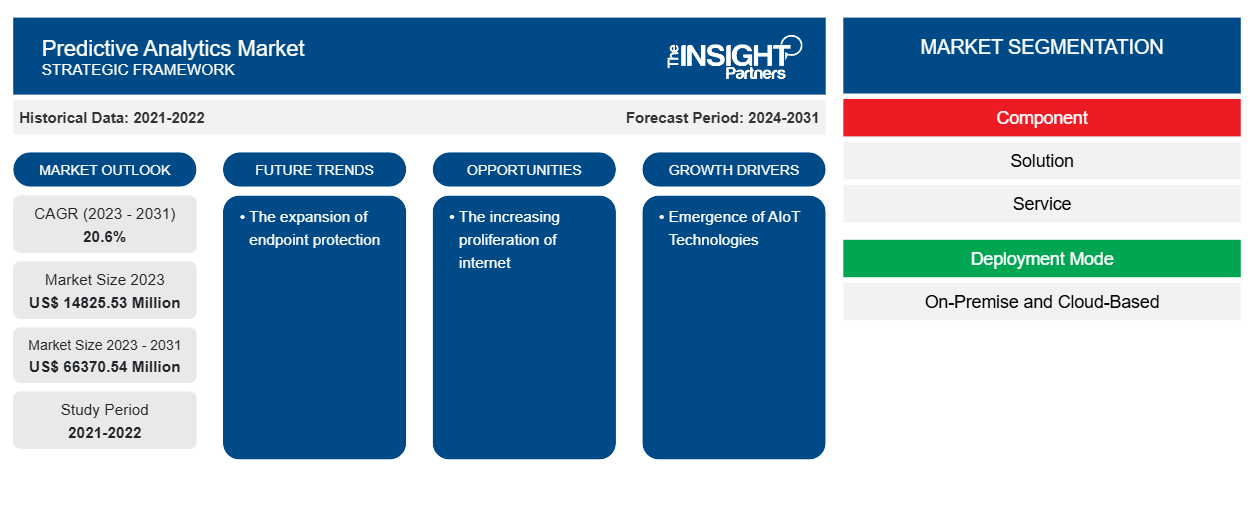
من المتوقع أن يصل حجم سوق التحليلات التنبؤية إلى 66370.54 مليون دولار أمريكي بحلول عام 2031 من 14825.53 مليون دولار أمريكي في عام 2023. ومن المتوقع أن يسجل السوق معدل نمو سنوي مركب بنسبة 20.6٪ خلال الفترة 2023-2031. ومن المرجح أن يظل توسع حماية نقاط النهاية اتجاهًا رئيسيًا في السوق.
تحليلات السوق التنبؤية
مع انتشار استخدام أدوات التحليلات التنبؤية المتطورة على نطاق واسع، تستخدم الشركات الآن البيانات الضخمة للكشف بشكل استباقي عن الاحتمالات والمخاطر. أصبحت التحليلات التنبؤية الآن أكثر سهولة من أي وقت مضى بفضل التكنولوجيا الحديثة. تحتاج الشركة إلى تحديد غرض تجاري قبل أن تتمكن من استخدام التحليلات التنبؤية، سواء لتعزيز المبيعات أو تبسيط العمليات أو تعزيز رضا العملاء. بعد ذلك، باستخدام الأدوات المناسبة، قد تتمكن هذه المنظمة من إنشاء نماذج تحليلات تنبؤية وإنتاج رؤى قابلة للتنفيذ وغربلة كميات هائلة من البيانات غير المتجانسة من أجل تحقيق هذا الهدف.
نظرة عامة على سوق التحليلات التنبؤية
التحليلات التنبؤية هي مجال فرعي من التحليلات المتقدمة التي تستخدم البيانات التاريخية جنبًا إلى جنب مع النمذجة الإحصائية واستخراج البيانات والتعلم الآلي للتنبؤ بالأحداث المستقبلية. تستخدم الشركات التحليلات التنبؤية للبحث عن اتجاهات في هذه البيانات لتحديد الاحتمالات والمخاطر. غالبًا ما ترتبط التحليلات التنبؤية بعلم البيانات والبيانات الضخمة. الشركات مثقلة حاليًا بالبيانات، والتي يتم تخزينها في مستودعات بيانات مختلفة في جميع أنحاء الشركة وتتضمن ملفات السجل والصور ومقاطع الفيديو. يستخدم علماء البيانات خوارزميات التعلم الآلي والتعلم العميق لتحديد الاتجاهات في البيانات والتنبؤ بالأحداث المستقبلية من أجل استخراج رؤى قيمة. الشبكات العصبية وأشجار القرار ونماذج الانحدار اللوجستي والخطي وغيرها من التقنيات الإحصائية هي بعض من هذه. تستفيد استراتيجيات النمذجة معينة من رؤى التنبؤ الأولية للحصول على رؤى أكثر تنبؤًا.
قم بتخصيص هذا التقرير ليناسب متطلباتك
ستحصل على تخصيص لأي تقرير - مجانًا - بما في ذلك أجزاء من هذا التقرير، أو تحليل على مستوى الدولة، وحزمة بيانات Excel، بالإضافة إلى الاستفادة من العروض والخصومات الرائعة للشركات الناشئة والجامعات
سوق التحليلات التنبؤية: رؤى استراتيجية
-
احصل على أهم اتجاهات السوق الرئيسية لهذا التقرير.ستتضمن هذه العينة المجانية تحليلاً للبيانات، بدءًا من اتجاهات السوق وحتى التقديرات والتوقعات.
محركات وفرص سوق التحليلات التنبؤية
ظهور تقنيات الذكاء الاصطناعي للأشياء (AIoT).
تتحد البنية الأساسية لإنترنت الأشياء وتقنيات الذكاء الاصطناعي لتشكيل الذكاء الاصطناعي للأشياء. يسعى الذكاء الاصطناعي إلى زيادة إدارة البيانات وتحليلها والتفاعلات بين الإنسان والآلة وكفاءة عمليات إنترنت الأشياء. يتم استخدام الذكاء الاصطناعي على نطاق واسع في التعرف على الكلام والرؤية الآلية ومعالجة اللغة الطبيعية. الذكاء الاصطناعي هو محاكاة عمليات الذكاء البشري بواسطة أجهزة الكمبيوتر، وخاصة أنظمة الكمبيوتر. إنترنت الأشياء هو نظام من أجهزة الحوسبة المترابطة والآلات الرقمية والميكانيكية أو العناصر التي قد تنقل البيانات عبر شبكة بدون واجهة من إنسان إلى إنسان أو من إنسان إلى كمبيوتر. يعد الذكاء الاصطناعي ثوريًا ومفيدًا لكلا النوعين من التكنولوجيا، حيث يعمل الذكاء الاصطناعي على تحسين عملية اتخاذ القرار ويضيف قيمة إلى إنترنت الأشياء من خلال قدرات التعلم الآلي.
الانتشار المتزايد للإنترنت
إن انتشار الإنترنت ينمو على مستوى العالم. وبالتالي، فإن التبني المتزايد لبدائل أنظمة الإضاءة ذات الأنفاق البيئية يخلق المزيد من الفرص للسوق. في بداية أبريل 2024، كان هناك 5.44 مليار مستخدم للإنترنت في جميع أنحاء العالم، أو 67.1 في المائة من إجمالي سكان العالم. يشير هذا الرقم المذهل إلى أن عدد مستخدمي الإنترنت الآن يزيد عن ضعف عدد غير المستخدمين، مما يجعل مستخدمي الإنترنت "أغلبية عظمى". كما يتزايد عدد الأشخاص الذين يستخدمون الإنترنت؛ وفقًا لأحدث الأرقام، أصبح 178 مليون شخص إضافي في جميع أنحاء العالم متصلين في العام المنتهي في أبريل 2024. وبالتالي، فإن الانتشار المتزايد للإنترنت يخلق فرصًا مختلفة لسوق التحليلات التنبؤية.
تقرير تحليلات السوق التنبؤية وتحليل التجزئة
إن القطاعات الرئيسية التي ساهمت في استنباط تحليل سوق التحليلات التنبؤية هي المكون، وطريقة النشر، وحجم المنظمة، والقطاع الرأسي.
- بناءً على المكون، ينقسم سوق التحليلات التنبؤية إلى حلول (تحليلات المخاطر، وتحليلات التسويق، وتحليلات المبيعات، وتحليلات العملاء، وغيرها) وخدمات. احتل قطاع الحلول حصة سوقية أكبر في عام 2023.
- بحسب طريقة النشر، يتم تقسيم السوق إلى محلي ومبني على السحابة. احتل قطاع السحابة حصة سوقية أكبر في عام 2023.
- بحسب حجم المنظمة، يتم تقسيم السوق إلى الشركات الصغيرة والمتوسطة (SMEs) والشركات الكبيرة.
- بحسب القطاع الصناعي، يتم تقسيم السوق إلى تكنولوجيا المعلومات والاتصالات، والخدمات المصرفية والمالية والتأمين، والطاقة والمرافق، والحكومة والدفاع، وتجارة التجزئة والتجارة الإلكترونية، والتصنيع، وغيرها.
تحليل حصة سوق التحليلات التنبؤية حسب المنطقة الجغرافية
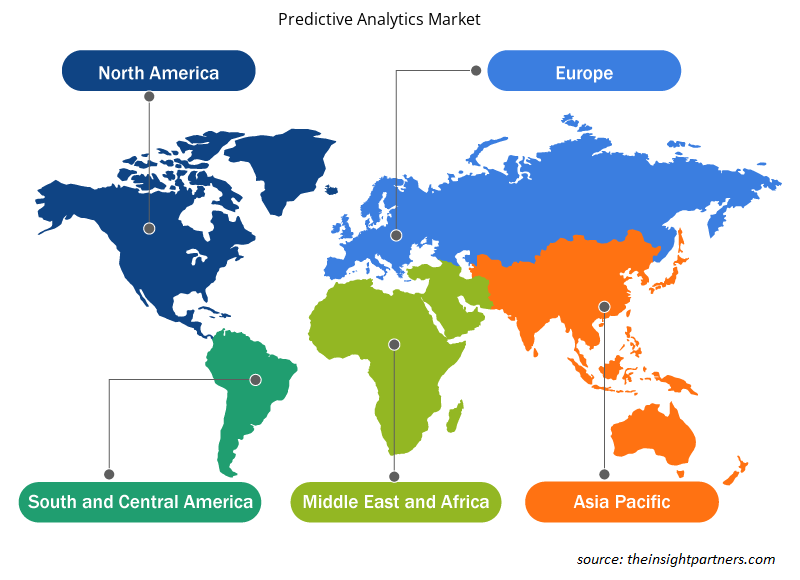
ينقسم النطاق الجغرافي لتقرير سوق التحليلات التنبؤية بشكل أساسي إلى خمس مناطق: أمريكا الشمالية، ومنطقة آسيا والمحيط الهادئ، وأوروبا، والشرق الأوسط وأفريقيا، وأمريكا الجنوبية والوسطى.
تهيمن منطقة آسيا والمحيط الهادئ على سوق التحليلات التنبؤية. ويشهد سوق التحليلات التنبؤية في هذه المنطقة نموًا بسبب عوامل مختلفة، مثل زيادة استخدام الإنترنت والتقدم التكنولوجي. وتستثمر الشركات في المنطقة المزيد من الأموال والطاقة في تحديد حلول الإدارة الذكية المصممة خصيصًا لإدارة التهديدات الأمنية المرتبطة بنماذج العمل من المنزل. وبالتالي، من المتوقع أن تشهد سوق التحليلات التنبؤية نموًا كبيرًا في السنوات القليلة المقبلة.
رؤى إقليمية حول سوق التحليلات التنبؤية
لقد قام المحللون في Insight Partners بشرح الاتجاهات والعوامل الإقليمية المؤثرة على سوق التحليلات التنبؤية طوال فترة التنبؤ بشكل شامل. يناقش هذا القسم أيضًا قطاعات سوق التحليلات التنبؤية والجغرافيا في جميع أنحاء أمريكا الشمالية وأوروبا ومنطقة آسيا والمحيط الهادئ والشرق الأوسط وأفريقيا وأمريكا الجنوبية والوسطى.
- احصل على البيانات الإقليمية المحددة لسوق التحليلات التنبؤية
نطاق تقرير سوق التحليلات التنبؤية
| سمة التقرير | تفاصيل |
|---|---|
| حجم السوق في عام 2023 | 14825.53 مليون دولار أمريكي |
| حجم السوق بحلول عام 2031 | 66370.54 مليون دولار أمريكي |
| معدل النمو السنوي المركب العالمي (2023 - 2031) | 20.6% |
| البيانات التاريخية | 2021-2022 |
| فترة التنبؤ | 2024-2031 |
| القطاعات المغطاة |
حسب المكون
|
| المناطق والدول المغطاة |
أمريكا الشمالية
|
| قادة السوق وملفات تعريف الشركات الرئيسية |
|
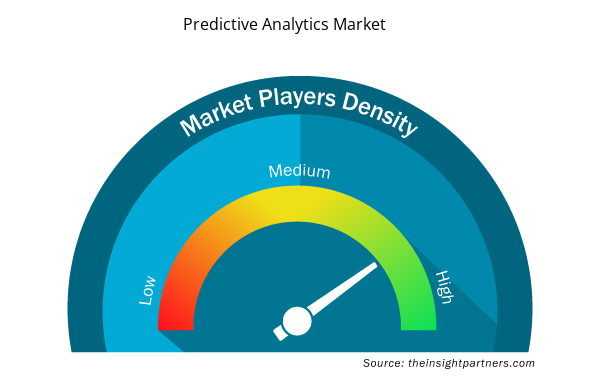
كثافة اللاعبين في سوق التحليلات التنبؤية: فهم تأثيرها على ديناميكيات الأعمال
يشهد سوق التحليلات التنبؤية نموًا سريعًا، مدفوعًا بالطلب المتزايد من المستخدم النهائي بسبب عوامل مثل تفضيلات المستهلكين المتطورة والتقدم التكنولوجي والوعي المتزايد بفوائد المنتج. ومع ارتفاع الطلب، تعمل الشركات على توسيع عروضها والابتكار لتلبية احتياجات المستهلكين والاستفادة من الاتجاهات الناشئة، مما يؤدي إلى زيادة نمو السوق.
تشير كثافة اللاعبين في السوق إلى توزيع الشركات أو المؤسسات العاملة في سوق أو صناعة معينة. وهي تشير إلى عدد المنافسين (اللاعبين في السوق) الموجودين في مساحة سوق معينة نسبة إلى حجمها أو قيمتها السوقية الإجمالية.
الشركات الرئيسية العاملة في سوق التحليلات التنبؤية هي:
- شركة آي بي إم
- شركة مايكروسوفت
- شركة أوراكل
- ساب اس اي
- شركة جوجل المحدودة
- معهد SAS
إخلاء المسؤولية : الشركات المذكورة أعلاه ليست مرتبة بأي ترتيب معين.
- احصل على نظرة عامة على أهم اللاعبين الرئيسيين في سوق التحليلات التنبؤية
أخبار سوق التحليلات التنبؤية والتطورات الأخيرة
يتم تقييم سوق التحليلات التنبؤية من خلال جمع البيانات النوعية والكمية بعد البحث الأولي والثانوي، والذي يتضمن منشورات الشركات المهمة وبيانات الجمعيات وقواعد البيانات. فيما يلي بعض التطورات في سوق التحليلات التنبؤية:
- أعلنت شركة mPulse، الشركة الرائدة في مجال الذكاء الاصطناعي التفاعلي وحلول المشاركة الرقمية لصناعة الرعاية الصحية، عن زخم قوي في الربع الأول من عام 2024 مقارنة بالربع الأول من عام 2023 مع نمو في جميع قطاعات الأعمال. كما أعلنت الشركة عن إطلاق قدرات منتجات التحليلات التنبؤية المتكاملة والمشاركة متعددة القنوات، مما أدى إلى إنشاء فئة جديدة ضمن النظام البيئي للصحة الرقمية. (المصدر: mPulse، بيان صحفي، مايو 2024)
- أعلنت شركة AVEVA، الشركة العالمية الرائدة في مجال البرمجيات الصناعية، والتي تعمل على تعزيز الابتكار والاستدامة، عن إطلاق أحدث إصدار من برنامج AVEVA Predictive Analytics، والذي تم تصميمه خصيصًا للمراقبة التنبؤية للأصول الصناعية في قطاعات النفط والغاز والطاقة والمواد الكيميائية والتعدين والمعادن والتصنيع. يساعد البرنامج المشغلين الصناعيين على تحقيق أعلى مستويات الموثوقية والأداء الممكنة للأصول الصناعية مع تحسين الاستدامة وزيادة إنتاجية القوى العاملة. (المصدر: AVEVA، بيان صحفي، فبراير 2023)
تغطية تقرير سوق التحليلات التنبؤية والمنتجات النهائية
يوفر تقرير "حجم سوق التحليلات التنبؤية والتوقعات (2021-2031)" تحليلاً مفصلاً للسوق يغطي المجالات التالية:
- حجم سوق التحليلات التنبؤية والتوقعات على المستويات العالمية والإقليمية والوطنية لجميع قطاعات السوق الرئيسية التي يغطيها النطاق
- اتجاهات سوق التحليلات التنبؤية بالإضافة إلى ديناميكيات السوق مثل المحركات والقيود والفرص الرئيسية
- تحليل مفصل لقوى PEST/Porter الخمس وSWOT
- تحليل سوق التحليلات التنبؤية الذي يغطي اتجاهات السوق الرئيسية والإطار العالمي والإقليمي والجهات الفاعلة الرئيسية واللوائح والتطورات الأخيرة في السوق
- تحليل المشهد الصناعي والمنافسة الذي يغطي تركيز السوق، وتحليل خريطة الحرارة، واللاعبين البارزين، والتطورات الأخيرة لسوق التحليلات التنبؤية
- ملفات تعريف الشركة التفصيلية

أنكيتا خبيرة ديناميكية في أبحاث السوق والاستشارات، تتمتع بخبرة تزيد عن 8 سنوات في قطاعات التكنولوجيا والإعلام وتكنولوجيا المعلومات والاتصالات والإلكترونيات وأشباه الموصلات. وقد قادت ونفذت بنجاح أكثر من 100 مهمة استشارية وبحثية لعملاء عالميين مثل مايكروسوفت وأوراكل وشركة NEC وSAP وKPMG وExpeditors International. تشمل كفاءاتها الأساسية تقييم السوق، وتحليل البيانات، والتنبؤ، وصياغة الاستراتيجيات، والاستخبارات التنافسية، وكتابة التقارير.
أنكيتا بارعة في إدارة دورات المشاريع الكاملة، بدءًا من تصميم عروض ما قبل البيع ومناقشات العملاء، وصولًا إلى تقديم رؤى عملية بعد البيع. كما أنها ماهرة في إدارة فرق متعددة الوظائف، وهيكلة وحدات بحثية معقدة، ومواءمة الحلول مع أهداف العمل الخاصة بالعملاء. وقد مكنتها مهاراتها الممتازة في التواصل والقيادة والعرض التقديمي من تحقيق نتائج قيّمة باستمرار في بيئات سوقية سريعة التطور.
- التحليل التاريخي (سنتان)، سنة الأساس، التوقعات (7 سنوات) مع معدل النمو السنوي المركب
- تحليل PEST و SWOT
- حجم السوق والقيمة / الحجم - عالمي، إقليمي، بلد
- الصناعة والمنافسة
- مجموعة بيانات إكسل
التقارير الحديثة
شهادات العملاء
تقرير سوق أنظمة SCADA من Insight Partners شامل، ويقدم رؤى قيّمة حول الاتجاهات الحالية والتوقعات المستقبلية. تميّز الفريق باحترافية عالية وسرعة في الاستجابة ودعم مستمر طوال الوقت. نحن راضون جدًا ونوصي بشدة بخدماتهم.
ران كيديم شريك, شركة ريالي تكنولوجيز المحدودةطلبتُ تقريرًا عن سوق برمجيات محدد، وأعدّه الفريق في غضون أيام قليلة. كانت المعلومات ذات صلة وثيقة وعرضها جيد. ثم طلبتُ بعض التعديلات والإضافات على التقرير. وكان الفريق متجاوبًا للغاية، وحصلتُ على التقرير النهائي في أقل من أسبوع.
جان هيرفيه جين رئيس مجلس الإدارة, فيوتشر أناليتيكاعملنا مع شركة "إنسايت بارتنرز" لإجراء دراسة سوقية وتوقعات مهمة. زودونا برؤى واضحة حول الفرص والمخاطر، مما ساعدنا في صياغة خططنا. كانت أبحاثهم سهلة الاستخدام ومبنية على بيانات دقيقة، مما ساعدنا على اتخاذ قرارات ذكية وواثقة. نوصي بهم بشدة.
بيوش ناجبال نائب الرئيس الأول, شعاع عالي عالميقدّمت شركة Insight Partners أبحاثًا سوقية ثاقبة ومنظمة جيدًا بخبرة واسعة في هذا المجال. تميّز فريقهم بالاحترافية وسرعة الاستجابة طوال الوقت. وسهّل موقعهم الإلكتروني سهل الاستخدام الوصول إلى تقارير القطاع. نوصي بهم بشدة لخدمات بحثية موثوقة وعالية الجودة.
يوكيهيكو أداتشي المدير التنفيذي, ديب بلو، ذ.م.م.هذه أول مرة أشتري فيها تقرير سوق من The Insight Partners. رغم أنني كنت مترددًا في البداية، إلا أنني زرت موقعهم الإلكتروني وشعرت براحة أكبر للمخاطرة وشراء تقرير السوق. أنا راضٍ تمامًا عن جودة التقرير وخدمة العملاء. كانت لديّ عدة أسئلة وتعليقات حول التقرير الأولي، ولكن بعد بضع محادثات عبر البريد الإلكتروني مع محللهم، أعتقد أن لديّ تقريرًا يمكنني استخدامه كمدخل لعملية التخطيط الاستراتيجي لدينا. شكرًا جزيلاً لكم على تخصيص وقتكم الإضافي وجعل هذه التجربة إيجابية. سأوصي بخدماتكم للآخرين بالتأكيد، وستكونون أول من ألجأ إليه عندما نحتاج إلى المزيد من بيانات السوق.
جون سوزوكي الرئيس والرئيس التنفيذي وعضو مجلس الإدارة, بي كيه تكنولوجيزأود أن أقدّر دعمكم واحترافيتكم في الاستجابة لطلبي للحصول على معلومات بشأن سوق التشخيص المخبري للأمراض المعدية في نيجيريا. كما أُقدّر صبركم وتوجيهكم، واستعدادكم لتقديم خصم، مما مكّننا في النهاية من إتمام الصفقة. أتطلع إلى التعامل مع "ذا إنسايت بارتنرز" مستقبلًا، كل ذلك بفضل الانطباع الذي تركتموه لديّ نتيجةً لهذا اللقاء الأول.
الدكتور تشيجيوك أونيا المدير الإداري, شركة باينكريست للرعاية الصحية المحدودةسبب الشراء
- اتخاذ قرارات مدروسة
- فهم ديناميكيات السوق
- تحليل المنافسة
- رؤى العملاء
- توقعات السوق
- تخفيف المخاطر
- التخطيط الاستراتيجي
- مبررات الاستثمار
- تحديد الأسواق الناشئة
- تحسين استراتيجيات التسويق
- تعزيز الكفاءة التشغيلية
- مواكبة التوجهات التنظيمية


 احصل على عينة مجانية ل - سوق التحليلات التنبؤية