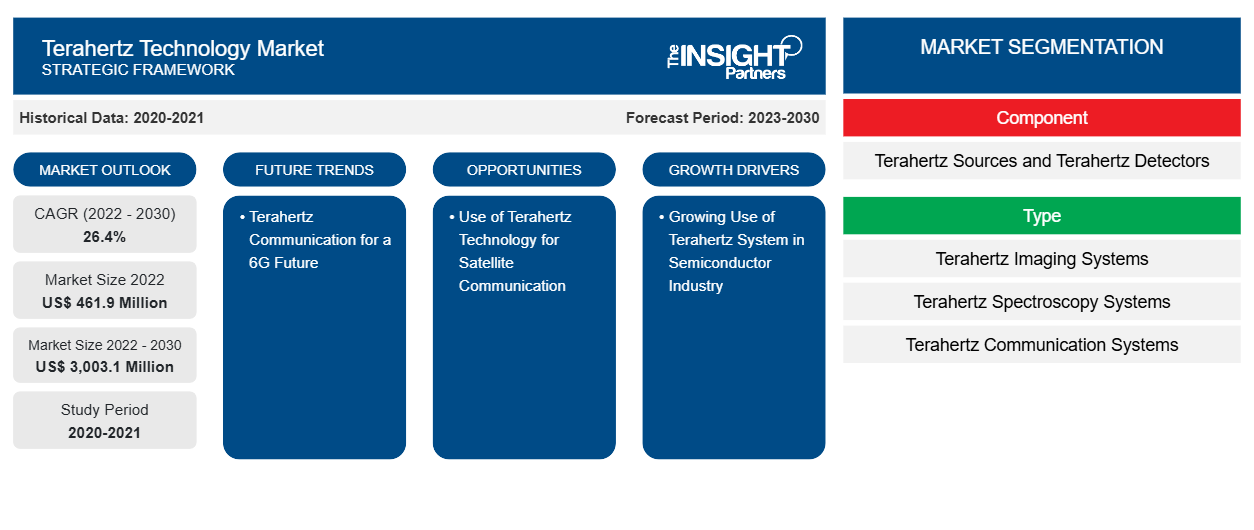
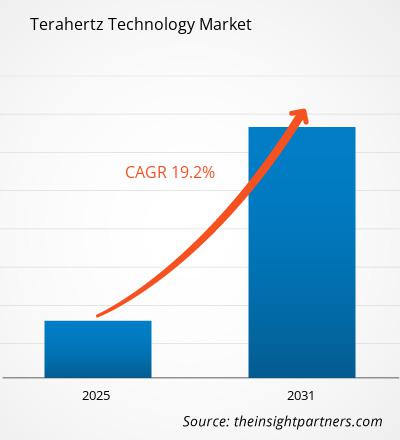
قُدِّر حجم سوق تقنية التيراهيرتز بـ 736.01 مليون دولار أمريكي في عام 2024، ومن المتوقع أن يصل إلى 2500.55 مليون دولار أمريكي بحلول عام 2031؛ ومن المتوقع أن يسجل معدل نمو سنوي مركب بنسبة 19.2% بين عامي 2025 و2031. ومن المرجح أن يبرز استخدام تقنية التيراهيرتز في الاتصالات عبر الأقمار الصناعية ودمج الذكاء الاصطناعي في أنظمة التيراهيرتز كتوجه رئيسي في السوق.
تحليل سوق تقنية تيراهرتز
تُسهم عواملٌ مثل الطلب المتزايد على تقنية التيراهيرتز من قطاعات الدفاع والأمن الداخلي والقطاع الطبي، والاستخدام المتزايد لأنظمة التيراهيرتز في صناعة أشباه الموصلات، والتطورات التكنولوجية، في نمو السوق. وبالمثل، من المرجح أن تُتيح تطبيقات معالجة تقنية التيراهيرتز في صناعة الأغذية، وتوسع تقنية الجيل السادس (6G)، فرص نمو مستقبلية للسوق. ويُعدّ استخدام تقنية التيراهيرتز في الاتصالات عبر الأقمار الصناعية، ودمج الذكاء الاصطناعي في أنظمة التيراهيرتز، من الاتجاهات الرئيسية في السوق.
نظرة عامة على سوق تقنية تيراهرتز
في الطيف الكهرومغناطيسي، يتراوح نطاق تيراهرتز بين طيف الموجات الدقيقة والأشعة تحت الحمراء، والذي يشمل تردد مليون ذبذبة في الثانية. ونظرًا للخصائص الاستثنائية لإشعاع تيراهرتز، فمن المرجح اعتماد هذه التقنية في المستقبل. تُستخدم هذه التقنية للكشف عن المتفجرات والمخدرات المخفية، بالإضافة إلى التعرف على المواد المتدفقة من الأنابيب البلاستيكية. تتميز تقنية تيراهرتز بالكفاءة الكافية لمراقبة سمك الطبقة من خلال تصوير عيوب المواد في السيراميك أو البلاستيك بطريقة غير مدمرة. ونظرًا لخصائصها منخفضة الطاقة ، فإن إشعاع تيراهرتز غير ضار على الحيوانات والبشر. وعادةً ما تُدمج تقنية تيراهرتز مع الماسحات الضوئية بناءً على الطرق النشطة والسلبية. ففي الطريقة السلبية، يقتصر المسح على إشعاع تيراهرتز الطبيعي، الذي ينبعث عبر جسم الإنسان. وبالمثل، تدمج الطريقة النشطة مصدر إشعاع صناعي إضافي من خلال إشعاع تيراهرتز. وبالتالي، يستخدم النظام التناقض في الطول الموجي الناتج عن التشتت الخلفي لإعادة إنشاء صورة.
قم بتخصيص هذا التقرير ليناسب متطلباتك
ستحصل على تخصيص لأي تقرير - مجانًا - بما في ذلك أجزاء من هذا التقرير، أو تحليل على مستوى الدولة، وحزمة بيانات Excel، بالإضافة إلى الاستفادة من العروض والخصومات الرائعة للشركات الناشئة والجامعات
سوق تقنية تيراهرتز:
- احصل على أهم اتجاهات السوق الرئيسية لهذا التقرير.ستتضمن هذه العينة المجانية تحليل البيانات، بدءًا من اتجاهات السوق وحتى التقديرات والتوقعات.
محركات وفرص سوق تقنية تيراهرتز
تزايد الطلب على تقنية تيراهرتز من قطاعات الدفاع والأمن الداخلي والقطاع الطبي
مع التقدم التكنولوجي الهائل في مختلف الصناعات، يتزايد الطلب على تطبيق تقنية التيراهرتز (THz) في القطاعين العسكري والدفاعي، بالإضافة إلى القطاع الطبي والرعاية الصحية. ويعود تركيز الشركات المصنعة على تطوير مصادر التيراهرتز، ونقلها، أو انعكاسها، بالإضافة إلى تقنيات الكشف، إلى الاستكشاف المتزايد لـ"فجوة التيراهرتز" التي تقع بين الفوتونيات والإلكترونيات. وتُستخدم هذه التقنية باستمرار في تطبيقات مثل الكيمياء، والطب الحيوي، وعلوم المواد، والفحص الأمني، والاتصالات . وتُعد الخصائص الحصرية لإشعاع التيراهرتز مناسبة تمامًا للتطبيقات الطبية والرعاية الصحية، وخاصةً تلك التي يمكنها تحفيز الاهتزازات الجزيئية منخفضة التردد، والتي تشمل تفاعلات فان دير فالس أو غيرها من التفاعلات غير المرتبطة والروابط الهيدروجينية. ويُعد انتشار إشعاع التيراهرتز من الجزيئات الحيوية التي تنتج توقيعات اهتزازية طيفية على طول نطاق التيراهرتز سمة أساسية لتقنية التيراهرتز. ويوفر التصوير بالتيراهرتز مزايا حاسمة للكشف عن الأنسجة والتمييز بين الأنسجة المرضية والطبيعية. وهكذا، تتمتع تقنية التيراهرتز بتطبيقات واسعة في قطاعي الطب والرعاية الصحية. تعتمد نطاقات طيف التيراهرتز بشكل كبير على خصائص طرق توليد وكشف الموجات الطويلة، والأشعة تحت الحمراء على نطاق الموجات القصيرة. يقع نطاق تردد التيراهرتز على هامش العالم الإلكتروني، حيث يسهل توليد الموجات الميكروية، وكذلك الإشعاعات الراديوية، من العالم الفوتوني، ومن الأجهزة الإلكترونية، حيث تسهل تطبيقات التقنيات البصرية. إن المزايا الكامنة لظاهرة التيراهرتز، والتي تشمل جوانب، بما في ذلك التصوير بالتيراهرتز، والاستشعار، بالإضافة إلى دراسة خصائص المواد بمساعدة إشعاع التيراهرتز، تعزز تطبيقها في قطاع الدفاع والأمن. ويتزايد استخدام تقنية التيراهرتز في الماسحات الضوئية المحمولة، والتي تُستخدم بشكل رئيسي في المطارات والأماكن العامة الأخرى للفحص الأمني، وخاصةً لفحص الطرود في المطارات. علاوة على ذلك، يدفع تزايد الأنشطة الإرهابية عالميًا وتزايد الأنشطة الإجرامية الاستثمارات الحكومية في جميع أنحاء الدول لإنشاء بنية تحتية أمنية معززة.
تطبيقات معالجة تقنية التيراهيرتز في صناعة الأغذية
استخدام الإشعاع المؤين (أي الأشعة السينية) أمر بالغ الأهمية لمراقبة الجودة والاختبار غير المدمر بسبب تأثيره الضار على العوامل البيولوجية. وهنا تكمن فائدة تقنية التصوير بالتردد تيراهرتز، وهناك أمثلة على تطبيق التصوير بالتردد تيراهرتز في صناعة الأغذية. فبدلاً من استخدام أجهزة الأشعة السينية، يمكن لمصنعي الأغذية ومعبئيها استخدام ماسحات ضوئية للأغذية بالتردد تيراهرتز للتحقق، على سبيل المثال، مما إذا كان الذراع الآلي لالتقاط ووضع جميع ألواح الحلوى داخل الكرتون. لا تواجه أجهزة التصوير بالتردد تيراهرتز أي مشكلة في الرؤية من خلال عبوات الكرتون أو البولي إيثيلين. على سبيل المثال، يمكن تغليف ألواح الشوكولاتة بأي مادة، حتى الرقائق المعدنية التي تحتوي على معدن، والتي تكون مقاومة لأشعة التردد تيراهرتز. ستخلق الرقائق المعدنية في صور التردد تيراهرتز تباينًا أفضل. كما أن التقارير عن الحشرات والأجسام الغريبة الأخرى الموجودة في الطعام تشكل مصدر قلق بالغ للمستهلكين ومنتجي الأغذية وتجار التجزئة. قد يكشف فتح غلاف لوح الشوكولاتة عن مفاجأة غير سارة، بما في ذلك حشرة أو قطع من المعدن أو الزجاج أو كتل من الأوساخ؛ يمكن أن يؤدي هذا إلى إضعاف شهية المستهلك والتسبب في كسر أحد الأسنان أو التسمم. كما قد يتعرض المنتج أو بائع التجزئة في بلد ما لمقاضاة، مما يؤدي إلى غرامات ودعاوى قضائية بملايين الدولارات. وقد طور اللاعبون في السوق اختبارات مخصصة لصناعة الأغذية لإثبات القدرة على تحديد الأجسام الغريبة (مثل الحشرات أو قطع البلاستيك أو المعدن أو الحجارة أو التربة) داخل المنتجات الغذائية. على سبيل المثال، يمكن لأنظمة التصوير THz من مجموعة TeraSense اكتشاف ذبابة منزلية شائعة بسهولة عبر أكياس البولي إيثيلين المتعددة، حتى لو تجاوز السُمك الإجمالي لطبقة PET هذه 20 مم. تكشف أنظمة التصوير TeraSense عن فطريات الميكوتوكسين المسرطنة التي تلوث الفول السوداني والذرة والبندق ومحاصيل الحبوب الأخرى والنباتات الزيتية. يمكن للعملاء الصناعيين اكتشاف أي علامات للعدوى، بما في ذلك Aspergillus flavus وAspergillus parasiticus، التي تنضح بمادة Aflatoxins B1 المسرطنة الخطرة، بمساعدة أجهزة التصوير THz. ومن ثم، فمن المتوقع أن يوفر الاستخدام المتزايد لتكنولوجيا التيراهيرتز في صناعة الأغذية فرص نمو كبيرة للسوق خلال فترة التنبؤ.
تقرير تحليل تجزئة سوق تقنية تيراهرتز
القطاعات الرئيسية التي ساهمت في اشتقاق تحليل سوق تقنية التيراهيرتز هي المكون والنوع والتطبيق.
- بناءً على مكوناته، يُقسّم السوق إلى مصادر تيراهرتز وكواشف تيراهرتز. وقد هيمن قطاع كواشف تيراهرتز على السوق في عام ٢٠٢٤.
- يُقسّم السوق، حسب نوعه، إلى أنظمة تصوير تيراهرتز، وأنظمة مطيافية تيراهرتز، وأنظمة اتصالات تيراهرتز. وسيُهيمن قطاع أنظمة تصوير تيراهرتز على السوق بحلول عام ٢٠٢٤.
- من حيث التطبيق، يُقسّم سوق تقنية تيراهرتز إلى قطاعات الطب والرعاية الصحية، والدفاع والأمن، والأغذية والزراعة، والصناعة، وغيرها. وسيُهيمن القطاع الصناعي على السوق بحلول عام ٢٠٢٤.
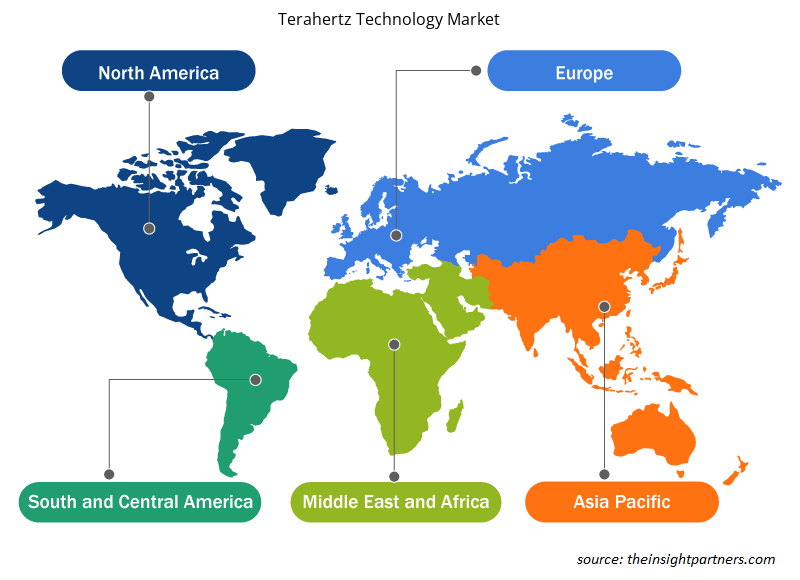
تحليل حصة سوق تقنية تيراهرتز حسب المنطقة الجغرافية
- يُقسّم سوق تقنية التيراهرتز إلى خمس مناطق رئيسية: أمريكا الشمالية، وأوروبا، وآسيا والمحيط الهادئ، والشرق الأوسط وأفريقيا، وأمريكا الجنوبية والوسطى. وقد هيمنت أمريكا الشمالية على السوق في عام ٢٠٢٣، تلتها أوروبا وآسيا والمحيط الهادئ.
- تشمل أمريكا الشمالية اقتصادات متقدمة مثل الولايات المتحدة الأمريكية وكندا والمكسيك. تشهد المنطقة تطورات تكنولوجية في دول قوية اقتصاديًا. تعمل الشركات على تحسين عملياتها التجارية لتلبية طلب عملائها على منتجات وخدمات عالية الجودة. يُعد الطلب على هذه التقنية الأكبر في المنطقة نظرًا لكون تقنية التيراهيرتز تقنية جديدة، وكون أمريكا الشمالية من أوائل الدول التي تبنتها. يُسهم تزايد إنتاج المروحيات والطائرات التجارية في الولايات المتحدة في تعزيز اعتماد تقنية التيراهيرتز في المنطقة. تُصدر صناعة الطيران والفضاء الأمريكية الضخمة أكثر من 60% من إجمالي تصنيعها. كما تُساهم معاهد الأبحاث في المنطقة، مثل مختبر الدفع النفاث، في تبني هذه التقنية من خلال تطبيقها.
رؤى إقليمية حول سوق تقنية تيراهرتز
قام محللو إنسايت بارتنرز بشرح شامل للاتجاهات الإقليمية والعوامل المؤثرة في سوق تقنية تيراهرتز خلال فترة التوقعات. ويناقش هذا القسم أيضًا قطاعات سوق تقنية تيراهرتز ونطاقه الجغرافي في أمريكا الشمالية، وأوروبا، وآسيا والمحيط الهادئ، والشرق الأوسط وأفريقيا، وأمريكا الجنوبية والوسطى.
- احصل على البيانات الإقليمية المحددة لسوق تقنية التيراهيرتز
نطاق تقرير سوق تقنية تيراهرتز
| سمة التقرير | تفاصيل |
|---|---|
| حجم السوق في عام 2024 | 736.01 مليون دولار أمريكي |
| حجم السوق بحلول عام 2031 | 2500.55 مليون دولار أمريكي |
| معدل النمو السنوي المركب العالمي (2025 - 2031) | 19.2% |
| البيانات التاريخية | 2021-2023 |
| فترة التنبؤ | 2025-2031 |
| القطاعات المغطاة | حسب المكون
|
| المناطق والدول المغطاة | أمريكا الشمالية
|
| قادة السوق وملفات تعريف الشركات الرئيسية |
|
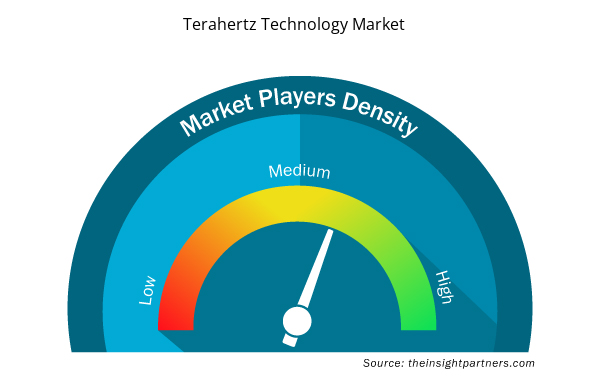
كثافة اللاعبين في سوق تقنية تيراهرتز: فهم تأثيرها على ديناميكيات الأعمال
يشهد سوق تقنية تيراهرتز نموًا سريعًا، مدفوعًا بتزايد طلب المستخدم النهائي نتيجةً لعوامل مثل تطور تفضيلات المستهلكين، والتقدم التكنولوجي، وزيادة الوعي بمزايا المنتج. ومع تزايد الطلب، تعمل الشركات على توسيع عروضها، والابتكار لتلبية احتياجات المستهلكين، والاستفادة من الاتجاهات الناشئة، مما يعزز نمو السوق.
تشير كثافة اللاعبين في السوق إلى توزيع الشركات العاملة في سوق أو قطاع معين. وتشير إلى عدد المنافسين (اللاعبين في السوق) الموجودين في سوق معين نسبةً إلى حجمه أو قيمته السوقية الإجمالية.
الشركات الرئيسية العاملة في سوق تقنية التيراهيرتز هي:
- شركة إن تي تي للكهرباء
- شركة فوتونيكس المتقدمة
- شركة أدفانتست
- شركة هوبنر المحدودة وشركاه
- شركة لونا للابتكارات
- شركة مينلو سيستمز المحدودة
إخلاء المسؤولية : الشركات المذكورة أعلاه ليست مرتبة بأي ترتيب معين.
- احصل على نظرة عامة على أهم اللاعبين الرئيسيين في سوق تقنية تيراهرتز
أخبار سوق تكنولوجيا تيراهرتز والتطورات الأخيرة
يُقيّم سوق تقنية التيراهرتز بجمع بيانات نوعية وكمية بعد البحث الأولي والثانوي، والتي تشمل منشورات الشركات المهمة، وبيانات الجمعيات، وقواعد البيانات. فيما يلي أهم التطورات في سوق تقنية التيراهرتز:
- أعلنت شركة أدفانتست عن إبرامها اتفاقية شراكة مع شركة ميكرونيكس اليابان المحدودة ("MJC"). ونظرًا للتطور والتعقيد المتزايدين في أشباه الموصلات، يُعدّ التعاون الوثيق ضمن سلسلة توريد أشباه الموصلات أمرًا بالغ الأهمية لتلبية متطلبات السوق المستقبلية. وبموجب هذه الاتفاقية، ستستفيد كلٌّ من MJC وأدفانست من خبراتهما لتقديم حلول مبتكرة لاختبار أشباه الموصلات، مما يُسهم في تحسين عمليات الاختبار لدى العملاء وتكاليفها. كما تخطط أدفانست للاستحواذ على حصة أقلية في MJC كجزء من هذه الاتفاقية.
(المصدر: شركة أدفانتست، بيان صحفي، فبراير 2025)
- أعلنت شركة لونا إنوفيشنز إنكوربوريتد عن طلب شراء جديد لحلول استشعار التيراهيرتز، المصممة خصيصًا للاستخدام في إنتاج بطاريات السيارات الكهربائية. ولتلبية الطلب على هذه الحلول، أكملت لونا أيضًا نقل إنتاج حلول التيراهيرتز إلى منشأتها في أتلانتا، جورجيا، حيث تتوقع زيادة طاقتها الإنتاجية أربعة أضعاف.
(المصدر: شركة لونا للابتكارات، بيان صحفي، أغسطس 2023)
تغطية تقرير سوق تقنية تيراهرتز والنتائج المتوقعة
يوفر تقرير "حجم سوق تقنية تيراهرتز والتوقعات (2021-2031)" تحليلاً مفصلاً للسوق يغطي المجالات المذكورة أدناه:
- حجم سوق تقنية تيراهرتز وتوقعاته على المستويات العالمية والإقليمية والوطنية لجميع قطاعات السوق الرئيسية التي يغطيها النطاق
- اتجاهات سوق تقنية تيراهرتز، بالإضافة إلى ديناميكيات السوق مثل المحركات والقيود والفرص الرئيسية
- تحليل مفصل لـ PEST و SWOT
- تحليل سوق تقنية تيراهرتز يغطي اتجاهات السوق الرئيسية والإطار العالمي والإقليمي والجهات الفاعلة الرئيسية واللوائح والتطورات الأخيرة في السوق
- تحليل المشهد الصناعي والمنافسة الذي يغطي تركيز السوق، وتحليل خريطة الحرارة، واللاعبين البارزين، والتطورات الأخيرة في سوق تقنية التيراهيرتز
- ملفات تعريف الشركة التفصيلية
- التحليل التاريخي (سنتان)، السنة الأساسية، التوقعات (7 سنوات) مع معدل النمو السنوي المركب
- تحليل PEST و SWOT
- حجم السوق والقيمة / الحجم - عالميًا وإقليميًا وقطريًا
- الصناعة والمنافسة
- مجموعة بيانات Excel


Report Coverage
Revenue forecast, Company Analysis, Industry landscape, Growth factors, and Trends

Segment Covered
This text is related
to segments covered.

Regional Scope
North America, Europe, Asia Pacific, Middle East & Africa, South & Central America

Country Scope
This text is related
to country scope.
الأسئلة الشائعة
Rising demand for terahertz technology from the defense, homeland security, and medical sectors, growing use of terahertz systems in the semiconductor industry, and technological advancements are driving the market growth.
The use of terahertz technology for satellite communication and the integration of artificial intelligence in terahertz systems is a key trend in the market.
TeraSense Group, ADVANTEST CORPORATION, Menlo Systems, TOPTICA Photonics AG, and Luna Innovations Incorporated are major players in the market.
The market is expected to reach a value of US$ 2.5 billion by 2031.
North America is anticipated to dominate the terahertz technology market in 2024.
The market is anticipated to expand at a CAGR of 19.2% during 2025-2031.
The List of Companies - Terahertz Technology Market
- NTT Electric Co.
- Advanced Photonix Inc.
- Advantest Corporation
- HÜBNER GmbH & Co. KG
- Luna Innovations Inc.
- Menlo Systems GmbH
- Microtech Instrument Inc.
- Terasense Group Inc.
- Teraview Limited
- Toptica Photonics AG
The Insight Partners performs research in 4 major stages: Data Collection & Secondary Research, Primary Research, Data Analysis and Data Triangulation & Final Review.
- Data Collection and Secondary Research:
As a market research and consulting firm operating from a decade, we have published and advised several client across the globe. First step for any study will start with an assessment of currently available data and insights from existing reports. Further, historical and current market information is collected from Investor Presentations, Annual Reports, SEC Filings, etc., and other information related to company’s performance and market positioning are gathered from Paid Databases (Factiva, Hoovers, and Reuters) and various other publications available in public domain.
Several associations trade associates, technical forums, institutes, societies and organization are accessed to gain technical as well as market related insights through their publications such as research papers, blogs and press releases related to the studies are referred to get cues about the market. Further, white papers, journals, magazines, and other news articles published in last 3 years are scrutinized and analyzed to understand the current market trends.
- Primary Research:
The primarily interview analysis comprise of data obtained from industry participants interview and answers to survey questions gathered by in-house primary team.
For primary research, interviews are conducted with industry experts/CEOs/Marketing Managers/VPs/Subject Matter Experts from both demand and supply side to get a 360-degree view of the market. The primary team conducts several interviews based on the complexity of the markets to understand the various market trends and dynamics which makes research more credible and precise.
A typical research interview fulfils the following functions:
- Provides first-hand information on the market size, market trends, growth trends, competitive landscape, and outlook
- Validates and strengthens in-house secondary research findings
- Develops the analysis team’s expertise and market understanding
Primary research involves email interactions and telephone interviews for each market, category, segment, and sub-segment across geographies. The participants who typically take part in such a process include, but are not limited to:
- Industry participants: VPs, business development managers, market intelligence managers and national sales managers
- Outside experts: Valuation experts, research analysts and key opinion leaders specializing in the electronics and semiconductor industry.
Below is the breakup of our primary respondents by company, designation, and region:

Once we receive the confirmation from primary research sources or primary respondents, we finalize the base year market estimation and forecast the data as per the macroeconomic and microeconomic factors assessed during data collection.
- Data Analysis:
Once data is validated through both secondary as well as primary respondents, we finalize the market estimations by hypothesis formulation and factor analysis at regional and country level.
- Macro-Economic Factor Analysis:
We analyse macroeconomic indicators such the gross domestic product (GDP), increase in the demand for goods and services across industries, technological advancement, regional economic growth, governmental policies, the influence of COVID-19, PEST analysis, and other aspects. This analysis aids in setting benchmarks for various nations/regions and approximating market splits. Additionally, the general trend of the aforementioned components aid in determining the market's development possibilities.
- Country Level Data:
Various factors that are especially aligned to the country are taken into account to determine the market size for a certain area and country, including the presence of vendors, such as headquarters and offices, the country's GDP, demand patterns, and industry growth. To comprehend the market dynamics for the nation, a number of growth variables, inhibitors, application areas, and current market trends are researched. The aforementioned elements aid in determining the country's overall market's growth potential.
- Company Profile:
The “Table of Contents” is formulated by listing and analyzing more than 25 - 30 companies operating in the market ecosystem across geographies. However, we profile only 10 companies as a standard practice in our syndicate reports. These 10 companies comprise leading, emerging, and regional players. Nonetheless, our analysis is not restricted to the 10 listed companies, we also analyze other companies present in the market to develop a holistic view and understand the prevailing trends. The “Company Profiles” section in the report covers key facts, business description, products & services, financial information, SWOT analysis, and key developments. The financial information presented is extracted from the annual reports and official documents of the publicly listed companies. Upon collecting the information for the sections of respective companies, we verify them via various primary sources and then compile the data in respective company profiles. The company level information helps us in deriving the base number as well as in forecasting the market size.
- Developing Base Number:
Aggregation of sales statistics (2020-2022) and macro-economic factor, and other secondary and primary research insights are utilized to arrive at base number and related market shares for 2022. The data gaps are identified in this step and relevant market data is analyzed, collected from paid primary interviews or databases. On finalizing the base year market size, forecasts are developed on the basis of macro-economic, industry and market growth factors and company level analysis.
- Data Triangulation and Final Review:
The market findings and base year market size calculations are validated from supply as well as demand side. Demand side validations are based on macro-economic factor analysis and benchmarks for respective regions and countries. In case of supply side validations, revenues of major companies are estimated (in case not available) based on industry benchmark, approximate number of employees, product portfolio, and primary interviews revenues are gathered. Further revenue from target product/service segment is assessed to avoid overshooting of market statistics. In case of heavy deviations between supply and demand side values, all thes steps are repeated to achieve synchronization.
We follow an iterative model, wherein we share our research findings with Subject Matter Experts (SME’s) and Key Opinion Leaders (KOLs) until consensus view of the market is not formulated – this model negates any drastic deviation in the opinions of experts. Only validated and universally acceptable research findings are quoted in our reports.
We have important check points that we use to validate our research findings – which we call – data triangulation, where we validate the information, we generate from secondary sources with primary interviews and then we re-validate with our internal data bases and Subject matter experts. This comprehensive model enables us to deliver high quality, reliable data in shortest possible time.
 احصل على عينة مجانية لهذا التقرير