استراتيجيات سوق الرافعات الجسرية ذات الإطارات المطاطية، وأفضل اللاعبين، وفرص النمو، والتحليل والتنبؤ بحلول عام 2027
البيانات التاريخية : 2017-2018 | سنة الأساس : 2019 | فترة التنبؤ : 2020-2027توقعات سوق الرافعات الجسرية ذات الإطارات المطاطية حتى عام ٢٠٢٧ - تأثير جائحة كوفيد-١٩ والتحليل العالمي حسب النوع (٨ عجلات و١٦ عجلة)، ومصدر الطاقة (ديزل، وكهرباء، وهجين)
- تاريخ التقرير : Jun 2020
- رمز التقرير : TIPRE00011041
- الفئة : السيارات والنقل
- الحالة : نُشرت
- تنسيقات التقارير المتاحة :


- عدد الصفحات : 145
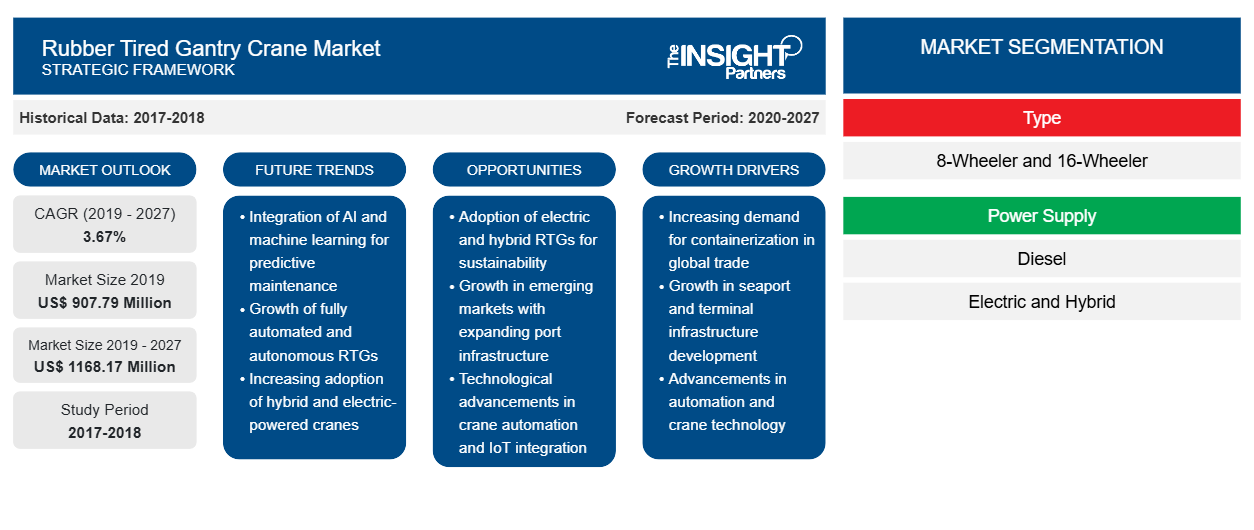
بلغت قيمة سوق الرافعات الجسرية ذات الإطارات المطاطية 907.79 مليون دولار أمريكي في عام 2019 ومن المتوقع أن تصل إلى 1168.17 مليون دولار أمريكي بحلول عام 2027؛ ومن المتوقع أن تنمو بمعدل نمو سنوي مركب قدره 3.67٪ من عام 2020 إلى عام 2027.
في الماضي، كانت الدول النامية هي موردي المواد الخام؛ ومع ذلك، أعطى تخطيط التجارة دورًا جديدًا للدول النامية في جميع أنحاء العالم، ونتيجة لذلك من المتوقع أن تشهد سوق الرافعات الجسرية ذات الإطارات المطاطية معدل نمو كبير خلال فترة التوقعات. ويعزى نمو السوق بشكل أساسي إلى ارتفاع الطلب على التجارة البحرية، حيث أصبحت الدول النامية، بما في ذلك الصين، الآن مستوردين ومصدرين مهمين للسلع عن طريق البحر، حيث تعد آسيا أكبر منطقة تجارية.
بالإضافة إلى ذلك، فإن سوق الرافعات الجسرية ذات الإطارات المطاطية مدفوع بمبادرات حكومية مواتية لتطوير الموانئ. يصبح الميناء عجلة الاقتصاد إذا كان يعمل بكفاءة. في الوقت الحاضر، لم يعد الغرض من الميناء محدودًا فحسب، بل امتد إلى منصة لوجستية. تعد إنتاجية الميناء مهمة في التجارة الدولية حيث أن الميناء البحري هو عصب التجارة الخارجية للبلد. يتم اتخاذ العديد من السياسات الحكومية، والتي بدورها ستدفع سوق الرافعات الجسرية ذات الإطارات المطاطية العالمية خلال فترة التنبؤ.
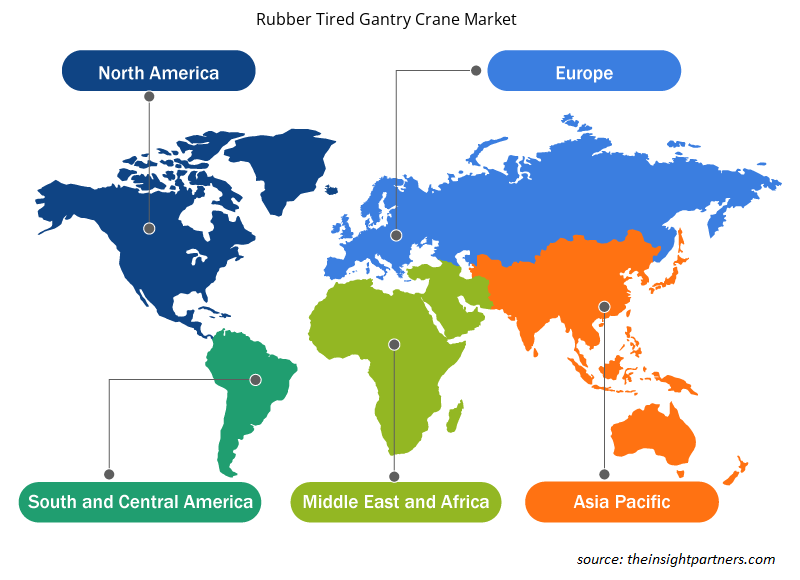
تصدرت أوروبا سوق الرافعات الجسرية ذات الإطارات المطاطية في عام 2019 ومن المتوقع أن تستمر في هيمنتها خلال فترة التوقعات. اعتمدت موانئ أوروبا مولدات الطاقة الكهربائية ذات الإطارات المطاطية لتقليل التلوث وانبعاثات الغازات المسببة للانحباس الحراري العالمي. مكنت اللوائح الحكومية في هذه المنطقة من اعتماد معدات مناولة الحاويات الكهربائية، مثل التحقق من انبعاثات الكربون في النقل البحري. تمثل أوروبا حجمًا كبيرًا من التجارة في المنتجات والأصول، مثل الآلات والمركبات والطائرات والوقود والمعادن غير الحديدية والمنسوجات والمواد الكيميائية والملابس والنفط الخام. تحتل أوروبا المرتبة الأولى في التجارة مما يجعل المنطقة رائدة في السوق العالمية للرافعات الجسرية ذات الإطارات المطاطية.
قم بتخصيص هذا التقرير ليناسب متطلباتك
ستحصل على تخصيص لأي تقرير - مجانًا - بما في ذلك أجزاء من هذا التقرير، أو تحليل على مستوى الدولة، وحزمة بيانات Excel، بالإضافة إلى الاستفادة من العروض والخصومات الرائعة للشركات الناشئة والجامعات
سوق الرافعات الجسرية ذات الإطارات المطاطية: رؤى استراتيجية
- احصل على أهم اتجاهات السوق الرئيسية لهذا التقرير.ستتضمن هذه العينة المجانية تحليلاً للبيانات، بدءًا من اتجاهات السوق وحتى التقديرات والتوقعات.
تأثير جائحة كوفيد-19 على سوق الرافعات الجسرية ذات الإطارات المطاطية
تؤثر أزمة كوفيد-19 على الصناعات في جميع أنحاء العالم ومن المتوقع أن يتضرر الاقتصاد العالمي بشدة في عام 2020 وكذلك في عام 2021. تسبب تفشي المرض في حدوث اضطرابات كبيرة في الصناعات الأولية مثل الإلكترونيات الاستهلاكية وأشباه الموصلات والسيارات والبنية التحتية لتكنولوجيا المعلومات. كل هذه الصناعات ضرورية لنمو سوق الرافعات الجسرية ذات الإطارات المطاطية العالمية لأنها الصناعات الرئيسية لتوليد الطلب على الرافعات الجسرية ذات الإطارات المطاطية. أثرت عمليات إغلاق المصانع وحظر السفر وحظر التجارة وإغلاق الحدود على كل من تصنيع ومبيعات مختلف المنتجات والمكونات الإلكترونية الاستهلاكية. تعد صناعة الإلكترونيات وأشباه الموصلات العالمية واحدة من الصناعات الرئيسية التي تواجه اضطرابات خطيرة بسبب مشاكل سلسلة التوريد وإغلاق التصنيع.
رؤى السوق
التركيز المتزايد على التكنولوجيا الخضراء
يركز المشاركون في السوق على التكنولوجيا الخضراء بسبب اللوائح الحكومية الصارمة المتعلقة بحدود التلوث والانبعاثات في مختلف المناطق. كما يمكن تحسين استخدام RTGs المجهزة بمحركات كهربائية لاستهلاك طاقة أقل. سيركز استخدام تقنية البطارية الهجينة على الرافعات على تقليل استهلاك الوقود وانبعاثات الوقود الأحفوري الضارة بشكل كبير. حوالي 10٪ من انبعاثات وقود الديزل من معدات مناولة البضائع في الموانئ تنبعث من رافعات RTG؛ يؤدي تنفيذ RTGs الأكثر كفاءة إلى تقليل التأثير البيئي لعمليات الرافعات بشكل مباشر. هذه التكنولوجيا هي إجابة لمشغلي الموانئ المشغولين في جميع أنحاء العالم الذين يحتاجون إلى زيادة الكفاءة مع تقليل الانبعاثات والتأثير البيئي لعملياتهم، فضلاً عن توفير فوائد إضافية لخفض تكاليف التشغيل مع انخفاض انبعاثات الغازات المسببة للانحباس الحراري ومستويات الضوضاء المنخفضة في المحطة. تقنية تخزين طاقة دولاب الموازنة لرافعات الجسر ذات الإطارات المطاطية أو RTG التي يمكن إما إعادة تركيبها على رافعات RTG الحالية أو تضمينها كجزء من بناء جديد. توفر عجلات الموازنة تخفيضات في الوقود والانبعاثات من خلال التقاط طاقة الكبح المنتجة عند إنزال الحاوية.
رؤى السوق القائمة على النوع
بناءً على النوع، يمكن تقسيم السوق العالمية للرافعات الجسرية ذات الإطارات المطاطية إلى فئتين: رافعات ذات 8 عجلات ورافعات ذات 16 عجلة. يوجد نوعان لكل طراز 8W و8WA للرافعات ذات 8 عجلات، و16W و16WA للرافعات ذات 16 عجلة. تتمثل الاختلافات الرئيسية بين الطرازين في تصميم نظام منع الاهتزاز وعدد عجلات الرافعات الجسرية. تتطلب رافعات RTG ذات 16 إطارًا مساحة سفر أكبر. وبالتالي، لا يمكن استخدامها في المساحات الصغيرة. تُفضل رافعات RTG ذات 8 إطارات للمساحات الأصغر.
رؤى السوق القائمة على إمدادات الطاقة
بناءً على مصدر الطاقة، يمكن تصنيف السوق العالمية لرافعات الجسر ذات الإطارات المطاطية إلى ثلاث فئات: الديزل والكهربائية والهجينة. من المرجح أن يؤدي تطبيق معايير الانبعاثات الصارمة لتقليل الانبعاثات العالمية وتطوير المركبات الكهربائية الأكثر كفاءة، فضلاً عن ارتفاع أسعار الوقود، إلى تعزيز الطلب على رافعات RTG الكهربائية والهجينة في جميع أنحاء العالم. توفر رافعات RTG الكهربائية أداءً أفضل ويمكنها نقل أحمال كبيرة. وبسبب هذا، من المتوقع أن يزداد تفضيل الرافعات الجسرية ذات الإطارات المطاطية الكهربائية والهجينة قريبًا.
يعد تطوير المنتجات من بين الاستراتيجيات الأكثر شيوعًا التي تتبناها الشركات لتوسيع محفظة منتجاتها. تعد شركة Anupam Industries Limited، وElectromech Material Handling Systems (India) Pvt. ltd، وKonecranes، وLiebherr، وKalmar من بين اللاعبين الرئيسيين الذين ينفذون استراتيجيات لتوسيع قاعدة العملاء والحصول على حصة كبيرة في سوق الرافعات الجسرية ذات الإطارات المطاطية، مما يسمح لهم بدوره بالحفاظ على اسم علامتهم التجارية في السوق العالمية.
رؤى إقليمية حول سوق الرافعات الجسرية ذات الإطارات المطاطية
لقد قام المحللون في Insight Partners بشرح الاتجاهات والعوامل الإقليمية المؤثرة على سوق الرافعات الجسرية ذات الإطارات المطاطية طوال فترة التوقعات بشكل شامل. يناقش هذا القسم أيضًا قطاعات سوق الرافعات الجسرية ذات الإطارات المطاطية والجغرافيا في جميع أنحاء أمريكا الشمالية وأوروبا ومنطقة آسيا والمحيط الهادئ والشرق الأوسط وأفريقيا وأمريكا الجنوبية والوسطى.
- احصل على البيانات الإقليمية المحددة لسوق الرافعات الجسرية ذات الإطارات المطاطية
نطاق تقرير سوق الرافعات الجسرية ذات الإطارات المطاطية
| سمة التقرير | تفاصيل |
|---|---|
| حجم السوق في عام 2019 | 907.79 مليون دولار أمريكي |
| حجم السوق بحلول عام 2027 | 1168.17 مليون دولار أمريكي |
| معدل النمو السنوي المركب العالمي (2019 - 2027) | 3.67% |
| البيانات التاريخية | 2017-2018 |
| فترة التنبؤ | 2020-2027 |
| القطاعات المغطاة | حسب النوع
|
| المناطق والدول المغطاة | أمريكا الشمالية
|
| قادة السوق وملفات تعريف الشركات الرئيسية |
|
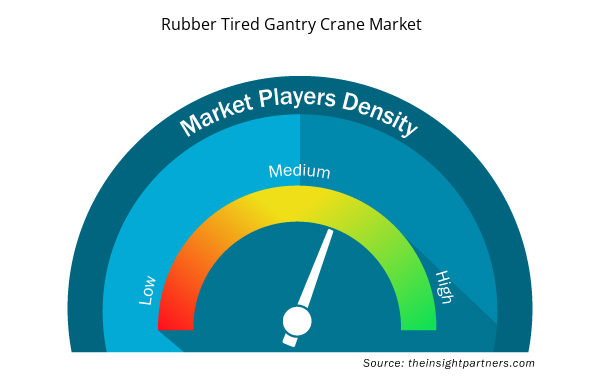
كثافة اللاعبين في السوق: فهم تأثيرها على ديناميكيات الأعمال
يشهد سوق الرافعات الجسرية ذات الإطارات المطاطية نموًا سريعًا، مدفوعًا بالطلب المتزايد من المستخدم النهائي بسبب عوامل مثل تفضيلات المستهلك المتطورة والتقدم التكنولوجي والوعي المتزايد بفوائد المنتج. ومع ارتفاع الطلب، تعمل الشركات على توسيع عروضها والابتكار لتلبية احتياجات المستهلكين والاستفادة من الاتجاهات الناشئة، مما يؤدي إلى زيادة نمو السوق.
تشير كثافة اللاعبين في السوق إلى توزيع الشركات أو المؤسسات العاملة في سوق أو صناعة معينة. وهي تشير إلى عدد المنافسين (اللاعبين في السوق) الموجودين في مساحة سوق معينة نسبة إلى حجمها أو قيمتها السوقية الإجمالية.
الشركات الرئيسية العاملة في سوق الرافعات الجسرية ذات الإطارات المطاطية هي:
- شركة أنوبام للصناعات المحدودة
- شركة إلكتروميكانيك لأنظمة مناولة المواد (الهند) المحدودة
- كالمار
- رافعات كونيكراينز
- ليبهر
إخلاء المسؤولية : الشركات المذكورة أعلاه ليست مرتبة بأي ترتيب معين.
- احصل على نظرة عامة على أهم اللاعبين الرئيسيين في سوق الرافعات الجسرية ذات الإطارات المطاطية
تقسيم سوق الرافعات الجسرية ذات الإطارات المطاطية:
حسب النوع
- مركبة ذات 8 عجلات
- شاحنة ذات 16 عجلة
حسب مصدر الطاقة
- ديزل
- كهربائي
- هجين
ملفات تعريف الشركة
- شركة أنوبام للصناعات المحدودة
- شركة إلكتروميكانيك لأنظمة مناولة المواد (الهند) المحدودة
- كالمار
- رافعات كونيكراينز
- ليبهر
- منتجات مي جاك.
- شركة ريفا للصناعات المحدودة
- شركة شنغهاي تشن هوا للصناعات الثقيلة المحدودة (ZPMC)
- رافعة وتجهيز TNT
- مجموعة ساني

نافين خبيرٌ متمرسٌ في أبحاث السوق والاستشارات، يتمتع بخبرةٍ تزيد عن 9 سنوات في مشاريع مُخصصة ومُشتركة واستشارية. يشغل حاليًا منصب نائب الرئيس المساعد، وقد نجح في إدارة أصحاب المصلحة عبر سلسلة قيمة المشاريع، وألّف أكثر من 100 تقرير بحثي وأكثر من 30 مهمة استشارية. يمتد نطاق عمله ليشمل مشاريع صناعية وحكومية، مساهمًا بشكل كبير في نجاح العملاء واتخاذ القرارات القائمة على البيانات.
نافين حاصلٌ على شهادة في هندسة الإلكترونيات والاتصالات من جامعة فرجينيا التقنية، كارناتاكا، وشهادة ماجستير في إدارة الأعمال في التسويق والعمليات من جامعة مانيبال. وهو عضوٌ نشطٌ في معهد مهندسي الكهرباء والإلكترونيات (IEEE) لمدة 9 سنوات، حيث شارك في مؤتمراتٍ وندواتٍ تقنية، وتطوّع على مستوى الأقسام والمناطق. قبل منصبه الحالي، عمل مستشارًا استراتيجيًا مساعدًا في IndustryARC، ومستشارًا للخوادم الصناعية في شركة هيوليت باكارد (HP Global).
- التحليل التاريخي (سنتان)، سنة الأساس، التوقعات (7 سنوات) مع معدل النمو السنوي المركب
- تحليل PEST و SWOT
- حجم السوق والقيمة / الحجم - عالمي، إقليمي، بلد
- الصناعة والمنافسة
- مجموعة بيانات إكسل
التقارير الحديثة
شهادات العملاء
تقرير سوق أنظمة SCADA من Insight Partners شامل، ويقدم رؤى قيّمة حول الاتجاهات الحالية والتوقعات المستقبلية. تميّز الفريق باحترافية عالية وسرعة في الاستجابة ودعم مستمر طوال الوقت. نحن راضون جدًا ونوصي بشدة بخدماتهم.
ران كيديم شريك, شركة ريالي تكنولوجيز المحدودةطلبتُ تقريرًا عن سوق برمجيات محدد، وأعدّه الفريق في غضون أيام قليلة. كانت المعلومات ذات صلة وثيقة وعرضها جيد. ثم طلبتُ بعض التعديلات والإضافات على التقرير. وكان الفريق متجاوبًا للغاية، وحصلتُ على التقرير النهائي في أقل من أسبوع.
جان هيرفيه جين رئيس مجلس الإدارة, فيوتشر أناليتيكاعملنا مع شركة "إنسايت بارتنرز" لإجراء دراسة سوقية وتوقعات مهمة. زودونا برؤى واضحة حول الفرص والمخاطر، مما ساعدنا في صياغة خططنا. كانت أبحاثهم سهلة الاستخدام ومبنية على بيانات دقيقة، مما ساعدنا على اتخاذ قرارات ذكية وواثقة. نوصي بهم بشدة.
بيوش ناجبال نائب الرئيس الأول, شعاع عالي عالميقدّمت شركة Insight Partners أبحاثًا سوقية ثاقبة ومنظمة جيدًا بخبرة واسعة في هذا المجال. تميّز فريقهم بالاحترافية وسرعة الاستجابة طوال الوقت. وسهّل موقعهم الإلكتروني سهل الاستخدام الوصول إلى تقارير القطاع. نوصي بهم بشدة لخدمات بحثية موثوقة وعالية الجودة.
يوكيهيكو أداتشي المدير التنفيذي, ديب بلو، ذ.م.م.هذه أول مرة أشتري فيها تقرير سوق من The Insight Partners. رغم أنني كنت مترددًا في البداية، إلا أنني زرت موقعهم الإلكتروني وشعرت براحة أكبر للمخاطرة وشراء تقرير السوق. أنا راضٍ تمامًا عن جودة التقرير وخدمة العملاء. كانت لديّ عدة أسئلة وتعليقات حول التقرير الأولي، ولكن بعد بضع محادثات عبر البريد الإلكتروني مع محللهم، أعتقد أن لديّ تقريرًا يمكنني استخدامه كمدخل لعملية التخطيط الاستراتيجي لدينا. شكرًا جزيلاً لكم على تخصيص وقتكم الإضافي وجعل هذه التجربة إيجابية. سأوصي بخدماتكم للآخرين بالتأكيد، وستكونون أول من ألجأ إليه عندما نحتاج إلى المزيد من بيانات السوق.
جون سوزوكي الرئيس والرئيس التنفيذي وعضو مجلس الإدارة, بي كيه تكنولوجيزأود أن أقدّر دعمكم واحترافيتكم في الاستجابة لطلبي للحصول على معلومات بشأن سوق التشخيص المخبري للأمراض المعدية في نيجيريا. كما أُقدّر صبركم وتوجيهكم، واستعدادكم لتقديم خصم، مما مكّننا في النهاية من إتمام الصفقة. أتطلع إلى التعامل مع "ذا إنسايت بارتنرز" مستقبلًا، كل ذلك بفضل الانطباع الذي تركتموه لديّ نتيجةً لهذا اللقاء الأول.
الدكتور تشيجيوك أونيا المدير الإداري, شركة باينكريست للرعاية الصحية المحدودةسبب الشراء
- اتخاذ قرارات مدروسة
- فهم ديناميكيات السوق
- تحليل المنافسة
- رؤى العملاء
- توقعات السوق
- تخفيف المخاطر
- التخطيط الاستراتيجي
- مبررات الاستثمار
- تحديد الأسواق الناشئة
- تحسين استراتيجيات التسويق
- تعزيز الكفاءة التشغيلية
- مواكبة التوجهات التنظيمية


 احصل على عينة مجانية ل - سوق الرافعات الجسرية ذات الإطارات المطاطية