تحليل سوق التلك والتنبؤ به حسب الحجم والمشاركة والنمو والاتجاهات 2030
البيانات التاريخية : 2020-2021 | سنة الأساس : 2022 | فترة التنبؤ : 2023-2030حجم سوق التلك وتوقعاته (2020-2030)، والحصة العالمية والإقليمية، والاتجاهات، وفرص النمو. يغطي التقرير تحليلًا لنوع الرواسب (كلوريت التلك وكربونات التلك) والقطاعات المستخدمة (البلاستيك، واللب والورق، والسيراميك، والدهانات، والمطاط، والأدوية، والأغذية، وغيرها).
- تاريخ التقرير : Nov 2023
- رمز التقرير : TIPRE00008714
- الفئة : المواد الكيميائية والمواد
- الحالة : نُشرت
- تنسيقات التقارير المتاحة :


- عدد الصفحات : 167
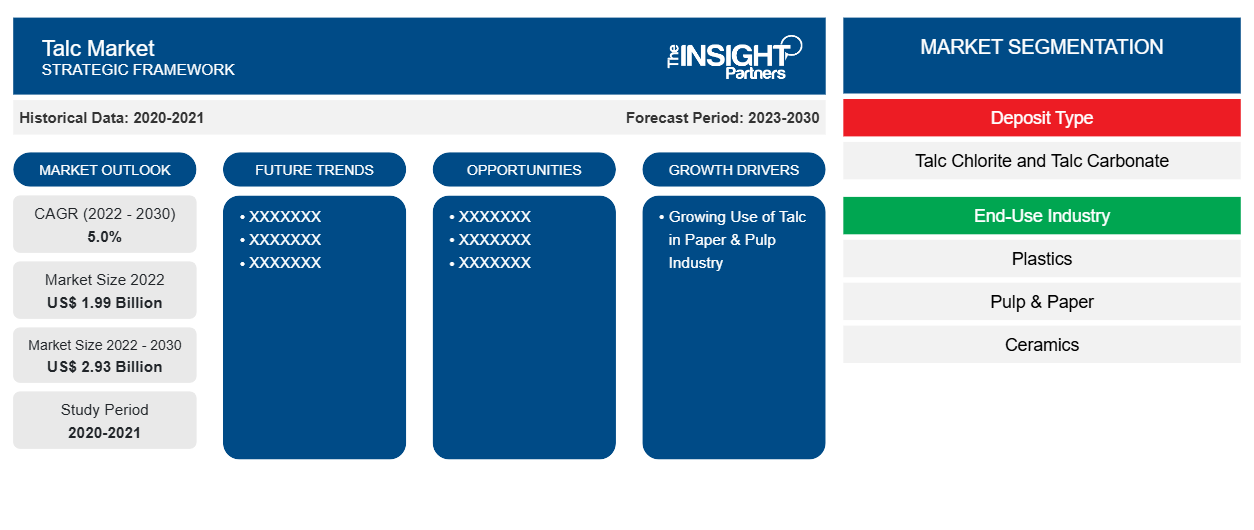
[تقرير بحثي] من المتوقع أن ينمو حجم سوق التلك من 1،987.43 مليون دولار أمريكي في عام 2022 إلى 2،932.29 مليون دولار أمريكي بحلول عام 2030؛ ومن المتوقع أن يسجل معدل نمو سنوي مركب بنسبة 5.0٪ من عام 2022 إلى عام 2030.
رؤى السوق ووجهة نظر المحلل:
التلك هو سيليكات المغنيسيوم المائية. تتشكل رواسب التلك من تحويل الصخور ذات المحتوى العالي من المغنيسيوم بواسطة السوائل الحرارية المائية السليكية. ينشأ معظم التلك من تغيير الدولوميت أو الصخور المتطفلة فوق المافية. يوجد دائمًا في تركيبة مع معادن أخرى، بشكل عام الكربونات والكلوريت. كل رواسب التلك لها مورفولوجيا ومعادن فريدة من نوعها، ولكن جميع أنواع التلك تظهر الخصائص الفريدة التالية - النعومة، وطرد الماء، والخمول الكيميائي، والبلاتينية، والتقارب للمواد العضوية. تجعل هذه الخصائص التلك مناسبًا كحشو متعدد الوظائف وممكّن للعمليات في مجموعة واسعة من التطبيقات من البلاستيك إلى الورق والسيراميك إلى الطلاء. يستخدم التلك كعامل مضاد للالتصاق، وعامل مضاد للتكتل، ومادة تشحيم، وناقل، ومكثف، وحشو مقوي، وحشو ناعم، وممتز. إن المحرك الرئيسي لنمو سوق التلك هو الطلب المتزايد من مختلف الصناعات ذات الاستخدام النهائي مثل السيراميك والبلاستيك والدهانات والطلاءات والأغذية والزراعة. يعد قطاع السيراميك القطاع الأكثر جاذبية ويخلق فرصًا مربحة في سوق التلك العالمية. تعد صناعة البلاستيك مستهلكًا أساسيًا آخر للتلك. يستخدم التلك بشكل أساسي كحشو في البلاستيك.
محركات النمو والتحديات:
يُستخدم التلك بشكل شائع في صناعة اللب والورق كعامل للتحكم في درجة الالتصاق، وصبغة الطلاء، وحشو وظيفي. يساعد التلك في تعزيز قابلية تشغيل آلة الورق. يُستخدم التلك لإعادة تدوير الورق وإنتاج ورق جديد، ولب، وكرتون. تمنع خصائص التلك تكتل الالتصاق داخل آلة الإنتاج. يُستخدم التلك كحشو لإضفاء النعومة والمسامية والعتامة على الورق. كما يعمل التلك في إنتاج الورق على تحسين جودة المنتجات النهائية وتقليل تكاليف الإنتاج. علاوة على ذلك، يُستخدم التلك في العديد من الصناعات النهائية مثل الدهانات والطلاءات والبلاستيك والزراعة والأغذية. في صناعة الطلاء، يقلل استخدام التلك من استخدام الصبغة الأولية في إنتاج الطلاء، مما يقلل من تكاليف التصنيع. يعزز التلك طبقة الطلاء ويحسن من متانته ومقاومته للبقع. نظرًا لخصائصه المثبطة للصدأ ومقاومة التآكل، فإن الطلاء يدوم لفترة أطول. كما يعمل التلك كممدد على زيادة لزوجة الطلاء. إن النمو القوي لقطاعات البناء والسيارات والصناعة يدفع الطلب على الدهانات والطلاءات. يتم استخراج التلك من الأرض. وقد يحتوي على الأسبستوس، وهو مادة شديدة السمية. يوجد الأسبستوس تحت الأرض، وغالبًا ما يمكن العثور على عروقه في رواسب التلك، مما يؤدي إلى خطر التلوث المتبادل. وبالتالي، هناك احتمالات عالية لوجود التلك الملوث بالأسبستوس في منتجات مختلفة. يمكن أن يؤدي التعرض الطويل الأمد للأسبستوس إلى زيادة مخاطر الإصابة بالسرطان، وخاصة الورم المتوسطة (سرطان الرئة)، وسرطان المبيض، وسرطان الحنجرة.
قم بتخصيص هذا التقرير ليناسب متطلباتك
ستحصل على تخصيص لأي تقرير - مجانًا - بما في ذلك أجزاء من هذا التقرير، أو تحليل على مستوى الدولة، وحزمة بيانات Excel، بالإضافة إلى الاستفادة من العروض والخصومات الرائعة للشركات الناشئة والجامعات
سوق التلك: رؤى استراتيجية
- احصل على أهم اتجاهات السوق الرئيسية لهذا التقرير.ستتضمن هذه العينة المجانية تحليلاً للبيانات، بدءًا من اتجاهات السوق وحتى التقديرات والتوقعات.
تقسيم التقرير ونطاقه:
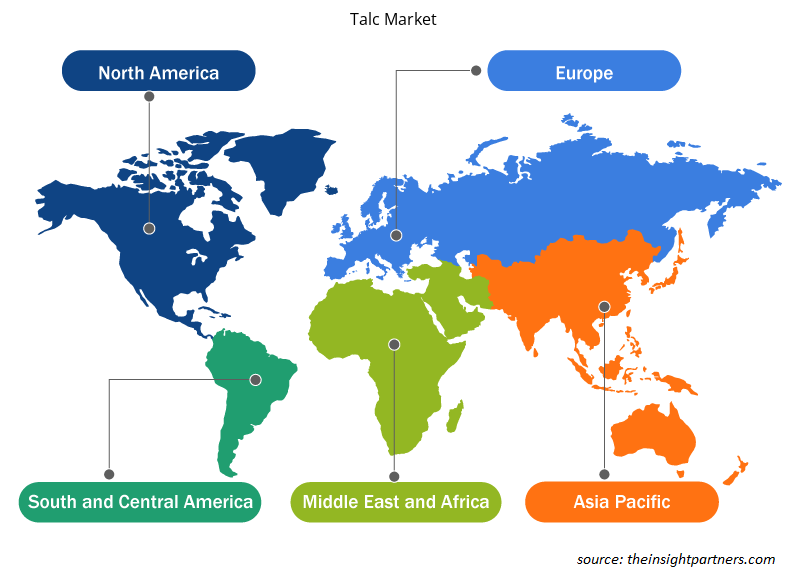
ينقسم سوق التلك العالمي على أساس نوع الودائع وصناعة الاستخدام النهائي. بناءً على نوع الودائع، يتم تقسيم سوق التلك إلى كلوريت التلك وكربونات التلك. بناءً على صناعة الاستخدام النهائي، يتم تقسيم سوق التلك إلى البلاستيك واللب والورق والسيراميك والدهانات والطلاءات والمطاط والمستحضرات الصيدلانية والأغذية وغيرها. من حيث الجغرافيا، يتم تقسيم سوق التلك العالمي على نطاق واسع إلى أمريكا الشمالية وأوروبا وآسيا والمحيط الهادئ والشرق الأوسط وأفريقيا وأمريكا الجنوبية والوسطى. يتم تقسيم سوق التلك في أمريكا الشمالية إلى الولايات المتحدة وكندا والمكسيك. يتم تقسيم السوق في أوروبا إلى ألمانيا وفرنسا والمملكة المتحدة وإيطاليا وروسيا وبقية أوروبا. يتم تقسيم سوق التلك في منطقة آسيا والمحيط الهادئ إلى الصين والهند واليابان وأستراليا وكوريا الجنوبية وبقية منطقة آسيا والمحيط الهادئ. يتم تقسيم سوق الشرق الأوسط وأفريقيا إلى جنوب إفريقيا والمملكة العربية السعودية والإمارات العربية المتحدة وبقية منطقة الشرق الأوسط وأفريقيا. يتم تقسيم سوق التلك في أمريكا الجنوبية والوسطى إلى البرازيل والأرجنتين وبقية أمريكا الجنوبية والوسطى.
التحليل القطاعي:
بناءً على نوع الودائع، يتم تقسيم سوق التلك إلى كلوريت التلك وكربونات التلك. احتل قطاع كربونات التلك حصة سوقية أكبر في عام 2022. تحتوي أجسام خام كربونات التلك بشكل أساسي على كربونات التلك وآثار الكلوريت. غالبًا ما توجد هذه الرواسب في الصخور المتحولة ويمكن اعتبارها نوعًا فرعيًا من الرواسب المتحولة. في رواسب كربونات التلك، غالبًا ما يرتبط تكوين التلك بالتناوب بين الصخور الموجودة مسبقًا الغنية بالمعادن الغنية بالمغنيسيوم. يحل التلك محل هذه المعادن تحت تأثير الظروف المتحولة، مما يؤدي إلى تطور الصخور الغنية بالتلك. تتم معالجة خامات كربونات التلك لإزالة المعادن المرتبطة بها وإنتاج مركز التلك النقي. بناءً على صناعة الاستخدام النهائي، يتم تقسيم سوق التلك إلى البلاستيك واللب والورق والسيراميك والدهانات والطلاء والمطاط والمستحضرات الصيدلانية والأغذية وغيرها. كانت حصة التلك في سوق قطاع اللب والورق ملحوظة في عام 2022. في صناعة اللب والورق، يتم استخدام التلك كحشو للورق، حيث أن له تأثير سلبي ضئيل على قوة الورقة ولكنه يحسن استقبال الحبر بهامش كبير. كما أنه يعزز العتامة والسطوع ويقلل اللمعان. يمكن استخدام التلك في إعادة تدوير الورق والإنتاج الجديد للورق واللب والكرتون كحشو. يحسن استخدام التلك خصائص المنتجات النهائية ويقلل من تكاليف الإنتاج.
التحليل الإقليمي:
تم تقسيم سوق التلك إلى خمس مناطق رئيسية - أمريكا الشمالية وأوروبا وآسيا والمحيط الهادئ وأمريكا الجنوبية والوسطى والشرق الأوسط وأفريقيا. سيطرت منطقة آسيا والمحيط الهادئ على سوق التلك العالمية، والتي بلغت قيمتها حوالي 950 مليون دولار أمريكي في عام 2022. كما تعد أمريكا الشمالية مساهمًا رئيسيًا، حيث تمتلك حصة كبيرة في سوق التلك العالمية. ومن المتوقع أن يصل سوق التلك في أمريكا الشمالية إلى أكثر من 300 مليون دولار أمريكي بحلول عام 2030. ومن المتوقع أن تسجل أوروبا معدل نمو سنوي مركب كبير يزيد عن 5٪ من عام 2022 إلى عام 2030. تعد أستراليا والصين والهند واليابان وكوريا الجنوبية المساهمين الرئيسيين في سوق التلك في منطقة آسيا والمحيط الهادئ. تعد منطقة آسيا والمحيط الهادئ واحدة من أكبر مناطق إنتاج التلك الخام والمعالج على مستوى العالم. تعد المنطقة موطنًا لكبار الشركات المصنعة التي تنتج البلاستيك خفيف الوزن لمكونات السيارات. ومن المتوقع أن يؤدي التصنيع السريع والزيادة في الدخل المتاح لسكان الطبقة المتوسطة في الاقتصادات الناشئة إلى دفع الطلب على التلك في منطقة آسيا والمحيط الهادئ. وبحسب المنظمة الدولية لمصنعي السيارات (OICA)، ارتفع إنتاج السيارات في آسيا وأوقيانوسيا من 44.2 مليون سيارة في عام 2020 إلى 46.7 مليون سيارة في عام 2021.
تطورات الصناعة والفرص المستقبلية:
فيما يلي قائمة بالمبادرات المختلفة التي اتخذتها الجهات الفاعلة الرئيسية العاملة في سوق التلك:
- في فبراير 2021، أعلنت شركة Magris Resources Canada Inc. أنها دخلت في اتفاقية وساطة نهائية للاستحواذ على جميع أصول Imerys Talc America Inc. و Imerys Talc Vermont Inc. و Imerys Talc Canada Inc.
رؤى إقليمية حول سوق التلك
لقد قام المحللون في Insight Partners بشرح الاتجاهات والعوامل الإقليمية المؤثرة على سوق التلك طوال فترة التوقعات بشكل شامل. يناقش هذا القسم أيضًا قطاعات سوق التلك والجغرافيا في جميع أنحاء أمريكا الشمالية وأوروبا ومنطقة آسيا والمحيط الهادئ والشرق الأوسط وأفريقيا وأمريكا الجنوبية والوسطى.
- احصل على البيانات الإقليمية المحددة لسوق التلك
نطاق تقرير سوق التلك
| سمة التقرير | تفاصيل |
|---|---|
| حجم السوق في عام 2022 | 1.99 مليار دولار أمريكي |
| حجم السوق بحلول عام 2030 | 2.93 مليار دولار أمريكي |
| معدل النمو السنوي المركب العالمي (2022 - 2030) | 5.0% |
| البيانات التاريخية | 2020-2021 |
| فترة التنبؤ | 2023-2030 |
| القطاعات المغطاة | حسب نوع الوديعة
|
| المناطق والدول المغطاة | أمريكا الشمالية
|
| قادة السوق وملفات تعريف الشركات الرئيسية |
|
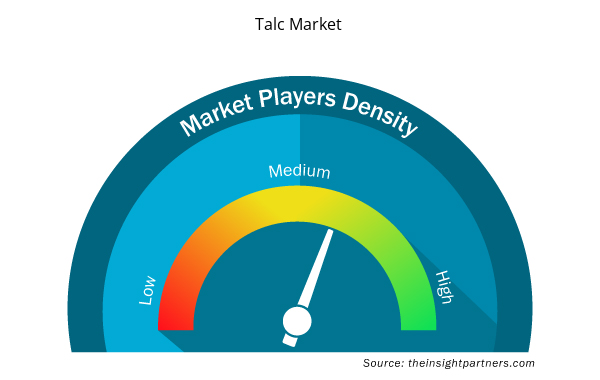
كثافة اللاعبين في السوق: فهم تأثيرها على ديناميكيات الأعمال
يشهد سوق التلك نموًا سريعًا، مدفوعًا بالطلب المتزايد من جانب المستخدم النهائي بسبب عوامل مثل تفضيلات المستهلكين المتطورة والتقدم التكنولوجي والوعي المتزايد بفوائد المنتج. ومع ارتفاع الطلب، تعمل الشركات على توسيع عروضها والابتكار لتلبية احتياجات المستهلكين والاستفادة من الاتجاهات الناشئة، مما يؤدي إلى زيادة نمو السوق.
تشير كثافة اللاعبين في السوق إلى توزيع الشركات أو المؤسسات العاملة في سوق أو صناعة معينة. وهي تشير إلى عدد المنافسين (اللاعبين في السوق) الموجودين في مساحة سوق معينة نسبة إلى حجمها أو قيمتها السوقية الإجمالية.
الشركات الرئيسية العاملة في سوق التلك هي:
- شركة إليمنتيس المحدودة
- شركة جولشا للمعادن المحدودة
- شركة إيمريس إس إيه
- شركة أي إم آي فابي
- شركة لياونينغ أيهاي للتالك المحدودة
إخلاء المسؤولية : الشركات المذكورة أعلاه ليست مرتبة بأي ترتيب معين.
- احصل على نظرة عامة على أهم اللاعبين الرئيسيين في سوق التلك
تأثير جائحة كوفيد-19:
أثرت جائحة كوفيد-19 سلبًا على جميع الصناعات تقريبًا في مختلف البلدان. أعاقت عمليات الإغلاق وإغلاق الشركات والقيود المفروضة على السفر في أمريكا الشمالية وأوروبا ومنطقة آسيا والمحيط الهادئ وأمريكا الجنوبية والوسطى والشرق الأوسط وأفريقيا نمو العديد من الصناعات، بما في ذلك صناعة الكيماويات والمواد. أدى إغلاق وحدات التصنيع إلى اضطراب سلاسل التوريد العالمية وأنشطة التصنيع وجداول التسليم ومبيعات المنتجات الأساسية وغير الأساسية. أفادت شركات مختلفة بتأخيرات في تسليم المنتجات وانخفاض في مبيعات منتجاتها في عام 2020. وبسبب الركود الاقتصادي الناجم عن الوباء، أصبح المستهلكون حذرين وانتقائيين في قرارات الشراء. قلل المستهلكون بشكل كبير من المشتريات غير الأساسية بسبب انخفاض الدخول وآفاق الكسب غير المؤكدة، وخاصة في المناطق النامية. أبلغ العديد من مصنعي التلك عن انخفاض الأرباح بسبب انخفاض الطلب من المستهلكين خلال المرحلة الأولية من الوباء. ومع ذلك، بحلول نهاية عام 2021، تم تطعيم العديد من البلدان بالكامل، وأعلنت الحكومات عن تخفيف بعض القيود التنظيمية، بما في ذلك عمليات الإغلاق وحظر السفر. وقد شهدنا ارتفاعًا في الدخل المتاح للسكان، مما أدى إلى زيادة التركيز على شراء الأثاث الجديد والتجديد، مما أدى إلى زيادة الطلب على التلك. وتساهم كل هذه العوامل في تعزيز نمو سوق التلك في مختلف المناطق.
المنافسة والشركات الرئيسية:
تعد Elementis Plc وGolcha Minerals Pvt Ltd وImerys SA وIMI Fabi SpA وLiaoning Aihai Talc Co Ltd وMinerals Technologies Inc وNippon Talc Co Ltd وSCR-Sibelco NV وSun Minerals Pvt Ltd وXilolite SA من بين اللاعبين البارزين الذين يعملون في سوق التلك العالمية. تقدم هذه الشركات التلك عالي الجودة وتلبي احتياجات العديد من المستهلكين في جميع أنحاء العالم.

حابي محلل أبحاث سوق متمرس، يتمتع بخبرة 8 سنوات في قطاع الكيماويات والمواد، بالإضافة إلى خبرته في قطاعي الأغذية والمشروبات والسلع الاستهلاكية. وهو مهندس كيميائي من معهد فيشواكارما للتكنولوجيا (VIT)، وقد اكتسب معرفةً عميقةً في مجالات الكيماويات الصناعية والتخصصية، والدهانات والطلاءات، والورق والتغليف، ومواد التشحيم، والمنتجات الاستهلاكية.
تشمل كفاءات حابي الأساسية تقدير حجم السوق والتنبؤ به، ووضع معايير تنافسية، وتحليل الاتجاهات، والتفاعل مع العملاء، وكتابة التقارير، وتنسيق الفريق، مما يجعله بارعًا في تقديم رؤى عملية ودعم اتخاذ القرارات الاستراتيجية.
- التحليل التاريخي (سنتان)، سنة الأساس، التوقعات (7 سنوات) مع معدل النمو السنوي المركب
- تحليل PEST و SWOT
- حجم السوق والقيمة / الحجم - عالمي، إقليمي، بلد
- الصناعة والمنافسة
- مجموعة بيانات إكسل
التقارير الحديثة
شهادات العملاء
تقرير سوق أنظمة SCADA من Insight Partners شامل، ويقدم رؤى قيّمة حول الاتجاهات الحالية والتوقعات المستقبلية. تميّز الفريق باحترافية عالية وسرعة في الاستجابة ودعم مستمر طوال الوقت. نحن راضون جدًا ونوصي بشدة بخدماتهم.
ران كيديم شريك, شركة ريالي تكنولوجيز المحدودةطلبتُ تقريرًا عن سوق برمجيات محدد، وأعدّه الفريق في غضون أيام قليلة. كانت المعلومات ذات صلة وثيقة وعرضها جيد. ثم طلبتُ بعض التعديلات والإضافات على التقرير. وكان الفريق متجاوبًا للغاية، وحصلتُ على التقرير النهائي في أقل من أسبوع.
جان هيرفيه جين رئيس مجلس الإدارة, فيوتشر أناليتيكاعملنا مع شركة "إنسايت بارتنرز" لإجراء دراسة سوقية وتوقعات مهمة. زودونا برؤى واضحة حول الفرص والمخاطر، مما ساعدنا في صياغة خططنا. كانت أبحاثهم سهلة الاستخدام ومبنية على بيانات دقيقة، مما ساعدنا على اتخاذ قرارات ذكية وواثقة. نوصي بهم بشدة.
بيوش ناجبال نائب الرئيس الأول, شعاع عالي عالميقدّمت شركة Insight Partners أبحاثًا سوقية ثاقبة ومنظمة جيدًا بخبرة واسعة في هذا المجال. تميّز فريقهم بالاحترافية وسرعة الاستجابة طوال الوقت. وسهّل موقعهم الإلكتروني سهل الاستخدام الوصول إلى تقارير القطاع. نوصي بهم بشدة لخدمات بحثية موثوقة وعالية الجودة.
يوكيهيكو أداتشي المدير التنفيذي, ديب بلو، ذ.م.م.هذه أول مرة أشتري فيها تقرير سوق من The Insight Partners. رغم أنني كنت مترددًا في البداية، إلا أنني زرت موقعهم الإلكتروني وشعرت براحة أكبر للمخاطرة وشراء تقرير السوق. أنا راضٍ تمامًا عن جودة التقرير وخدمة العملاء. كانت لديّ عدة أسئلة وتعليقات حول التقرير الأولي، ولكن بعد بضع محادثات عبر البريد الإلكتروني مع محللهم، أعتقد أن لديّ تقريرًا يمكنني استخدامه كمدخل لعملية التخطيط الاستراتيجي لدينا. شكرًا جزيلاً لكم على تخصيص وقتكم الإضافي وجعل هذه التجربة إيجابية. سأوصي بخدماتكم للآخرين بالتأكيد، وستكونون أول من ألجأ إليه عندما نحتاج إلى المزيد من بيانات السوق.
جون سوزوكي الرئيس والرئيس التنفيذي وعضو مجلس الإدارة, بي كيه تكنولوجيزأود أن أقدّر دعمكم واحترافيتكم في الاستجابة لطلبي للحصول على معلومات بشأن سوق التشخيص المخبري للأمراض المعدية في نيجيريا. كما أُقدّر صبركم وتوجيهكم، واستعدادكم لتقديم خصم، مما مكّننا في النهاية من إتمام الصفقة. أتطلع إلى التعامل مع "ذا إنسايت بارتنرز" مستقبلًا، كل ذلك بفضل الانطباع الذي تركتموه لديّ نتيجةً لهذا اللقاء الأول.
الدكتور تشيجيوك أونيا المدير الإداري, شركة باينكريست للرعاية الصحية المحدودةسبب الشراء
- اتخاذ قرارات مدروسة
- فهم ديناميكيات السوق
- تحليل المنافسة
- رؤى العملاء
- توقعات السوق
- تخفيف المخاطر
- التخطيط الاستراتيجي
- مبررات الاستثمار
- تحديد الأسواق الناشئة
- تحسين استراتيجيات التسويق
- تعزيز الكفاءة التشغيلية
- مواكبة التوجهات التنظيمية


 احصل على عينة مجانية ل - سوق التلك