سوق أنظمة مراقبة المحولات – المحركات والاتجاهات والفرص وإحصاءات النمو | 2031
البيانات التاريخية : 2021-2022 | سنة الأساس : 2023 | فترة التنبؤ : 2024-2031حجم سوق أنظمة مراقبة المحولات وتوقعاته (2021-2031)، والحصة العالمية والإقليمية، والاتجاهات، وفرص النمو. يغطي التقرير: حسب المكون (الأجهزة وحلول تكنولوجيا المعلومات)؛ الخدمة (مراقبة الوصلات، ومراقبة النفط/الغاز، وغيرها)؛ التطبيق (محولات التوزيع، ومحولات الطاقة، وغيرها)؛ والجغرافيا.
- تاريخ التقرير : Feb 2026
- رمز التقرير : TIPRE00008332
- الفئة : التكنولوجيا والإعلام والاتصالات
- الحالة : البيانات الصادرة
- تنسيقات التقارير المتاحة :


- عدد الصفحات : 150
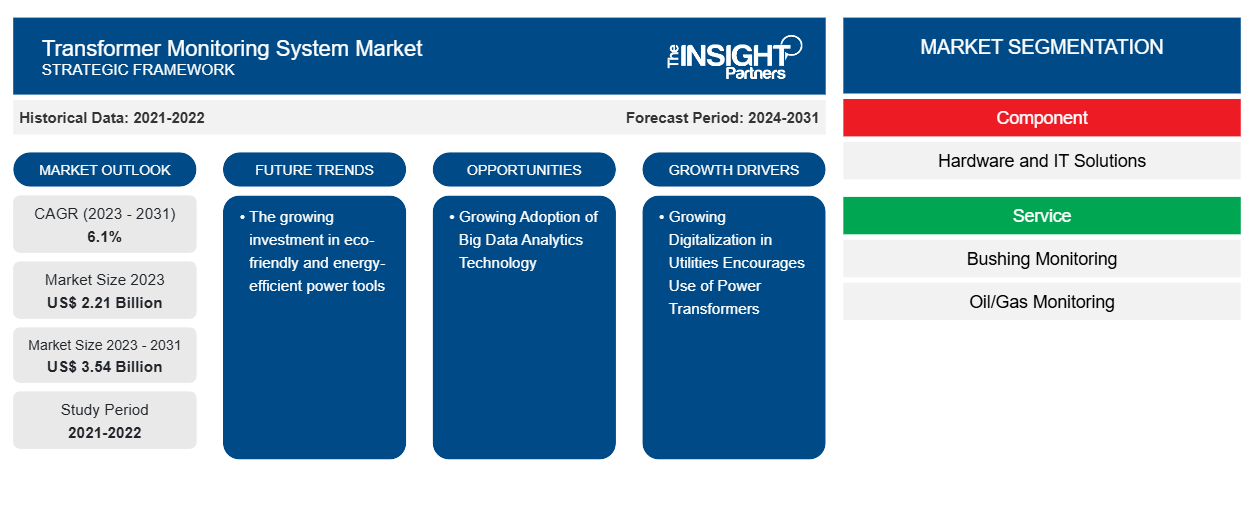
من المتوقع أن يصل حجم سوق نظام مراقبة المحولات إلى 3.54 مليار دولار أمريكي بحلول عام 2031 من 2.21 مليار دولار أمريكي في عام 2023. ومن المتوقع أن يسجل السوق معدل نمو سنوي مركب بنسبة 6.1٪ في الفترة 2023-2031. ومن المرجح أن يظل الاستثمار المتزايد في الأدوات الكهربائية الصديقة للبيئة والموفرة للطاقة اتجاهًا رئيسيًا في سوق نظام مراقبة المحولات.
تحليل سوق نظام مراقبة المحولات
يشهد سوق أنظمة مراقبة المحولات نموًا سريعًا بسبب الرقمنة المتزايدة في المرافق التي تشجع على استخدام محولات الطاقة، والطلب العالمي المتزايد على توليد الطاقة النظيفة والمتجددة. يتوسع السوق بشكل مطرد، مدفوعًا بالقلق المتزايد المتعلق بإدارة الأصول والفعالية التشغيلية. علاوة على ذلك، فإن الطلب المتزايد واعتماد تقنية تحليل البيانات الضخمة والاستثمار المتزايد في مزارع الرياح البحرية يوفر فرصًا مربحة لنمو السوق.
نظرة عامة على سوق أنظمة مراقبة المحولات
نظام مراقبة المحولات هو مجموعة من الأدوات والتقنيات التي تُستخدم بشكل جماعي لجمع وتحليل البيانات المتعلقة بظروف عمل وأداء المحولات. يُستخدم النظام لتحديد حالة المحولات وجودتها وأدائها والتنبؤ بفشلها وتوفير تحذيرات مبكرة والسماح للمستخدمين بتنفيذ استراتيجيات الصيانة والاستبدال الاستباقية. يجمع نظام مراقبة المحولات البيانات حول العديد من المعلمات، بما في ذلك مغير الصنبور ونظام التبريد والغاز المذاب والتفريغ الجزئي ومعامل قدرة الجلبة ودرجات الحرارة والضغط ومستويات الزيت في المحول. يتم دفع السوق من خلال استهلاك الطاقة المتزايد ورقمنة المصانع والطلب المتزايد على أنظمة مراقبة المحولات بين صناعات الطاقة وتوليد الطاقة.
قم بتخصيص هذا التقرير ليناسب متطلباتك
ستحصل على تخصيص لأي تقرير - مجانًا - بما في ذلك أجزاء من هذا التقرير، أو تحليل على مستوى الدولة، وحزمة بيانات Excel، بالإضافة إلى الاستفادة من العروض والخصومات الرائعة للشركات الناشئة والجامعات
سوق أنظمة مراقبة المحولات: رؤى استراتيجية
-
احصل على أهم اتجاهات السوق الرئيسية لهذا التقرير.ستتضمن هذه العينة المجانية تحليلاً للبيانات، بدءًا من اتجاهات السوق وحتى التقديرات والتوقعات.
محركات وفرص سوق أنظمة مراقبة المحولات
النمو المتنامي للرقمنة في المرافق يشجع على استخدام محولات الطاقة ويقود السوق
تستثمر شركات المرافق الكهربائية بشكل كبير في أتمتة العمليات والمراقبة الرقمية وإدارة العمليات. تتطلب شركات المرافق الكهربائية عددًا كبيرًا من أجهزة الاستشعار وأدوات معالجة البيانات للتعامل مع البيانات المجمعة واستخدامها بذكاء. يؤدي توسع الشبكات الكهربائية لتلبية الطلب المتزايد على الطاقة من العملاء التجاريين والصناعيين والسكنيين إلى زيادة الطلب على المحولات بين شركات المرافق الكهربائية للتوزيع السليم للكهرباء. تستثمر شركات المرافق الكهربائية أيضًا في ترقية الشبكات لزيادة الموثوقية والمرونة. هذا يزيد من الطلب على أنظمة مراقبة المحولات لاستبدال المحولات القديمة وترقية البنية التحتية القديمة. تلعب أنظمة مراقبة المحولات دورًا مهمًا في مراقبة الشبكات لمرافق النقل والتوزيع على مستوى التوليد. يعد مراقبة محولات التوليد أمرًا بالغ الأهمية قبل توصيل الكهرباء إلى الشبكة. هذا يفرض على شركات المرافق الكهربائية رقمنة نظام المراقبة الخاص بها للتوزيع الفعال للكهرباء. وبالتالي، من المتوقع أن يؤدي رقمنة المرافق إلى زيادة الطلب على أنظمة مراقبة المحولات.
التبني المتزايد لتقنية تحليلات البيانات الضخمة – فرصة في سوق أنظمة مراقبة المحولات
تزيد تحليلات البيانات الضخمة من الطلب على محولات الطاقة في صناعة الطاقة. تسمح تحليلات البيانات الضخمة لشركات المرافق بتحسين أنظمة الطاقة الخاصة بها من خلال جمع وتحليل كميات هائلة من البيانات في الوقت الفعلي المتعلقة بالطلب والعرض على الكهرباء. تسمح هذه الطريقة القائمة على البيانات بعمليات شبكة أكثر كفاءة وتحسن كفاءة النظام بشكل عام. يشجع الطلب المتزايد على الطاقة بين المستهلكين صناعة الطاقة على تبني محولات الطاقة الحديثة التي يمكنها التكيف مع الأحمال المتغيرة والتواصل بسهولة مع أنظمة تحليل البيانات. علاوة على ذلك، فإن الفوائد الكبيرة التي توفرها تقنية تحليلات البيانات الضخمة لأنظمة مراقبة المحولات، بما في ذلك الصيانة التنبؤية، واكتشاف الصعوبات والأعطال، وفحص البيانات، من بين أمور أخرى، تخلق فرصًا في السوق.
تقرير تحليل تجزئة سوق نظام مراقبة المحولات
إن القطاعات الرئيسية التي ساهمت في اشتقاق تحليل سوق نظام مراقبة المحولات هي المكونات والخدمة والتطبيق.
- بناءً على المكونات، ينقسم سوق نظام مراقبة المحولات إلى أجهزة وحلول تكنولوجيا المعلومات. احتل قطاع الأجهزة حصة سوقية أكبر في عام 2023.
- من حيث الخدمة، ينقسم سوق نظام مراقبة المحولات إلى مراقبة البطانات، ومراقبة النفط/الغاز، وغيرها. احتل قطاع مراقبة البطانات حصة سوقية أكبر في عام 2023.
- على أساس التطبيق، يتم تقسيم السوق إلى محولات التوزيع ومحولات الطاقة وغيرها. احتل قطاع محولات الطاقة الحصة الأكبر من السوق في عام 2023.
تحليل حصة سوق أنظمة مراقبة المحولات حسب المنطقة الجغرافية
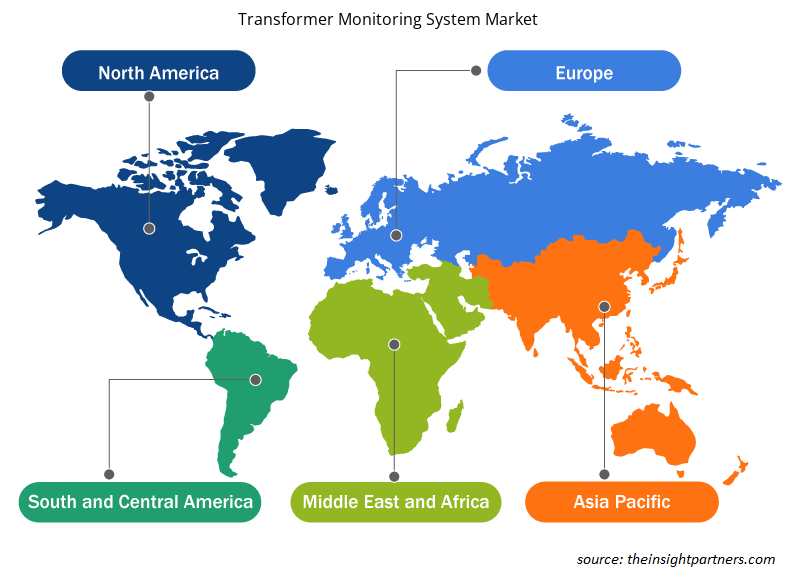
ينقسم النطاق الجغرافي لتقرير سوق نظام مراقبة المحولات بشكل أساسي إلى خمس مناطق: أمريكا الشمالية، ومنطقة آسيا والمحيط الهادئ، وأوروبا، والشرق الأوسط وأفريقيا، وأمريكا الجنوبية/أمريكا الجنوبية والوسطى.
من المتوقع أن ينمو السوق في منطقة آسيا والمحيط الهادئ بوتيرة كبيرة خلال الفترة المتوقعة، وذلك بسبب التصنيع المتزايد والتحضر السريع. إن التقدم التكنولوجي والعدد المتزايد من مشاريع الطاقة المتجددة يخلق فرصًا للسوق في المنطقة. تعد أنظمة مراقبة المحولات مفيدة للغاية في مشاريع الطاقة المتجددة للكشف عن المشاكل وتجنبها والتي قد تؤدي إلى انقطاعات مكلفة.
رؤى إقليمية حول سوق أنظمة مراقبة المحولات
لقد قام المحللون في Insight Partners بشرح الاتجاهات والعوامل الإقليمية المؤثرة على سوق نظام مراقبة المحولات طوال فترة التوقعات بشكل شامل. يناقش هذا القسم أيضًا قطاعات سوق نظام مراقبة المحولات والجغرافيا في جميع أنحاء أمريكا الشمالية وأوروبا ومنطقة آسيا والمحيط الهادئ والشرق الأوسط وأفريقيا وأمريكا الجنوبية والوسطى.
- احصل على البيانات الإقليمية المحددة لسوق نظام مراقبة المحولات
نطاق تقرير سوق نظام مراقبة المحولات
| سمة التقرير | تفاصيل |
|---|---|
| حجم السوق في عام 2023 | 2.21 مليار دولار أمريكي |
| حجم السوق بحلول عام 2031 | 3.54 مليار دولار أمريكي |
| معدل النمو السنوي المركب العالمي (2023 - 2031) | 6.1% |
| البيانات التاريخية | 2021-2022 |
| فترة التنبؤ | 2024-2031 |
| القطاعات المغطاة |
حسب المكون
|
| المناطق والدول المغطاة |
أمريكا الشمالية
|
| قادة السوق وملفات تعريف الشركات الرئيسية |
|
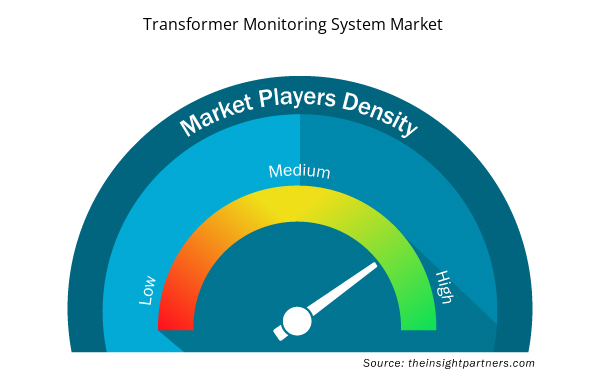
كثافة اللاعبين في سوق أنظمة مراقبة المحولات: فهم تأثيرها على ديناميكيات الأعمال
يشهد سوق أنظمة مراقبة المحولات نموًا سريعًا، مدفوعًا بالطلب المتزايد من المستخدم النهائي بسبب عوامل مثل تفضيلات المستهلكين المتطورة والتقدم التكنولوجي والوعي المتزايد بفوائد المنتج. ومع ارتفاع الطلب، تعمل الشركات على توسيع عروضها والابتكار لتلبية احتياجات المستهلكين والاستفادة من الاتجاهات الناشئة، مما يؤدي إلى زيادة نمو السوق.
تشير كثافة اللاعبين في السوق إلى توزيع الشركات أو المؤسسات العاملة في سوق أو صناعة معينة. وهي تشير إلى عدد المنافسين (اللاعبين في السوق) الموجودين في مساحة سوق معينة نسبة إلى حجمها أو قيمتها السوقية الإجمالية.
الشركات الرئيسية العاملة في سوق نظام مراقبة المحولات هي:
- شركة أي بي بي المحدودة
- شركة إيتون المحدودة
- شركة هونيويل الدولية
- شركة شنايدر الكتريك
- شركة سيمنز ايه جي
- مختبرات شفايتزر الهندسية، المحدودة
إخلاء المسؤولية : الشركات المذكورة أعلاه ليست مرتبة بأي ترتيب معين.
- احصل على نظرة عامة على أهم اللاعبين الرئيسيين في سوق نظام مراقبة المحولات
أخبار سوق أنظمة مراقبة المحولات والتطورات الأخيرة
يتم تقييم سوق نظام مراقبة المحولات من خلال جمع البيانات النوعية والكمية بعد البحث الأولي والثانوي، والتي تتضمن منشورات الشركات المهمة وبيانات الجمعيات وقواعد البيانات. فيما يلي قائمة بالتطورات في سوق نظام مراقبة المحولات والاستراتيجيات:
- في أكتوبر 2023، استثمرت شركة Eaton Corporation plc مبلغ 85 مليون دولار أمريكي لزيادة تصنيع حلول المرافق الأساسية في أمريكا الشمالية، وتعزيز التحول في مجال الطاقة والكهرباء. تعمل الاستثمارات في التصنيع الإقليمي على زيادة إمدادات المحولات والمنظمات ومفاتيح التوزيع وغيرها من معدات المرافق. (المصدر: شركة Eaton Corporation plc، بيان صحفي، 2023)
تقرير سوق أنظمة مراقبة المحولات - التغطية والمخرجات
يوفر تقرير "حجم سوق نظام مراقبة المحولات والتوقعات (2021-2031)" تحليلاً مفصلاً للسوق يغطي المجالات التالية:
- حجم السوق والتوقعات على المستويات العالمية والإقليمية والوطنية لجميع قطاعات السوق الرئيسية التي يغطيها النطاق
- ديناميكيات السوق مثل المحركات والقيود والفرص الرئيسية
- الاتجاهات المستقبلية الرئيسية
- تحليل مفصل لقوى PEST/Porter الخمس وSWOT
- تحليل السوق العالمي والإقليمي الذي يغطي اتجاهات السوق الرئيسية واللاعبين الرئيسيين واللوائح والتطورات الأخيرة في السوق
- تحليل المشهد الصناعي والمنافسة الذي يغطي تركيز السوق، وتحليل خريطة الحرارة، واللاعبين البارزين، والتطورات الأخيرة
- ملفات تعريف الشركة التفصيلية

أنكيتا خبيرة ديناميكية في أبحاث السوق والاستشارات، تتمتع بخبرة تزيد عن 8 سنوات في قطاعات التكنولوجيا والإعلام وتكنولوجيا المعلومات والاتصالات والإلكترونيات وأشباه الموصلات. وقد قادت ونفذت بنجاح أكثر من 100 مهمة استشارية وبحثية لعملاء عالميين مثل مايكروسوفت وأوراكل وشركة NEC وSAP وKPMG وExpeditors International. تشمل كفاءاتها الأساسية تقييم السوق، وتحليل البيانات، والتنبؤ، وصياغة الاستراتيجيات، والاستخبارات التنافسية، وكتابة التقارير.
أنكيتا بارعة في إدارة دورات المشاريع الكاملة، بدءًا من تصميم عروض ما قبل البيع ومناقشات العملاء، وصولًا إلى تقديم رؤى عملية بعد البيع. كما أنها ماهرة في إدارة فرق متعددة الوظائف، وهيكلة وحدات بحثية معقدة، ومواءمة الحلول مع أهداف العمل الخاصة بالعملاء. وقد مكنتها مهاراتها الممتازة في التواصل والقيادة والعرض التقديمي من تحقيق نتائج قيّمة باستمرار في بيئات سوقية سريعة التطور.
- التحليل التاريخي (سنتان)، سنة الأساس، التوقعات (7 سنوات) مع معدل النمو السنوي المركب
- تحليل PEST و SWOT
- حجم السوق والقيمة / الحجم - عالمي، إقليمي، بلد
- الصناعة والمنافسة
- مجموعة بيانات إكسل
التقارير الحديثة
شهادات العملاء
تقرير سوق أنظمة SCADA من Insight Partners شامل، ويقدم رؤى قيّمة حول الاتجاهات الحالية والتوقعات المستقبلية. تميّز الفريق باحترافية عالية وسرعة في الاستجابة ودعم مستمر طوال الوقت. نحن راضون جدًا ونوصي بشدة بخدماتهم.
ران كيديم شريك, شركة ريالي تكنولوجيز المحدودةطلبتُ تقريرًا عن سوق برمجيات محدد، وأعدّه الفريق في غضون أيام قليلة. كانت المعلومات ذات صلة وثيقة وعرضها جيد. ثم طلبتُ بعض التعديلات والإضافات على التقرير. وكان الفريق متجاوبًا للغاية، وحصلتُ على التقرير النهائي في أقل من أسبوع.
جان هيرفيه جين رئيس مجلس الإدارة, فيوتشر أناليتيكاعملنا مع شركة "إنسايت بارتنرز" لإجراء دراسة سوقية وتوقعات مهمة. زودونا برؤى واضحة حول الفرص والمخاطر، مما ساعدنا في صياغة خططنا. كانت أبحاثهم سهلة الاستخدام ومبنية على بيانات دقيقة، مما ساعدنا على اتخاذ قرارات ذكية وواثقة. نوصي بهم بشدة.
بيوش ناجبال نائب الرئيس الأول, شعاع عالي عالميقدّمت شركة Insight Partners أبحاثًا سوقية ثاقبة ومنظمة جيدًا بخبرة واسعة في هذا المجال. تميّز فريقهم بالاحترافية وسرعة الاستجابة طوال الوقت. وسهّل موقعهم الإلكتروني سهل الاستخدام الوصول إلى تقارير القطاع. نوصي بهم بشدة لخدمات بحثية موثوقة وعالية الجودة.
يوكيهيكو أداتشي المدير التنفيذي, ديب بلو، ذ.م.م.هذه أول مرة أشتري فيها تقرير سوق من The Insight Partners. رغم أنني كنت مترددًا في البداية، إلا أنني زرت موقعهم الإلكتروني وشعرت براحة أكبر للمخاطرة وشراء تقرير السوق. أنا راضٍ تمامًا عن جودة التقرير وخدمة العملاء. كانت لديّ عدة أسئلة وتعليقات حول التقرير الأولي، ولكن بعد بضع محادثات عبر البريد الإلكتروني مع محللهم، أعتقد أن لديّ تقريرًا يمكنني استخدامه كمدخل لعملية التخطيط الاستراتيجي لدينا. شكرًا جزيلاً لكم على تخصيص وقتكم الإضافي وجعل هذه التجربة إيجابية. سأوصي بخدماتكم للآخرين بالتأكيد، وستكونون أول من ألجأ إليه عندما نحتاج إلى المزيد من بيانات السوق.
جون سوزوكي الرئيس والرئيس التنفيذي وعضو مجلس الإدارة, بي كيه تكنولوجيزأود أن أقدّر دعمكم واحترافيتكم في الاستجابة لطلبي للحصول على معلومات بشأن سوق التشخيص المخبري للأمراض المعدية في نيجيريا. كما أُقدّر صبركم وتوجيهكم، واستعدادكم لتقديم خصم، مما مكّننا في النهاية من إتمام الصفقة. أتطلع إلى التعامل مع "ذا إنسايت بارتنرز" مستقبلًا، كل ذلك بفضل الانطباع الذي تركتموه لديّ نتيجةً لهذا اللقاء الأول.
الدكتور تشيجيوك أونيا المدير الإداري, شركة باينكريست للرعاية الصحية المحدودةسبب الشراء
- اتخاذ قرارات مدروسة
- فهم ديناميكيات السوق
- تحليل المنافسة
- رؤى العملاء
- توقعات السوق
- تخفيف المخاطر
- التخطيط الاستراتيجي
- مبررات الاستثمار
- تحديد الأسواق الناشئة
- تحسين استراتيجيات التسويق
- تعزيز الكفاءة التشغيلية
- مواكبة التوجهات التنظيمية


 احصل على عينة مجانية ل - سوق أنظمة مراقبة المحولات