استراتيجيات السوق لحلول إدارة السيولة والأصول والخصوم، وأفضل اللاعبين، وفرص النمو، والتحليل والتنبؤ بحلول عام 2028
البيانات التاريخية : | سنة الأساس : | فترة التنبؤ :توقعات سوق حلول إدارة السيولة والأصول والخصوم حتى عام 2028 - تأثير كوفيد-19 والتحليل العالمي - حسب المكونات (الحلول والخدمات) والقطاع (البنوك، والوسطاء، والتمويل المتخصص، ومستشاري الثروات، وغيرها)
- تاريخ التقرير : Apr 2026
- رمز التقرير : TIPRE00017757
- الفئة : التكنولوجيا والإعلام والاتصالات
- الحالة : قادم
- تنسيقات التقارير المتاحة :


- عدد الصفحات : 150
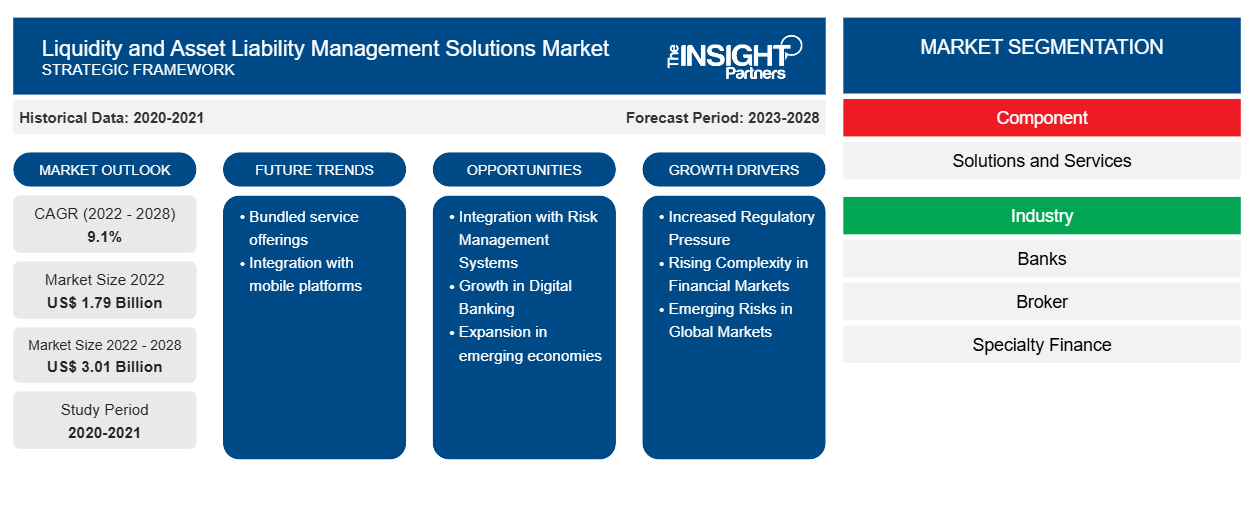
من المتوقع أن ينمو حجم سوق حلول إدارة السيولة والأصول والخصوم من 1،787.59 مليون دولار أمريكي في عام 2022 إلى 3،009.24 مليون دولار أمريكي بحلول عام 2028؛ ومن المتوقع أن ينمو بمعدل نمو سنوي مركب قدره 9.1٪ من عام 2022 إلى عام 2028.
يمكن الإشارة إلى إدارة السيولة باعتبارها عمل المؤسسة لضمان توافر النقد الكافي والأصول السائلة لسداد نفقات المؤسسة وتلبية طلب أي عميل على قرض أو سحب مدخراته. إدارة الأصول والخصوم هي عملية التخطيط والتنظيم والتحكم في أحجام الأصول والخصوم وآجال الاستحقاق والأسعار والعائدات لتقليل مخاطر أسعار الفائدة والحفاظ على مستوى ربحية مقبول. تساعد حلول وخدمات إدارة السيولة والأصول والخصوم المؤسسات على إدارة السيولة والأصول والخصوم بشكل فعال.
إن الصرامة المتزايدة في اللوائح والاهتمام المتزايد بمخاطر أسعار الفائدة قد أجبر المؤسسات المصرفية على البحث عن حلول شاملة لإدارة السيولة والأصول والخصوم. إن مخاطر أسعار الفائدة في دفتر الحسابات المصرفية واختبار الإجهاد من قبل هيئة المصارف الأوروبية في ظل التخطيط للتمويل هي بعض العوامل التي تتطلب من البنوك تقييم الآثار اللاحقة المحتملة لزيادة سعر الفائدة، والتغير في قيم الأصول الحساسة للفائدة، والانخفاض الناتج في رأس المال التنظيمي. بالإضافة إلى ذلك، شهد قطاع الخدمات المالية والمصرفية والتأمين زيادة في اللوائح المتعلقة بإدارة المخاطر. وعلاوة على ذلك، أدت التقلبات المستمرة في أسعار الفائدة في جميع أنحاء الولايات المتحدة والمملكة المتحدة وسويسرا واليابان وغيرها من الدول المصرفية الكبيرة إلى تقليص هوامش قطاع الخدمات المالية والمصرفية والتأمين. وقد عززت هذه العوامل نمو سوق حلول إدارة السيولة والأصول والخصوم العالمية . يمكن لهذه الحلول والخدمات أن تسمح للمؤسسات المالية باتخاذ القرارات بناءً على تحليل السيناريوهات، وتوفير منظور أفضل من كل من وجهات النظر القائمة على المخاطر والتمويل، ومساعدة الشركات بقوة في الامتثال للمتطلبات التنظيمية. لقد دمجت معظم حلول السيولة والأصول والخصوم الحديثة تسعير تحويل الأموال (FTP)، مما يسمح للمستخدمين بالتمييز بين ربحية نشاط وآخر.
استنادًا إلى تقرير سوق حلول إدارة السيولة والأصول والالتزامات، يتم تقسيم سوق حلول إدارة السيولة والأصول والالتزامات إلى مكون وصناعة. بناءً على المكون، يتم تقسيم سوق حلول إدارة السيولة والأصول والالتزامات إلى حلول وخدمات. بناءً على الصناعة، يتم تقسيم سوق حلول إدارة السيولة والأصول والالتزامات إلى بنوك ووسطاء وتمويل متخصص ومستشاري ثروات وغيرها.
قم بتخصيص هذا التقرير ليناسب متطلباتك
ستحصل على تخصيص لأي تقرير - مجانًا - بما في ذلك أجزاء من هذا التقرير، أو تحليل على مستوى الدولة، وحزمة بيانات Excel، بالإضافة إلى الاستفادة من العروض والخصومات الرائعة للشركات الناشئة والجامعات
سوق حلول إدارة السيولة والأصول والخصوم: رؤى استراتيجية
-
احصل على أهم اتجاهات السوق الرئيسية لهذا التقرير.ستتضمن هذه العينة المجانية تحليلاً للبيانات، بدءًا من اتجاهات السوق وحتى التقديرات والتوقعات.
تأثير جائحة كوفيد-19 على حجم سوق حلول إدارة السيولة والأصول والخصوم
مع القيود الاجتماعية التي فرضتها بلدان مختلفة استجابة لظهور جائحة كوفيد-19، لجأ أصحاب المصلحة الرئيسيون في قطاع الخدمات المالية والمصرفية والتأمين - مثل البنوك والوسطاء ومستشاري الثروات - إلى المنصات الرقمية لتلبية احتياجاتهم اليومية. أصبحت المحافظ الرقمية، المعروفة غالبًا باسم المحافظ الإلكترونية، أكثر شعبية في ظل هذه الظروف. ونتيجة لهذا التحول، زادت احتمالية الخسارة الائتمانية والأصول المتعثرة، في حين شهدت البنوك نتائج غير متوقعة لنموذج إدارة الأصول والخصوم. حذرت مجموعة العمل المالي (FATF) البنوك من المعاملات المالية غير القانونية. ونتيجة لذلك، ارتفع الطلب على حلول إدارة السيولة والأصول والخصوم، مما أثر بشكل كبير على نمو سوق حلول إدارة السيولة والأصول والخصوم. وعلاوة على ذلك، نظرًا للاستخدام الواسع النطاق للمنصات الرقمية، يتزايد حجم البيانات على الشبكات، مما يضع ضغوطًا كبيرة على البنوك والمؤسسات المالية للحفاظ على ميزانياتها العمومية في الوقت المناسب. شهدت معظم البنوك الإقليمية والدولية عائدات وهامش قروض أقل بكثير مما كان متوقعًا بسبب إعادة تمويل القروض الأعلى. لقد أدى وباء كوفيد-19 إلى تسريع وتيرة التطورات في التقنيات الرقمية والسيولة الرقمية. وبالتالي، تستخدم البنوك والمؤسسات المالية الآن تقنيات تحليل البيانات لتحسين عمليات إدارة الأصول لديها.
رؤى السوق – تحليل سوق حلول إدارة السيولة والأصول والخصوم
نمو صناعة BNPL
كما تدعم صناعة الشراء الآن والدفع لاحقًا (BNPL) التقدمية نمو سوق حلول إدارة السيولة والأصول والخصوم. تعد إدارة مخاطر الائتمان والمسؤولية الفعالة مفتاح النجاح للاعبين BNPL. بناءً على تقرير صادر عن Apptopia، وصلت عمليات تنزيل تطبيق BNPL إلى 6.8 مليون في نوفمبر 2021، بزيادة قدرها 54٪ عن نوفمبر 2020، وزاد عدد المستخدمين النشطين شهريًا (MAU) بنسبة 63٪ على أساس سنوي. على الرغم من أن الولايات المتحدة تتصدر السباق، إلا أن عدد المستخدمين النشطين في أوروبا نما أيضًا بشكل كبير. بناءً على تقرير صادر عن PayU، حدثت 7.4٪ من إجمالي معاملات التجارة الإلكترونية في أوروبا باستخدام خدمات BNPL في عام 2020، ومن المتوقع أن ينمو عدد المعاملات بنسبة 45٪ على مدى السنوات الخمس المقبلة. وبالتالي، مع انتشار صناعة BNPL عالميًا، إلى جانب التركيز المتزايد على مخاطر المسؤولية من قبل اللاعبين في الصناعة، من المتوقع أن ينمو سوق حلول إدارة السيولة والأصول والخصوم بوتيرة جيدة خلال فترة التنبؤ.
رؤى السوق حول حلول إدارة السيولة والأصول والخصوم القائمة على المكونات
بناءً على المكون، يتم تقسيم سوق حلول إدارة السيولة والأصول والخصوم إلى حلول وخدمات. ومن المتوقع أن يكون قطاع الحلول هو القطاع الأسرع نموًا، ويرجع ذلك في المقام الأول إلى ظهور الحلول التي تعمل بالذكاء الاصطناعي. ومن المتوقع أن ينمو قطاع الخدمات بوتيرة معتدلة خلال فترة التنبؤ.
رؤى السوق حول حلول إدارة السيولة والأصول والالتزامات المستندة إلى المستخدم النهائي
من حيث الصناعة، يتم تقسيم سوق حلول السيولة والأصول والخصوم العالمية إلى البنوك والوسطاء والتمويل المتخصص ومستشاري الثروات وغيرها. ومن المتوقع أن يكون قطاع البنوك هو القطاع الأكبر خلال فترة التوقعات، وذلك بسبب التبني الواسع النطاق لحلول السيولة والأصول والخصوم في جميع أنحاء العالم.
يركز المشاركون في سوق حلول إدارة السيولة والأصول والخصوم بشكل أساسي على تطوير منتجات متقدمة وفعالة. وفيما يلي بعض الأمثلة.
- في يونيو 2022، أعلنت Infosys Finacle، وهي جزء من EdgeVerve Systems - وهي شركة تابعة مملوكة بالكامل لشركة Infosys وSuryoday Small Finance Bank (SSFB) - عن التنفيذ الناجح لمنصة Finacle Core Banking ومنصة Finacle Treasury. ستدعم Finacle محركات التجزئة والشركات والدفع الخاصة بـ SSFB في نموذج محلي مدعوم بمجموعة البنية الأساسية الخاصة بـ IBM.
- في فبراير 2022، استحوذت شركة SAS العملاقة لتحليل البيانات وتكنولوجيا الذكاء الاصطناعي على شركة Kamakura Corp. التي تتخذ من هونولولو مقراً لها، والتي ستوسع نطاقها داخل قطاع الخدمات المالية وتوسع محفظة SAS من برامج إدارة المخاطر المالية. وهي واحدة من الشركات الرائدة في مجال تحليل البيانات وإدارة البيانات.
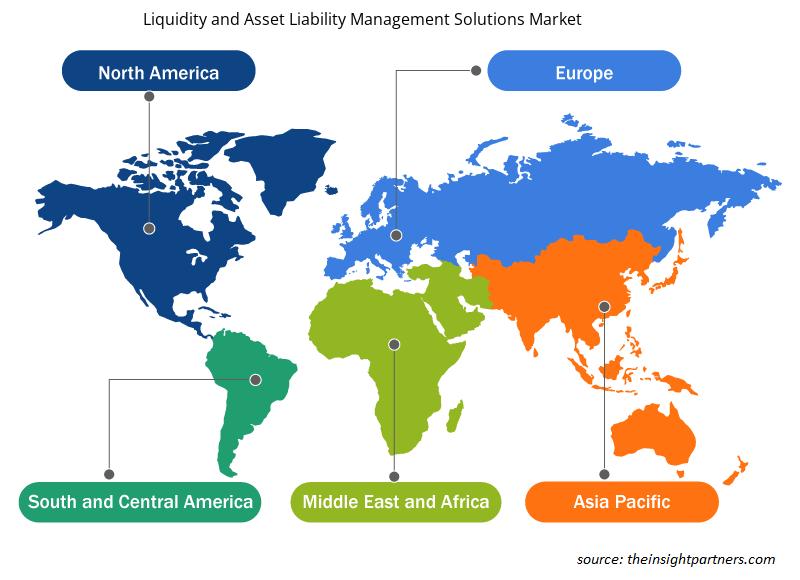
رؤى إقليمية حول سوق حلول إدارة السيولة والأصول والخصوم
لقد قام المحللون في Insight Partners بشرح الاتجاهات والعوامل الإقليمية المؤثرة على سوق حلول إدارة السيولة والأصول والخصوم طوال فترة التوقعات بشكل شامل. يناقش هذا القسم أيضًا قطاعات سوق حلول إدارة السيولة والأصول والخصوم والجغرافيا في جميع أنحاء أمريكا الشمالية وأوروبا ومنطقة آسيا والمحيط الهادئ والشرق الأوسط وأفريقيا وأمريكا الجنوبية والوسطى.
- احصل على البيانات الإقليمية المحددة لسوق حلول إدارة السيولة والأصول والخصوم
نطاق تقرير سوق حلول إدارة السيولة والأصول والخصوم
| سمة التقرير | تفاصيل |
|---|---|
| حجم السوق في عام 2022 | 1.79 مليار دولار أمريكي |
| حجم السوق بحلول عام 2028 | 3.01 مليار دولار أمريكي |
| معدل النمو السنوي المركب العالمي (2022 - 2028) | 9.1% |
| البيانات التاريخية | 2020-2021 |
| فترة التنبؤ | 2023-2028 |
| القطاعات المغطاة |
حسب المكون
|
| المناطق والدول المغطاة |
أمريكا الشمالية
|
| قادة السوق وملفات تعريف الشركات الرئيسية |
|
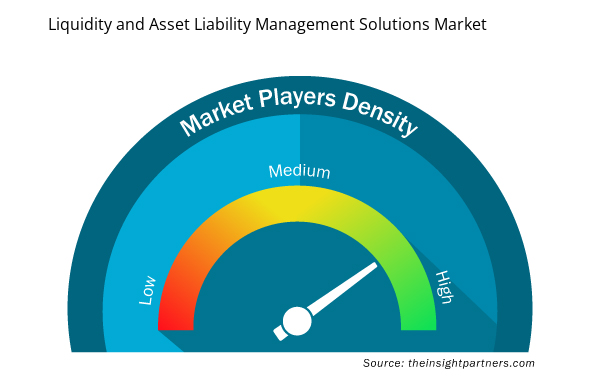
كثافة اللاعبين في السوق: فهم تأثيرها على ديناميكيات الأعمال
يشهد سوق حلول إدارة السيولة والأصول والخصوم نموًا سريعًا، مدفوعًا بالطلب المتزايد من المستخدم النهائي بسبب عوامل مثل تفضيلات المستهلكين المتطورة والتقدم التكنولوجي والوعي المتزايد بفوائد المنتج. ومع ارتفاع الطلب، تعمل الشركات على توسيع عروضها والابتكار لتلبية احتياجات المستهلكين والاستفادة من الاتجاهات الناشئة، مما يؤدي إلى زيادة نمو السوق.
تشير كثافة اللاعبين في السوق إلى توزيع الشركات أو المؤسسات العاملة في سوق أو صناعة معينة. وهي تشير إلى عدد المنافسين (اللاعبين في السوق) الموجودين في مساحة سوق معينة نسبة إلى حجمها أو قيمتها السوقية الإجمالية.
الشركات الرئيسية العاملة في سوق حلول إدارة السيولة والأصول والخصوم هي:
- شركة إكسبيريان لبرمجيات المعلومات
- شركة فيديليتي لخدمات المعلومات الوطنية
- شركة فيناسترا الدولية المحدودة
- شركة آي بي إم
- انفوسيس المحدودة
إخلاء المسؤولية : الشركات المذكورة أعلاه ليست مرتبة بأي ترتيب معين.
- احصل على نظرة عامة على أهم اللاعبين الرئيسيين في سوق حلول إدارة السيولة والأصول والخصوم
نبذة عن الشركة: سوق حلول إدارة السيولة والأصول والخصوم
- شركة إكسبيريان لبرمجيات المعلومات
- شركة فيديليتي لخدمات المعلومات الوطنية
- شركة فيناسترا الدولية المحدودة
- شركة آي بي إم
- انفوسيس المحدودة
- شركة انتليكت ديزاين ارينا المحدودة
- شركة موديز
- شركة أوراكل
- ساب اس اي
- وولترز كلوير نيفادا

أنكيتا خبيرة ديناميكية في أبحاث السوق والاستشارات، تتمتع بخبرة تزيد عن 8 سنوات في قطاعات التكنولوجيا والإعلام وتكنولوجيا المعلومات والاتصالات والإلكترونيات وأشباه الموصلات. وقد قادت ونفذت بنجاح أكثر من 100 مهمة استشارية وبحثية لعملاء عالميين مثل مايكروسوفت وأوراكل وشركة NEC وSAP وKPMG وExpeditors International. تشمل كفاءاتها الأساسية تقييم السوق، وتحليل البيانات، والتنبؤ، وصياغة الاستراتيجيات، والاستخبارات التنافسية، وكتابة التقارير.
أنكيتا بارعة في إدارة دورات المشاريع الكاملة، بدءًا من تصميم عروض ما قبل البيع ومناقشات العملاء، وصولًا إلى تقديم رؤى عملية بعد البيع. كما أنها ماهرة في إدارة فرق متعددة الوظائف، وهيكلة وحدات بحثية معقدة، ومواءمة الحلول مع أهداف العمل الخاصة بالعملاء. وقد مكنتها مهاراتها الممتازة في التواصل والقيادة والعرض التقديمي من تحقيق نتائج قيّمة باستمرار في بيئات سوقية سريعة التطور.
- التحليل التاريخي (سنتان)، سنة الأساس، التوقعات (7 سنوات) مع معدل النمو السنوي المركب
- تحليل PEST و SWOT
- حجم السوق والقيمة / الحجم - عالمي، إقليمي، بلد
- الصناعة والمنافسة
- مجموعة بيانات إكسل
التقارير الحديثة
شهادات العملاء
تقرير سوق أنظمة SCADA من Insight Partners شامل، ويقدم رؤى قيّمة حول الاتجاهات الحالية والتوقعات المستقبلية. تميّز الفريق باحترافية عالية وسرعة في الاستجابة ودعم مستمر طوال الوقت. نحن راضون جدًا ونوصي بشدة بخدماتهم.
ران كيديم شريك, شركة ريالي تكنولوجيز المحدودةطلبتُ تقريرًا عن سوق برمجيات محدد، وأعدّه الفريق في غضون أيام قليلة. كانت المعلومات ذات صلة وثيقة وعرضها جيد. ثم طلبتُ بعض التعديلات والإضافات على التقرير. وكان الفريق متجاوبًا للغاية، وحصلتُ على التقرير النهائي في أقل من أسبوع.
جان هيرفيه جين رئيس مجلس الإدارة, فيوتشر أناليتيكاعملنا مع شركة "إنسايت بارتنرز" لإجراء دراسة سوقية وتوقعات مهمة. زودونا برؤى واضحة حول الفرص والمخاطر، مما ساعدنا في صياغة خططنا. كانت أبحاثهم سهلة الاستخدام ومبنية على بيانات دقيقة، مما ساعدنا على اتخاذ قرارات ذكية وواثقة. نوصي بهم بشدة.
بيوش ناجبال نائب الرئيس الأول, شعاع عالي عالميقدّمت شركة Insight Partners أبحاثًا سوقية ثاقبة ومنظمة جيدًا بخبرة واسعة في هذا المجال. تميّز فريقهم بالاحترافية وسرعة الاستجابة طوال الوقت. وسهّل موقعهم الإلكتروني سهل الاستخدام الوصول إلى تقارير القطاع. نوصي بهم بشدة لخدمات بحثية موثوقة وعالية الجودة.
يوكيهيكو أداتشي المدير التنفيذي, ديب بلو، ذ.م.م.هذه أول مرة أشتري فيها تقرير سوق من The Insight Partners. رغم أنني كنت مترددًا في البداية، إلا أنني زرت موقعهم الإلكتروني وشعرت براحة أكبر للمخاطرة وشراء تقرير السوق. أنا راضٍ تمامًا عن جودة التقرير وخدمة العملاء. كانت لديّ عدة أسئلة وتعليقات حول التقرير الأولي، ولكن بعد بضع محادثات عبر البريد الإلكتروني مع محللهم، أعتقد أن لديّ تقريرًا يمكنني استخدامه كمدخل لعملية التخطيط الاستراتيجي لدينا. شكرًا جزيلاً لكم على تخصيص وقتكم الإضافي وجعل هذه التجربة إيجابية. سأوصي بخدماتكم للآخرين بالتأكيد، وستكونون أول من ألجأ إليه عندما نحتاج إلى المزيد من بيانات السوق.
جون سوزوكي الرئيس والرئيس التنفيذي وعضو مجلس الإدارة, بي كيه تكنولوجيزأود أن أقدّر دعمكم واحترافيتكم في الاستجابة لطلبي للحصول على معلومات بشأن سوق التشخيص المخبري للأمراض المعدية في نيجيريا. كما أُقدّر صبركم وتوجيهكم، واستعدادكم لتقديم خصم، مما مكّننا في النهاية من إتمام الصفقة. أتطلع إلى التعامل مع "ذا إنسايت بارتنرز" مستقبلًا، كل ذلك بفضل الانطباع الذي تركتموه لديّ نتيجةً لهذا اللقاء الأول.
الدكتور تشيجيوك أونيا المدير الإداري, شركة باينكريست للرعاية الصحية المحدودةسبب الشراء
- اتخاذ قرارات مدروسة
- فهم ديناميكيات السوق
- تحليل المنافسة
- رؤى العملاء
- توقعات السوق
- تخفيف المخاطر
- التخطيط الاستراتيجي
- مبررات الاستثمار
- تحديد الأسواق الناشئة
- تحسين استراتيجيات التسويق
- تعزيز الكفاءة التشغيلية
- مواكبة التوجهات التنظيمية


 احصل على عينة مجانية ل - سوق حلول إدارة السيولة والأصول والخصوم