نظرة عامة على سوق اتصالات المرافق والنمو والاتجاهات والتحليل والتقرير البحثي (2023-2031)
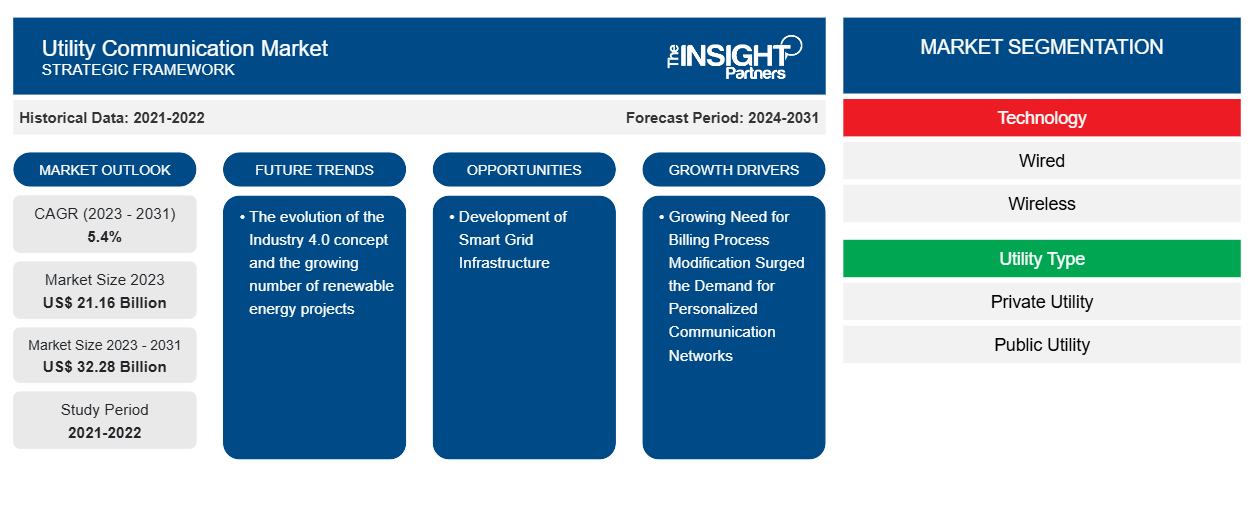
البيانات التاريخية : 2021-2022 | سنة الأساس : 2023 | فترة التنبؤ : 2024-2031حجم سوق اتصالات المرافق وتوقعاته (2021-2031) تحليل الحصة العالمية والإقليمية، والاتجاهات، وفرص النمو. يغطي التقرير: التكنولوجيا [السلكية (الألياف الضوئية، وناقلات خطوط الطاقة (PLC)، والإيثرنت، وأنواع أخرى من التقنيات) واللاسلكية]؛ نوع المرافق (مرافق خاصة وعامة)؛ والموقع الجغرافي.
- تاريخ التقرير : Mar 2026
- رمز التقرير : TIPRE00009082
- الفئة : الإلكترونيات وأشباه الموصلات
- الحالة : البيانات الصادرة
- تنسيقات التقارير المتاحة :


- عدد الصفحات : 150
من المتوقع أن يصل حجم سوق اتصالات المرافق إلى 32.28 مليار دولار أمريكي بحلول عام 2031 من 21.16 مليار دولار أمريكي في عام 2023. ومن المتوقع أن يسجل السوق معدل نمو سنوي مركب بنسبة 5.4٪ في الفترة 2023-2031. ومن المرجح أن يظل تطور مفهوم الصناعة 4.0 والعدد المتزايد من مشاريع الطاقة المتجددة من الاتجاهات الرئيسية لسوق اتصالات المرافق.
تحليل سوق الاتصالات الخدمية
ينمو سوق الاتصالات الخدمية بوتيرة سريعة بسبب الحاجة المتزايدة لتعديل عملية الفوترة، مما أدى إلى زيادة الطلب على شبكات الاتصالات المخصصة والطلب المتزايد على موارد الطاقة الموزعة. يتوسع السوق بشكل مطرد، مدفوعًا بالمبادرات الحكومية المواتية والاستثمارات لتعزيز تطوير البنية التحتية للطاقة. علاوة على ذلك، فإن تطوير البنية التحتية للشبكة الذكية والاعتماد المتزايد على الأنظمة المتقدمة تقنيًا والمتكاملة مع إنترنت الأشياء والذكاء الاصطناعي يوفر فرصًا مربحة لنمو السوق.
نظرة عامة على سوق الاتصالات الخدمية
اتصالات المرافق هي أنظمة تضمن نقلًا أكثر موثوقية وأمانًا وأمانًا للبيانات والفيديو والصوت عبر شبكات WAN وLAN. يوفر نظام الاتصالات هذا للمستخدمين فوائد التثبيت السهل في المواقع الخطرة. يعمل نظام اتصالات المرافق باستخدام شبكات عديدة، بما في ذلك مراقبة الفيديو والشبكة الذكية ونظام التحكم الإشرافي واكتساب البيانات (SADA) والاتصال القائم على إيثرنت. علاوة على ذلك، فإن الطلب المتزايد على أنظمة الاتصالات السلكية واللاسلكية من قبل المرافق لمراقبة استهلاك الطاقة وتوزيعها يعزز السوق خلال فترة التنبؤ.
قم بتخصيص هذا التقرير ليناسب متطلباتك
ستحصل على تخصيص لأي تقرير - مجانًا - بما في ذلك أجزاء من هذا التقرير، أو تحليل على مستوى الدولة، وحزمة بيانات Excel، بالإضافة إلى الاستفادة من العروض والخصومات الرائعة للشركات الناشئة والجامعات
سوق الاتصالات الخدمية: رؤى استراتيجية
-
احصل على أهم اتجاهات السوق الرئيسية لهذا التقرير.ستتضمن هذه العينة المجانية تحليلاً للبيانات، بدءًا من اتجاهات السوق وحتى التقديرات والتوقعات.
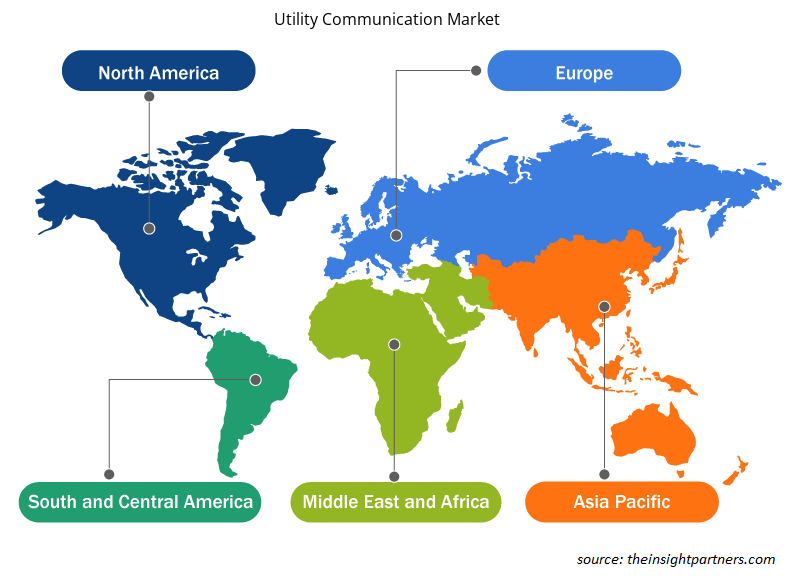
رؤى إقليمية حول سوق الاتصالات الخدمية
لقد قام المحللون في Insight Partners بشرح الاتجاهات والعوامل الإقليمية المؤثرة على سوق اتصالات المرافق طوال فترة التوقعات بشكل شامل. يناقش هذا القسم أيضًا قطاعات سوق اتصالات المرافق والجغرافيا في جميع أنحاء أمريكا الشمالية وأوروبا ومنطقة آسيا والمحيط الهادئ والشرق الأوسط وأفريقيا وأمريكا الجنوبية والوسطى.
- احصل على البيانات الإقليمية المحددة لسوق الاتصالات الخدمية
نطاق تقرير سوق الاتصالات الخدمية
| سمة التقرير | تفاصيل |
|---|---|
| حجم السوق في عام 2023 | 21.16 مليار دولار أمريكي |
| حجم السوق بحلول عام 2031 | 32.28 مليار دولار أمريكي |
| معدل النمو السنوي المركب العالمي (2023 - 2031) | 5.4% |
| البيانات التاريخية | 2021-2022 |
| فترة التنبؤ | 2024-2031 |
| القطاعات المغطاة |
حسب التكنولوجيا
|
| المناطق والدول المغطاة |
أمريكا الشمالية
|
| قادة السوق وملفات تعريف الشركات الرئيسية |
|
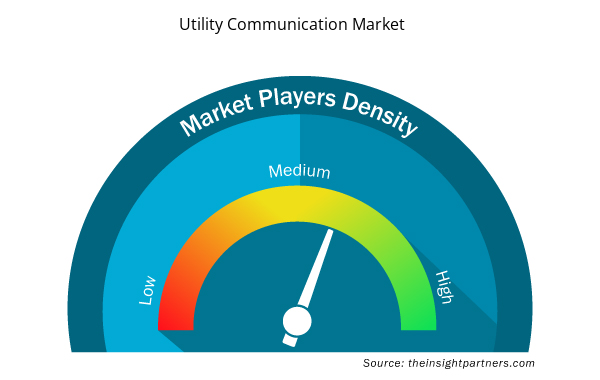
كثافة اللاعبين في السوق: فهم تأثيرها على ديناميكيات الأعمال
يشهد سوق الاتصالات الخدمية نموًا سريعًا، مدفوعًا بالطلب المتزايد من المستخدم النهائي بسبب عوامل مثل تفضيلات المستهلكين المتطورة والتقدم التكنولوجي والوعي المتزايد بفوائد المنتج. ومع ارتفاع الطلب، تعمل الشركات على توسيع عروضها والابتكار لتلبية احتياجات المستهلكين والاستفادة من الاتجاهات الناشئة، مما يؤدي إلى زيادة نمو السوق.
تشير كثافة اللاعبين في السوق إلى توزيع الشركات أو المؤسسات العاملة في سوق أو صناعة معينة. وهي تشير إلى عدد المنافسين (اللاعبين في السوق) الموجودين في مساحة سوق معينة نسبة إلى حجمها أو قيمتها السوقية الإجمالية.
الشركات الرئيسية العاملة في سوق الاتصالات الخدمية هي:
- شركة أيه بي بي المحدودة
- فوجيتسو المحدودة
- شركة جنرال الكتريك
- شركة هونيويل الدولية
- شركة أوميكرون للإلكترونيات المحدودة
- روكويل أوتوميشن
إخلاء المسؤولية : الشركات المذكورة أعلاه ليست مرتبة بأي ترتيب معين.
- احصل على نظرة عامة على أهم اللاعبين الرئيسيين في سوق الاتصالات الخدمية

نافين خبيرٌ متمرسٌ في أبحاث السوق والاستشارات، يتمتع بخبرةٍ تزيد عن 9 سنوات في مشاريع مُخصصة ومُشتركة واستشارية. يشغل حاليًا منصب نائب الرئيس المساعد، وقد نجح في إدارة أصحاب المصلحة عبر سلسلة قيمة المشاريع، وألّف أكثر من 100 تقرير بحثي وأكثر من 30 مهمة استشارية. يمتد نطاق عمله ليشمل مشاريع صناعية وحكومية، مساهمًا بشكل كبير في نجاح العملاء واتخاذ القرارات القائمة على البيانات.
نافين حاصلٌ على شهادة في هندسة الإلكترونيات والاتصالات من جامعة فرجينيا التقنية، كارناتاكا، وشهادة ماجستير في إدارة الأعمال في التسويق والعمليات من جامعة مانيبال. وهو عضوٌ نشطٌ في معهد مهندسي الكهرباء والإلكترونيات (IEEE) لمدة 9 سنوات، حيث شارك في مؤتمراتٍ وندواتٍ تقنية، وتطوّع على مستوى الأقسام والمناطق. قبل منصبه الحالي، عمل مستشارًا استراتيجيًا مساعدًا في IndustryARC، ومستشارًا للخوادم الصناعية في شركة هيوليت باكارد (HP Global).
- التحليل التاريخي (سنتان)، سنة الأساس، التوقعات (7 سنوات) مع معدل النمو السنوي المركب
- تحليل PEST و SWOT
- حجم السوق والقيمة / الحجم - عالمي، إقليمي، بلد
- الصناعة والمنافسة
- مجموعة بيانات إكسل
التقارير الحديثة
شهادات العملاء
تقرير سوق أنظمة SCADA من Insight Partners شامل، ويقدم رؤى قيّمة حول الاتجاهات الحالية والتوقعات المستقبلية. تميّز الفريق باحترافية عالية وسرعة في الاستجابة ودعم مستمر طوال الوقت. نحن راضون جدًا ونوصي بشدة بخدماتهم.
ران كيديم شريك, شركة ريالي تكنولوجيز المحدودةطلبتُ تقريرًا عن سوق برمجيات محدد، وأعدّه الفريق في غضون أيام قليلة. كانت المعلومات ذات صلة وثيقة وعرضها جيد. ثم طلبتُ بعض التعديلات والإضافات على التقرير. وكان الفريق متجاوبًا للغاية، وحصلتُ على التقرير النهائي في أقل من أسبوع.
جان هيرفيه جين رئيس مجلس الإدارة, فيوتشر أناليتيكاعملنا مع شركة "إنسايت بارتنرز" لإجراء دراسة سوقية وتوقعات مهمة. زودونا برؤى واضحة حول الفرص والمخاطر، مما ساعدنا في صياغة خططنا. كانت أبحاثهم سهلة الاستخدام ومبنية على بيانات دقيقة، مما ساعدنا على اتخاذ قرارات ذكية وواثقة. نوصي بهم بشدة.
بيوش ناجبال نائب الرئيس الأول, شعاع عالي عالميقدّمت شركة Insight Partners أبحاثًا سوقية ثاقبة ومنظمة جيدًا بخبرة واسعة في هذا المجال. تميّز فريقهم بالاحترافية وسرعة الاستجابة طوال الوقت. وسهّل موقعهم الإلكتروني سهل الاستخدام الوصول إلى تقارير القطاع. نوصي بهم بشدة لخدمات بحثية موثوقة وعالية الجودة.
يوكيهيكو أداتشي المدير التنفيذي, ديب بلو، ذ.م.م.هذه أول مرة أشتري فيها تقرير سوق من The Insight Partners. رغم أنني كنت مترددًا في البداية، إلا أنني زرت موقعهم الإلكتروني وشعرت براحة أكبر للمخاطرة وشراء تقرير السوق. أنا راضٍ تمامًا عن جودة التقرير وخدمة العملاء. كانت لديّ عدة أسئلة وتعليقات حول التقرير الأولي، ولكن بعد بضع محادثات عبر البريد الإلكتروني مع محللهم، أعتقد أن لديّ تقريرًا يمكنني استخدامه كمدخل لعملية التخطيط الاستراتيجي لدينا. شكرًا جزيلاً لكم على تخصيص وقتكم الإضافي وجعل هذه التجربة إيجابية. سأوصي بخدماتكم للآخرين بالتأكيد، وستكونون أول من ألجأ إليه عندما نحتاج إلى المزيد من بيانات السوق.
جون سوزوكي الرئيس والرئيس التنفيذي وعضو مجلس الإدارة, بي كيه تكنولوجيزأود أن أقدّر دعمكم واحترافيتكم في الاستجابة لطلبي للحصول على معلومات بشأن سوق التشخيص المخبري للأمراض المعدية في نيجيريا. كما أُقدّر صبركم وتوجيهكم، واستعدادكم لتقديم خصم، مما مكّننا في النهاية من إتمام الصفقة. أتطلع إلى التعامل مع "ذا إنسايت بارتنرز" مستقبلًا، كل ذلك بفضل الانطباع الذي تركتموه لديّ نتيجةً لهذا اللقاء الأول.
الدكتور تشيجيوك أونيا المدير الإداري, شركة باينكريست للرعاية الصحية المحدودةسبب الشراء
- اتخاذ قرارات مدروسة
- فهم ديناميكيات السوق
- تحليل المنافسة
- رؤى العملاء
- توقعات السوق
- تخفيف المخاطر
- التخطيط الاستراتيجي
- مبررات الاستثمار
- تحديد الأسواق الناشئة
- تحسين استراتيجيات التسويق
- تعزيز الكفاءة التشغيلية
- مواكبة التوجهات التنظيمية


 احصل على عينة مجانية ل - سوق اتصالات المرافق