نمو سوق برمجيات مختبر تكنولوجيا المعلومات الافتراضي وحجمه ومشاركته واتجاهاته وتحليل اللاعبين الرئيسيين والتوقعات حتى عام 2031
البيانات التاريخية : 2021-2022 | سنة الأساس : 2023 | فترة التنبؤ : 2024-2031حجم سوق برمجيات مختبرات تكنولوجيا المعلومات الافتراضية وتوقعاته (2021-2031)، والحصة العالمية والإقليمية، والاتجاهات، وفرص النمو. يغطي التقرير: التطبيق (التغليف والملصقات، والرسومات اللمسية، والتوثيق الآمن)، والمستخدم النهائي (مستخدمو برايل، والقطاعات الصناعية والحكومية والدفاعية)، والجغرافيا.
- تاريخ التقرير : Mar 2026
- رمز التقرير : TIPRE00012397
- الفئة : التكنولوجيا والإعلام والاتصالات
- الحالة : البيانات الصادرة
- تنسيقات التقارير المتاحة :


- عدد الصفحات : 150
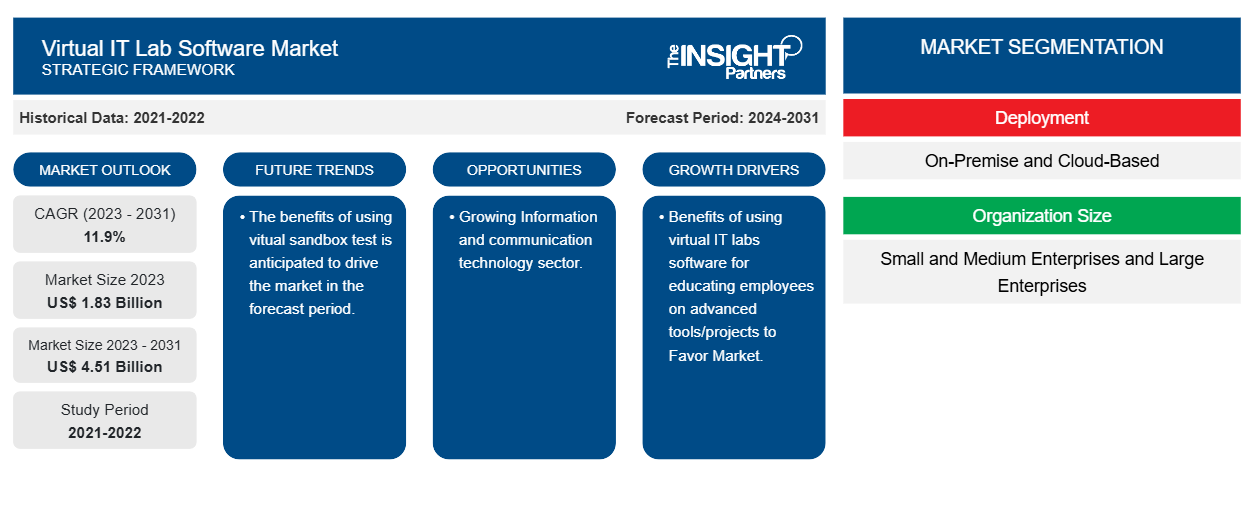
من المتوقع أن يصل حجم سوق برامج مختبرات تكنولوجيا المعلومات الافتراضية إلى 4.51 مليار دولار أمريكي بحلول عام 2031 من 1.83 مليار دولار أمريكي في عام 2023. ومن المتوقع أن يسجل السوق معدل نمو سنوي مركب بنسبة 11.9٪ خلال الفترة 2023-2031. ومن المرجح أن تظل الفوائد المتزايدة لاستخدام برامج مختبرات تكنولوجيا المعلومات الافتراضية لتثقيف الموظفين حول الأدوات / المشاريع المتقدمة والاستخدام المتزايد للبرامج المستندة إلى السحابة من الاتجاهات والدوافع الرئيسية في السوق.
تحليل سوق برامج المختبر الافتراضي لتكنولوجيا المعلومات
يشهد سوق برمجيات المختبرات الافتراضية لتكنولوجيا المعلومات نموًا كبيرًا على مستوى العالم. ويعزى هذا النمو إلى الفوائد المتزايدة لاستخدام برمجيات المختبرات الافتراضية لتكنولوجيا المعلومات لتثقيف الموظفين حول الأدوات/المشاريع المتقدمة والاستخدام المتزايد للبرمجيات المستندة إلى السحابة. وعلاوة على ذلك، من المتوقع أن يؤدي الإنفاق المتزايد على قطاع تكنولوجيا المعلومات والاتصالات وفوائد استخدام اختبارات البيئة الافتراضية إلى دفع سوق برمجيات المختبرات الافتراضية لتكنولوجيا المعلومات في السنوات القادمة.
نظرة عامة على سوق برامج المختبر الافتراضي لتكنولوجيا المعلومات
يعد برنامج المختبر الافتراضي لتكنولوجيا المعلومات وسيلة لمحترفي تكنولوجيا المعلومات لممارسة وتعزيز مهاراتهم في بيئة آمنة ومأمونة. فهو يتيح للمستخدمين إنشاء بيئات افتراضية لتطوير واختبار الخدمات أو الأنظمة أو التطبيقات. وهو يوفر بيئة معزولة لإجراء الاختبارات دون تغيير بيئة الإنتاج. ويستخدم محترفو تكنولوجيا المعلومات المختبرات الافتراضية لمحاكاة السيناريوهات في العالم الحقيقي، واستكشاف المشكلات وإصلاحها، وتدريب الموظفين الجدد على التقنيات المعقدة.
قم بتخصيص هذا التقرير ليناسب متطلباتك
ستحصل على تخصيص لأي تقرير - مجانًا - بما في ذلك أجزاء من هذا التقرير، أو تحليل على مستوى الدولة، وحزمة بيانات Excel، بالإضافة إلى الاستفادة من العروض والخصومات الرائعة للشركات الناشئة والجامعات
سوق برمجيات المختبرات الافتراضية لتكنولوجيا المعلومات: رؤى استراتيجية
-
احصل على أهم اتجاهات السوق الرئيسية لهذا التقرير.ستتضمن هذه العينة المجانية تحليلاً للبيانات، بدءًا من اتجاهات السوق وحتى التقديرات والتوقعات.
محركات وفرص سوق برمجيات المختبرات الافتراضية لتكنولوجيا المعلومات
فوائد استخدام برنامج مختبرات تكنولوجيا المعلومات الافتراضية لتثقيف الموظفين حول الأدوات/المشاريع المتقدمة لصالح السوق.
تزداد شعبية المختبرات الافتراضية لتكنولوجيا المعلومات كوسيلة لتدريب الموظفين عن بعد. فهي توفر بيئة قائمة على السحابة حيث يمكن للموظفين الوصول إلى أنظمة الأجهزة والبرامج والبحث فيها دون الحاجة إلى معدات مادية. فوائد استخدام برامج المختبرات الافتراضية لتكنولوجيا المعلومات لتثقيف الموظفين حول الأدوات/المشاريع المتقدمة لصالح السوق. أصبح العمل عن بعد أكثر شيوعًا؛ تواجه المنظمات تحديات التخطيط للتدريب الفعال لموظفيها حتى عندما يكونون منتشرين جغرافيًا. المختبرات الافتراضية لتكنولوجيا المعلومات هي حل واحد يمكن أن يساعد المنظمات في التغلب على هذا التحدي.
قطاع تكنولوجيا المعلومات والاتصالات المتنامي.
من المتوقع أن يوفر قطاع تكنولوجيا المعلومات والاتصالات المتنامي فرصًا متنوعة لسوق برامج مختبرات تكنولوجيا المعلومات الافتراضية. ومع نمو قطاع تكنولوجيا المعلومات والاتصالات، هناك حاجة مستمرة لموظفي تكنولوجيا المعلومات المهرة. وهذا يخلق طلبًا على حلول مرنة لبرامج التدريب ورفع المهارات. ولتحقيق هذه الغاية، يتم استخدام برامج مختبرات تكنولوجيا المعلومات الافتراضية. تقدم مختبرات تكنولوجيا المعلومات الافتراضية تجارب تعليمية تفاعلية. وبالتالي، بالنظر إلى المعايير المذكورة أعلاه، فإن قطاعات تكنولوجيا المعلومات والاتصالات المتنامية تحمل العديد من الفرص للسوق.
تقرير تحليل تجزئة سوق برامج المختبر الافتراضي لتكنولوجيا المعلومات
كانت القطاعات الرئيسية التي ساهمت في اشتقاق تحليل سوق برمجيات مختبر تكنولوجيا المعلومات الافتراضي هي النشر وحجم المنظمة.
- بناءً على النشر، ينقسم سوق برامج مختبرات تكنولوجيا المعلومات الافتراضية إلى برامج محلية وأخرى قائمة على السحابة. ومن المتوقع أن يستحوذ قطاع البرامج المحلية على حصة سوقية كبيرة خلال فترة التوقعات.
- بناءً على حجم المنظمة، يتم تقسيم سوق برامج مختبرات تكنولوجيا المعلومات الافتراضية إلى شركات صغيرة ومتوسطة الحجم وشركات كبيرة. ومن المتوقع أن تحظى شريحة الشركات الصغيرة والمتوسطة بحصة سوقية كبيرة خلال فترة التوقعات.
تحليل حصة سوق برامج المختبرات الافتراضية لتكنولوجيا المعلومات حسب المنطقة الجغرافية
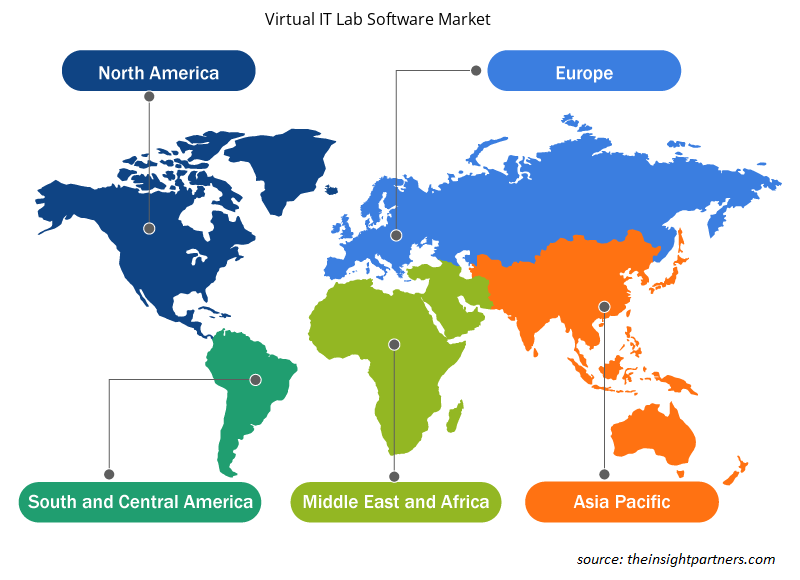
ينقسم النطاق الجغرافي لتقرير سوق برمجيات المختبر الافتراضي لتكنولوجيا المعلومات بشكل أساسي إلى خمس مناطق: أمريكا الشمالية، وآسيا والمحيط الهادئ، وأوروبا، والشرق الأوسط وأفريقيا، وأمريكا الجنوبية والوسطى.
لقد سيطرت أمريكا الشمالية على سوق برمجيات المختبرات الافتراضية لتكنولوجيا المعلومات. وقد أدت اتجاهات تبني التكنولوجيا العالية في مختلف الصناعات في منطقة أمريكا الشمالية إلى تغذية نمو سوق برمجيات المختبرات الافتراضية لتكنولوجيا المعلومات. ومن المتوقع أن تؤدي عوامل مثل زيادة تبني الأدوات الرقمية والإنفاق التكنولوجي المرتفع من قبل الوكالات الحكومية إلى دفع نمو سوق برمجيات المختبرات الافتراضية لتكنولوجيا المعلومات في أمريكا الشمالية. وعلاوة على ذلك، فإن التركيز القوي على البحث والتطوير في الاقتصادات المتقدمة في الولايات المتحدة وكندا يجبر اللاعبين في أمريكا الشمالية على جلب حلول متقدمة تقنيًا إلى السوق. بالإضافة إلى ذلك، يوجد في الولايات المتحدة عدد كبير من اللاعبين في سوق برمجيات المختبرات الافتراضية لتكنولوجيا المعلومات الذين يركزون بشكل متزايد على تطوير حلول مبتكرة. وتساهم كل هذه العوامل في نمو سوق برمجيات المختبرات الافتراضية لتكنولوجيا المعلومات في المنطقة.
رؤى إقليمية حول سوق برمجيات المختبر الافتراضي لتكنولوجيا المعلومات
لقد قام المحللون في Insight Partners بشرح الاتجاهات والعوامل الإقليمية المؤثرة على سوق برمجيات المختبر الافتراضي لتكنولوجيا المعلومات طوال فترة التوقعات بشكل شامل. يناقش هذا القسم أيضًا قطاعات سوق برمجيات المختبر الافتراضي لتكنولوجيا المعلومات والجغرافيا في جميع أنحاء أمريكا الشمالية وأوروبا ومنطقة آسيا والمحيط الهادئ والشرق الأوسط وأفريقيا وأمريكا الجنوبية والوسطى.
- احصل على البيانات الإقليمية المحددة لسوق برامج المختبر الافتراضي لتكنولوجيا المعلومات
نطاق تقرير سوق برامج المختبر الافتراضي لتكنولوجيا المعلومات
| سمة التقرير | تفاصيل |
|---|---|
| حجم السوق في عام 2023 | 1.83 مليار دولار أمريكي |
| حجم السوق بحلول عام 2031 | 4.51 مليار دولار أمريكي |
| معدل النمو السنوي المركب العالمي (2023 - 2031) | 11.9% |
| البيانات التاريخية | 2021-2022 |
| فترة التنبؤ | 2024-2031 |
| القطاعات المغطاة |
حسب النشر
|
| المناطق والدول المغطاة |
أمريكا الشمالية
|
| قادة السوق وملفات تعريف الشركات الرئيسية |
|
كثافة اللاعبين في سوق برمجيات المختبرات الافتراضية لتكنولوجيا المعلومات: فهم تأثيرها على ديناميكيات الأعمال
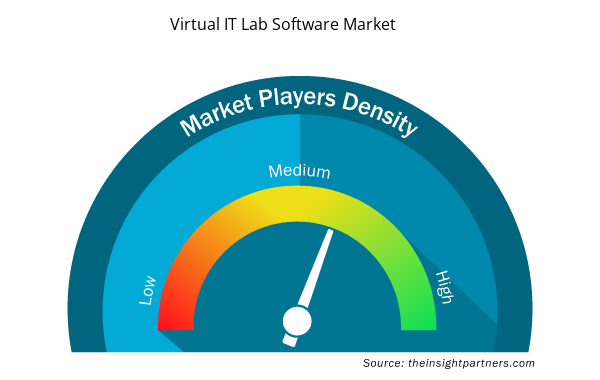
يشهد سوق برمجيات مختبرات تكنولوجيا المعلومات الافتراضية نموًا سريعًا، مدفوعًا بالطلب المتزايد من المستخدم النهائي بسبب عوامل مثل تفضيلات المستهلكين المتطورة والتقدم التكنولوجي والوعي المتزايد بفوائد المنتج. ومع ارتفاع الطلب، تعمل الشركات على توسيع عروضها والابتكار لتلبية احتياجات المستهلكين والاستفادة من الاتجاهات الناشئة، مما يؤدي إلى زيادة نمو السوق.
تشير كثافة اللاعبين في السوق إلى توزيع الشركات أو المؤسسات العاملة في سوق أو صناعة معينة. وهي تشير إلى عدد المنافسين (اللاعبين في السوق) الموجودين في مساحة سوق معينة نسبة إلى حجمها أو قيمتها السوقية الإجمالية.
الشركات الرئيسية العاملة في سوق برمجيات مختبر تكنولوجيا المعلومات الافتراضي هي:
- شركة أوراكل
- خدمات الويب من أمازون
- شركة كلاود شير
- شركة مايكروسوفت
- مُجمِّع التطبيقات
- قطع صغيرة من العلاج السلوكي المعرفي
إخلاء المسؤولية : الشركات المذكورة أعلاه ليست مرتبة بأي ترتيب معين.
- احصل على نظرة عامة على أهم اللاعبين الرئيسيين في سوق برمجيات مختبرات تكنولوجيا المعلومات الافتراضية
أخبار سوق برامج المختبر الافتراضي لتكنولوجيا المعلومات والتطورات الأخيرة
يتم تقييم سوق برامج المختبر الافتراضي لتكنولوجيا المعلومات من خلال جمع البيانات النوعية والكمية بعد البحث الأولي والثانوي، والتي تتضمن منشورات الشركات المهمة وبيانات الجمعيات وقواعد البيانات. فيما يلي بعض التطورات في سوق برامج المختبر الافتراضي لتكنولوجيا المعلومات:
- أعلنت شركة التجارب عالية الإنتاجية عن إطلاق مختبرها الافتراضي الجديد للبحث والتطوير في مجال التحفيز والمواد. توفر المنصة طريقة جديدة لتجربة حلول اختبار معملية مختلفة وتدفقات عمل رقمية مع عرض إمكانيات الاختبار لتطبيقات مختلفة في صناعات الطاقة والتكرير والمواد الكيميائية والبطاريات. (المصدر: hte، موقع الشركة على الويب، يونيو 2023)
- أقامت شركة SoftwareONE وCloudSwyft شراكة لتوفير مختبرات افتراضية قابلة للتطوير قائمة على السحابة للجامعات والكليات المهنية والمدارس الابتدائية والثانوية والحكومات في أكثر من 100 دولة. ومع تزايد الضغوط على المؤسسات التعليمية لدعم التعلم الهجين مع تحقيق الكفاءة في التكلفة والتشغيل، أصبحت عملية تحويل البنية الأساسية لتكنولوجيا المعلومات في الحرم الجامعي إلى افتراضية أولوية قصوى في جميع الأسواق الرئيسية.
(المصدر: SoftwareONE، موقع الشركة الإلكتروني، سبتمبر 2022)
تقرير سوق برامج المختبر الافتراضي لتكنولوجيا المعلومات والتغطية والنتائج المتوقعة
يوفر تقرير "حجم سوق برمجيات المختبر الافتراضي لتكنولوجيا المعلومات والتوقعات (2021-2031)" تحليلاً مفصلاً للسوق يغطي المجالات التالية:
- حجم سوق برامج المختبر الافتراضي لتكنولوجيا المعلومات وتوقعاته على المستويات العالمية والإقليمية والوطنية لجميع قطاعات السوق الرئيسية التي يغطيها النطاق
- اتجاهات سوق برامج المختبر الافتراضي لتكنولوجيا المعلومات بالإضافة إلى ديناميكيات السوق مثل المحركات والقيود والفرص الرئيسية
- تحليل مفصل لقوى PEST/Porter الخمس وSWOT
- تحليل سوق برامج المختبر الافتراضي لتكنولوجيا المعلومات يغطي اتجاهات السوق الرئيسية والإطار العالمي والإقليمي والجهات الفاعلة الرئيسية واللوائح والتطورات الأخيرة في السوق
- تحليل المشهد الصناعي والمنافسة الذي يغطي تركيز السوق، وتحليل خريطة الحرارة، واللاعبين البارزين، والتطورات الأخيرةسوق برامج المختبرات الافتراضية لتكنولوجيا المعلومات ملفات تعريف الشركة التفصيلية.

أنكيتا خبيرة ديناميكية في أبحاث السوق والاستشارات، تتمتع بخبرة تزيد عن 8 سنوات في قطاعات التكنولوجيا والإعلام وتكنولوجيا المعلومات والاتصالات والإلكترونيات وأشباه الموصلات. وقد قادت ونفذت بنجاح أكثر من 100 مهمة استشارية وبحثية لعملاء عالميين مثل مايكروسوفت وأوراكل وشركة NEC وSAP وKPMG وExpeditors International. تشمل كفاءاتها الأساسية تقييم السوق، وتحليل البيانات، والتنبؤ، وصياغة الاستراتيجيات، والاستخبارات التنافسية، وكتابة التقارير.
أنكيتا بارعة في إدارة دورات المشاريع الكاملة، بدءًا من تصميم عروض ما قبل البيع ومناقشات العملاء، وصولًا إلى تقديم رؤى عملية بعد البيع. كما أنها ماهرة في إدارة فرق متعددة الوظائف، وهيكلة وحدات بحثية معقدة، ومواءمة الحلول مع أهداف العمل الخاصة بالعملاء. وقد مكنتها مهاراتها الممتازة في التواصل والقيادة والعرض التقديمي من تحقيق نتائج قيّمة باستمرار في بيئات سوقية سريعة التطور.
- التحليل التاريخي (سنتان)، سنة الأساس، التوقعات (7 سنوات) مع معدل النمو السنوي المركب
- تحليل PEST و SWOT
- حجم السوق والقيمة / الحجم - عالمي، إقليمي، بلد
- الصناعة والمنافسة
- مجموعة بيانات إكسل
التقارير الحديثة
تقارير ذات صلة
شهادات العملاء
تقرير سوق أنظمة SCADA من Insight Partners شامل، ويقدم رؤى قيّمة حول الاتجاهات الحالية والتوقعات المستقبلية. تميّز الفريق باحترافية عالية وسرعة في الاستجابة ودعم مستمر طوال الوقت. نحن راضون جدًا ونوصي بشدة بخدماتهم.
ران كيديم شريك, شركة ريالي تكنولوجيز المحدودةطلبتُ تقريرًا عن سوق برمجيات محدد، وأعدّه الفريق في غضون أيام قليلة. كانت المعلومات ذات صلة وثيقة وعرضها جيد. ثم طلبتُ بعض التعديلات والإضافات على التقرير. وكان الفريق متجاوبًا للغاية، وحصلتُ على التقرير النهائي في أقل من أسبوع.
جان هيرفيه جين رئيس مجلس الإدارة, فيوتشر أناليتيكاعملنا مع شركة "إنسايت بارتنرز" لإجراء دراسة سوقية وتوقعات مهمة. زودونا برؤى واضحة حول الفرص والمخاطر، مما ساعدنا في صياغة خططنا. كانت أبحاثهم سهلة الاستخدام ومبنية على بيانات دقيقة، مما ساعدنا على اتخاذ قرارات ذكية وواثقة. نوصي بهم بشدة.
بيوش ناجبال نائب الرئيس الأول, شعاع عالي عالميقدّمت شركة Insight Partners أبحاثًا سوقية ثاقبة ومنظمة جيدًا بخبرة واسعة في هذا المجال. تميّز فريقهم بالاحترافية وسرعة الاستجابة طوال الوقت. وسهّل موقعهم الإلكتروني سهل الاستخدام الوصول إلى تقارير القطاع. نوصي بهم بشدة لخدمات بحثية موثوقة وعالية الجودة.
يوكيهيكو أداتشي المدير التنفيذي, ديب بلو، ذ.م.م.هذه أول مرة أشتري فيها تقرير سوق من The Insight Partners. رغم أنني كنت مترددًا في البداية، إلا أنني زرت موقعهم الإلكتروني وشعرت براحة أكبر للمخاطرة وشراء تقرير السوق. أنا راضٍ تمامًا عن جودة التقرير وخدمة العملاء. كانت لديّ عدة أسئلة وتعليقات حول التقرير الأولي، ولكن بعد بضع محادثات عبر البريد الإلكتروني مع محللهم، أعتقد أن لديّ تقريرًا يمكنني استخدامه كمدخل لعملية التخطيط الاستراتيجي لدينا. شكرًا جزيلاً لكم على تخصيص وقتكم الإضافي وجعل هذه التجربة إيجابية. سأوصي بخدماتكم للآخرين بالتأكيد، وستكونون أول من ألجأ إليه عندما نحتاج إلى المزيد من بيانات السوق.
جون سوزوكي الرئيس والرئيس التنفيذي وعضو مجلس الإدارة, بي كيه تكنولوجيزأود أن أقدّر دعمكم واحترافيتكم في الاستجابة لطلبي للحصول على معلومات بشأن سوق التشخيص المخبري للأمراض المعدية في نيجيريا. كما أُقدّر صبركم وتوجيهكم، واستعدادكم لتقديم خصم، مما مكّننا في النهاية من إتمام الصفقة. أتطلع إلى التعامل مع "ذا إنسايت بارتنرز" مستقبلًا، كل ذلك بفضل الانطباع الذي تركتموه لديّ نتيجةً لهذا اللقاء الأول.
الدكتور تشيجيوك أونيا المدير الإداري, شركة باينكريست للرعاية الصحية المحدودةسبب الشراء
- اتخاذ قرارات مدروسة
- فهم ديناميكيات السوق
- تحليل المنافسة
- رؤى العملاء
- توقعات السوق
- تخفيف المخاطر
- التخطيط الاستراتيجي
- مبررات الاستثمار
- تحديد الأسواق الناشئة
- تحسين استراتيجيات التسويق
- تعزيز الكفاءة التشغيلية
- مواكبة التوجهات التنظيمية


 احصل على عينة مجانية ل - سوق برمجيات مختبرات تكنولوجيا المعلومات الافتراضية