استراتيجيات السوق مقاييس شدة الريح الرياح، وأفضل اللاعبين، وفرص النمو، والتحليل والتنبؤ بحلول عام 2030
البيانات التاريخية : 2020-2021 | سنة الأساس : 2022 | فترة التنبؤ : 2023-2030حجم سوق مقاييس سرعة الرياح وتوقعاته (2020-2030)، والحصة العالمية والإقليمية، والاتجاهات، وفرص النمو. يغطي التقرير تحليلًا لفرص النمو: حسب نوع القياس (مقاييس سرعة الرياح ومقاييس ضغط الرياح)، ونوع مقاييس سرعة الرياح (ميكانيكية، وفوق صوتية، وغيرها)، والتطبيق (برية وبحرية).
- تاريخ التقرير : Sep 2023
- رمز التقرير : TIPRE00015336
- الفئة : الإلكترونيات وأشباه الموصلات
- الحالة : نُشرت
- تنسيقات التقارير المتاحة :


- عدد الصفحات : 159
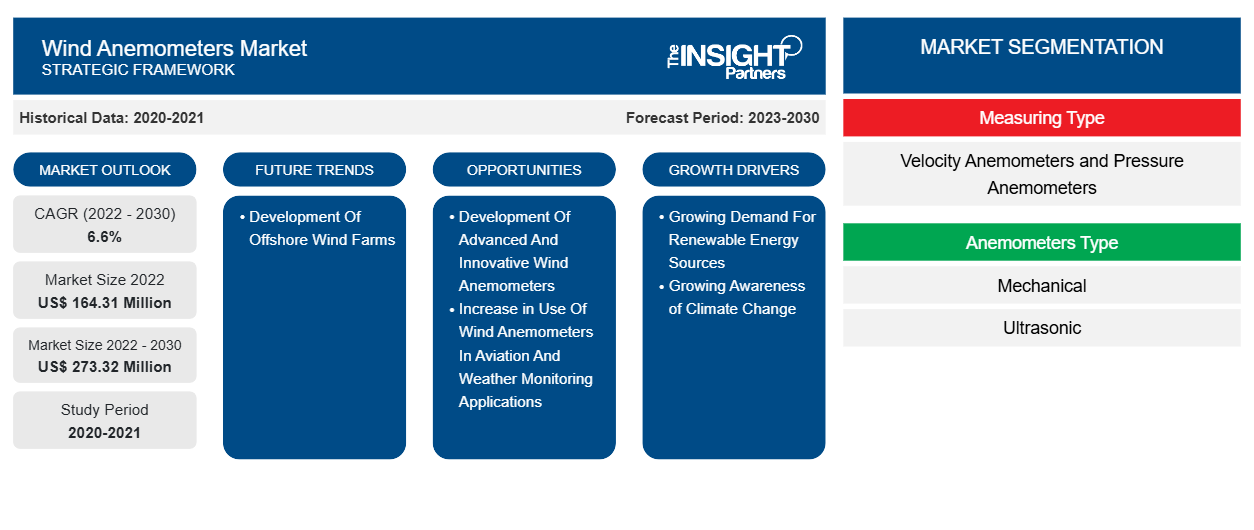
[تقرير بحثي] تم تقييم حجم سوق مقاييس سرعة الرياح بـ 164.31 مليون دولار أمريكي في عام 2022 ومن المتوقع أن يصل إلى 273.32 مليون دولار أمريكي بحلول عام 2030. ومن المتوقع أن يسجل سوق مقاييس سرعة الرياح معدل نمو سنوي مركب بنسبة 6.6٪ من عام 2022 إلى عام 2030.
وجهة نظر المحلل:
تُستخدم مقاييس سرعة الرياح على نطاق واسع في جميع محطات الطقس، بدءًا من القطب الشمالي البارد إلى المناطق الاستوائية الرطبة. تساعد سرعة الرياح في الإشارة إلى تغير في أنماط الطقس، على سبيل المثال، اقتراب العواصف. إنه أمر مهم لعلماء المناخ والمهندسين والطيارين. تطلق العديد من الشركات العاملة في سوق مقاييس سرعة الرياح أجهزة جديدة لقياس الرياح. على سبيل المثال، في يونيو 2023، أطلقت شركة تصنيع أجهزة الاستشعار Gill Instruments ومقرها المملكة المتحدة مقياس سرعة الرياح بالموجات فوق الصوتية ثنائي المحور (Windultra) لقياس اتجاه الرياح وسرعتها. تم تصميمه للاستخدام في تطبيقات بحرية أو برية مختلفة. تتضمن ميزات التثبيت والمحاذاة السريعة لـ WindUltra اختيارًا من حوامل ذات قطبين، إما حامل قطب بقفل ملتوي 1 بوصة (25-26 مم) أو حامل قطب بمشبك شريطي 1.75-2 بوصة (44-51 مم).
نظرة عامة على سوق أجهزة قياس سرعة الرياح:
يقيس مقياس سرعة الرياح سرعة الرياح وضغطها. لدراسة أنماط الطقس، تعد هذه الأجهزة أدوات أساسية لعلماء الأرصاد الجوية. يستخدم علماء الفيزياء هذه الأجهزة أثناء دراسة حركات الهواء. تقدم شركات التصنيع المختلفة في جميع أنحاء العالم أجهزة قياس سرعة الرياح المختلفة في الصناعات مثل التدفئة والتهوية وتكييف الهواء والبحرية وطاقة الرياح والبناء والفضاء الجوي. بالإضافة إلى ذلك، بالنسبة لسرعة الهواء أو الرياح، يتم استخدام أنواع مختلفة من مقاييس سرعة الرياح لأداء وظائف متعددة، بما في ذلك درجة الحرارة والرطوبة. بناءً على النوع، تمتلك هذه أيضًا وظيفة تسجيل البيانات أو تسجيلها لأخذ أبعاد طويلة المدى في فترة معينة. هناك العديد من فوائد مقياس سرعة الرياح، مثل الدقة العالية واستخدام الطاقة المنخفضة. باستخدام جهاز واحد فقط، يمكن للمستخدم قياس معلمات متعددة مثل سرعة الرياح واتجاهها وضغطها.
قم بتخصيص هذا التقرير ليناسب متطلباتك
ستحصل على تخصيص لأي تقرير - مجانًا - بما في ذلك أجزاء من هذا التقرير، أو تحليل على مستوى الدولة، وحزمة بيانات Excel، بالإضافة إلى الاستفادة من العروض والخصومات الرائعة للشركات الناشئة والجامعات
سوق أجهزة قياس سرعة الرياح: رؤى استراتيجية
-
احصل على أهم اتجاهات السوق الرئيسية لهذا التقرير.ستتضمن هذه العينة المجانية تحليلاً للبيانات، بدءًا من اتجاهات السوق وحتى التقديرات والتوقعات.
محركات سوق أجهزة قياس سرعة الرياح:
الطلب المتزايد على مصادر الطاقة المتجددة يدفع نمو سوق أجهزة قياس سرعة الرياح
يؤثر نمو مصادر الطاقة المتجددة ، وخاصة طاقة الرياح، بشكل كبير على سوق مقاييس سرعة الرياح. ووفقًا لوكالة الطاقة الدولية (IEA)، في عام 2022، زاد إمدادات الطاقة المتجددة من الرياح والطاقة الشمسية والطاقة الكهرومائية والطاقة الحرارية الأرضية والمحيطات بنحو 8%، وزادت حصة هذه التقنيات في إجمالي إمدادات الطاقة العالمية بنحو 0.4%، لتصل إلى 5.5%. كما زادت كمية الكهرباء المولدة من الرياح بمقدار 265 تيراوات في الساعة (زيادة قدرها 14%)، وهو ثاني أكبر نمو بين جميع تقنيات توليد الطاقة. وظلت الرياح هي التكنولوجيا المتجددة الرائدة، حيث تولدت أكثر من 2100 تيراوات في الساعة في عام 2022.
تتخذ حكومات بلدان مختلفة مبادرات لزيادة مزارع الرياح، بما في ذلك طاقة الرياح. على سبيل المثال، في مايو 2023، أعلنت شركة ITOCHU Corporation أن شركتي ITOCHU وHitachi Zosen Corporation بدأتا الاستعدادات لتطوير وتشغيل مزرعة رياح برية في منطقة تواجه المحيط الهادئ في قرية Rokkasho، منطقة Kamikita، محافظة Aomori، ومن خلال دمج شركة Mutsu Ogawara Wind Power LLC، فإنها تنتج الكهرباء. ومن المقرر أن يبدأ تصميم وبناء مشروع مزرعة الرياح البرية هذا في أبريل 2026. وبالمثل، في يونيو 2023، تم إطلاق أكبر مزرعة رياح عائمة في العالم قبالة الساحل الغربي للنرويج. ستولد Equinor، بسعة 88 ميغاواط (MW)، الطاقة لتزويد منصات النفط والغاز القريبة. تتمتع توربينات الرياح بميزات متقدمة للغاية للحفاظ على الكفاءة والسلامة. يقيس مقياس سرعة الرياح سرعة الرياح باستمرار وينقل البيانات إلى وحدة التحكم في توربينات الرياح، والتي تتحكم في الدوار بسرعة آمنة. تعد أجهزة قياس سرعة الرياح من الأدوات الأساسية المستخدمة في صناعة طاقة الرياح. وبالتالي، فإن مصادر الطاقة المتجددة المتنامية سوف تعمل على تعزيز نمو سوق أجهزة قياس سرعة الرياح.
تحليل قطاعي لسوق أجهزة قياس سرعة الرياح:
بناءً على نوع مقياس سرعة الرياح، يتم تقسيم سوق مقاييس سرعة الرياح إلى ميكانيكية وفوق صوتية وغيرها. احتل القطاع الميكانيكي أكبر حصة في سوق مقاييس سرعة الرياح في عام 2022. ومن المتوقع أن يسجل قطاع الموجات فوق الصوتية أعلى معدل نمو سنوي مركب في سوق مقاييس سرعة الرياح. يحتوي مقياس سرعة الرياح الميكانيكي على عجلة بمروحة أو أكواب في نهاية أضلاع العجلة. يحتوي أحد الأكواب على مغناطيس؛ في كل مرة يمر فيها المغناطيس بمفتاح، فإنه يقوم بتسجيل. يعطي التسجيل بواسطة مقياس سرعة الرياح الميكانيكي قراءة دقيقة للغاية لسرعة الرياح. أنواع مقاييس سرعة الرياح الميكانيكية هي مقاييس سرعة الرياح الكأسية ومقاييس سرعة الرياح ذات الريش وغيرها. يتكون مقياس سرعة الرياح الكأسي من أربعة أكواب نصف كروية متصلة بطرف واحد من الأذرع الأفقية بزوايا متساوية على عمود رأسي. يكون وضع الأكواب بحيث يمر الهواء من خلالها في الاتجاه الأفقي، مما يجعل دوران الكأس متناسبًا مع سرعة الرياح. تقوم العديد من المدارس في مختلف البلدان بتركيب الأجهزة الخاصة بمحطات الطقس المصممة وفقًا للمعايير التي حددتها إدارة الأرصاد الجوية الهندية (IMD).
تحليل إقليمي لسوق أجهزة قياس سرعة الرياح:
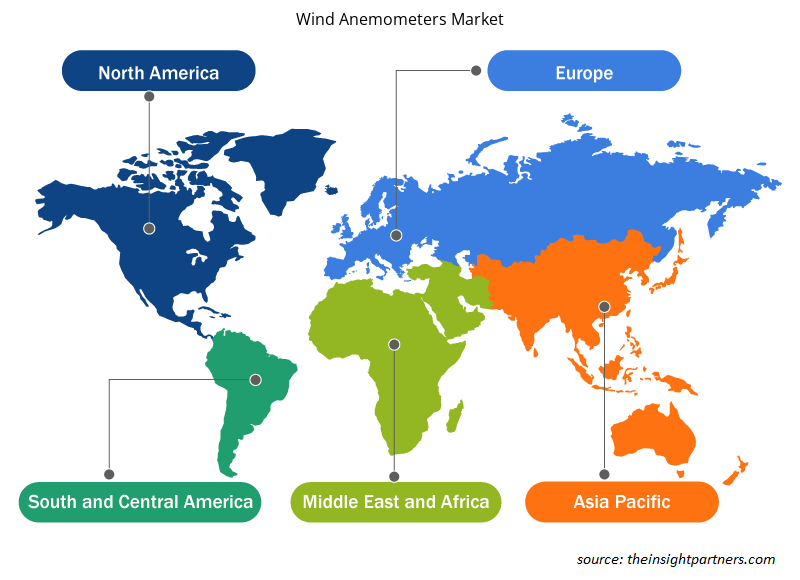
تم تقييم حجم سوق مقاييس سرعة الرياح في أمريكا الشمالية بـ 59.65 مليون دولار أمريكي في عام 2022 ومن المتوقع أن يصل إلى 102.06 مليون دولار أمريكي بحلول عام 2030؛ ومن المتوقع أن يسجل معدل نمو سنوي مركب بنسبة 6.9٪ من عام 2022 إلى عام 2030. يتم تقسيم سوق مقاييس سرعة الرياح في أمريكا الشمالية إلى الولايات المتحدة وكندا والمكسيك. احتلت الولايات المتحدة أكبر حصة في سوق مقاييس سرعة الرياح في أمريكا الشمالية في عام 2022. تتزايد مصادر الطاقة المتجددة في الولايات المتحدة بشكل كبير. وفقًا لمجلس أمناء جامعة ميشيغان، قامت صناعة الرياح الأمريكية بتركيب 13413 ميجاوات (MW) من طاقة الرياح الجديدة في عام 2021، مما يرفع الإجمالي التراكمي إلى 135886 ميجاوات. هذه هي ثاني أعلى طاقة رياح تم تركيبها في عام واحد، وتمثل 20 مليار دولار أمريكي من الاستثمار. توفر الرياح أكثر من 9% من الكهرباء على مستوى البلاد، وأكثر من 50% في ساوث داكوتا وأيوا، وأكثر من 30% في أوكلاهوما وكانساس وداكوتا الشمالية. في عام 2022، أفادت مصادر الطاقة المتجددة بنحو 13.1% من استهلاك الطاقة الأولية في الولايات المتحدة. شكلت مصادر الطاقة المتجددة ما يقرب من 21.5% من إجمالي توليد الكهرباء على نطاق المرافق. تُستخدم مقاييس سرعة الرياح على نطاق واسع لقياس سرعة الرياح ونقل بيانات سرعة الرياح إلى وحدة التحكم. وبالتالي، مع تزايد مصادر الطاقة المتجددة، يتزايد الطلب على مقاييس سرعة الرياح بشكل كبير في البلاد.
تحليل اللاعبين الرئيسيين في سوق أجهزة قياس سرعة الرياح:
تعد LSI LASTEM Srl وCampbell Scientific Inc وVaisala Oyj وRM Young Co وOTT HydroMet Fellbach GmbH وGill Instruments Ltd وAdolf Thies GmbH & Co KG وTheta Instruments Co Ltd وLambrecht meteo GmbH وBristol Industrial & Research Associates Ltd وMETEK Meteorologische Messtechnik GmbH من بين اللاعبين الرئيسيين العاملين في سوق مقاييس سرعة الرياح.
رؤى إقليمية حول سوق أجهزة قياس سرعة الرياح
لقد قام المحللون في Insight Partners بشرح الاتجاهات والعوامل الإقليمية المؤثرة على سوق مقاييس سرعة الرياح طوال فترة التوقعات بشكل شامل. يناقش هذا القسم أيضًا قطاعات سوق مقاييس سرعة الرياح والجغرافيا في جميع أنحاء أمريكا الشمالية وأوروبا ومنطقة آسيا والمحيط الهادئ والشرق الأوسط وأفريقيا وأمريكا الجنوبية والوسطى.
- احصل على البيانات الإقليمية المحددة لسوق أجهزة قياس سرعة الرياح
نطاق تقرير سوق أجهزة قياس سرعة الرياح
| سمة التقرير | تفاصيل |
|---|---|
| حجم السوق في عام 2022 | 164.31 مليون دولار أمريكي |
| حجم السوق بحلول عام 2030 | 273.32 مليون دولار أمريكي |
| معدل النمو السنوي المركب العالمي (2022 - 2030) | 6.6% |
| البيانات التاريخية | 2020-2021 |
| فترة التنبؤ | 2023-2030 |
| القطاعات المغطاة |
حسب نوع القياس
|
| المناطق والدول المغطاة |
أمريكا الشمالية
|
| قادة السوق وملفات تعريف الشركات الرئيسية |
|
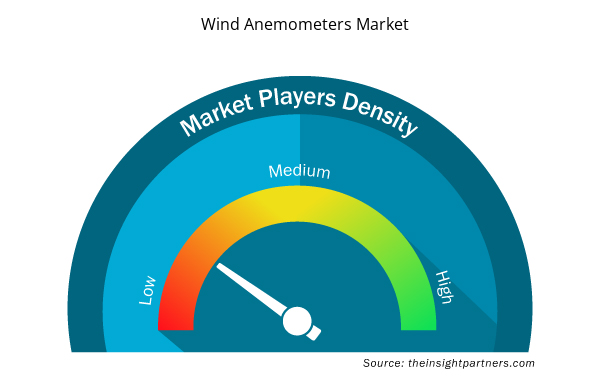
كثافة اللاعبين في سوق أجهزة قياس سرعة الرياح: فهم تأثيرها على ديناميكيات الأعمال
يشهد سوق أجهزة قياس سرعة الرياح نموًا سريعًا، مدفوعًا بالطلب المتزايد من جانب المستخدم النهائي بسبب عوامل مثل تفضيلات المستهلكين المتطورة والتقدم التكنولوجي والوعي المتزايد بفوائد المنتج. ومع ارتفاع الطلب، تعمل الشركات على توسيع عروضها والابتكار لتلبية احتياجات المستهلكين والاستفادة من الاتجاهات الناشئة، مما يؤدي إلى زيادة نمو السوق.
تشير كثافة اللاعبين في السوق إلى توزيع الشركات أو المؤسسات العاملة في سوق أو صناعة معينة. وهي تشير إلى عدد المنافسين (اللاعبين في السوق) الموجودين في مساحة سوق معينة نسبة إلى حجمها أو قيمتها السوقية الإجمالية.
الشركات الرئيسية العاملة في سوق أجهزة قياس سرعة الرياح هي:
- شركة إل إس آي لاستيم المحدودة
- فايسالا أويج
- شركة آر إم يونغ
- شركة جيل للأدوات المحدودة
- شركة أدولف ثيس المحدودة وشركاه
إخلاء المسؤولية : الشركات المذكورة أعلاه ليست مرتبة بأي ترتيب معين.
- احصل على نظرة عامة على أهم اللاعبين الرئيسيين في سوق أجهزة قياس سرعة الرياح
التطورات الأخيرة:
تتبنى الشركات في سوق مقاييس سرعة الرياح استراتيجيات عضوية وغير عضوية مثل عمليات الدمج والاستحواذ بشكل كبير. وفيما يلي بعض التطورات الرئيسية الأخيرة في سوق مقاييس سرعة الرياح:
- في عام 2023، قدمت شركة Gill Instruments Ltd جهاز WindUltra، وهو جهاز لقياس سرعة الرياح ثنائي المحور. يوفر المنتج أداءً عاليًا إلى جانب المتانة والتصميم المدمج وميزات التركيب والمحاذاة السريعة مع الاستمرار في تقديم سرعة الرياح واتجاهها بالموجات فوق الصوتية عالية الدقة التي تشتهر بها شركة Gill.
- في عام 2022، استحوذت شركة METEK على مجالات الأعمال الخاصة بشركة Theodor Friedrichs GmbH & Co. وتشمل منتجات شركة Theodor Friedrichs GmbH & Co. تقنية الاستشعار التقليدية، ومسجل البيانات Combilog المستخدم على نطاق واسع، ومجموعة متنوعة من غرف الاختبار.

نافين خبيرٌ متمرسٌ في أبحاث السوق والاستشارات، يتمتع بخبرةٍ تزيد عن 9 سنوات في مشاريع مُخصصة ومُشتركة واستشارية. يشغل حاليًا منصب نائب الرئيس المساعد، وقد نجح في إدارة أصحاب المصلحة عبر سلسلة قيمة المشاريع، وألّف أكثر من 100 تقرير بحثي وأكثر من 30 مهمة استشارية. يمتد نطاق عمله ليشمل مشاريع صناعية وحكومية، مساهمًا بشكل كبير في نجاح العملاء واتخاذ القرارات القائمة على البيانات.
نافين حاصلٌ على شهادة في هندسة الإلكترونيات والاتصالات من جامعة فرجينيا التقنية، كارناتاكا، وشهادة ماجستير في إدارة الأعمال في التسويق والعمليات من جامعة مانيبال. وهو عضوٌ نشطٌ في معهد مهندسي الكهرباء والإلكترونيات (IEEE) لمدة 9 سنوات، حيث شارك في مؤتمراتٍ وندواتٍ تقنية، وتطوّع على مستوى الأقسام والمناطق. قبل منصبه الحالي، عمل مستشارًا استراتيجيًا مساعدًا في IndustryARC، ومستشارًا للخوادم الصناعية في شركة هيوليت باكارد (HP Global).
- التحليل التاريخي (سنتان)، سنة الأساس، التوقعات (7 سنوات) مع معدل النمو السنوي المركب
- تحليل PEST و SWOT
- حجم السوق والقيمة / الحجم - عالمي، إقليمي، بلد
- الصناعة والمنافسة
- مجموعة بيانات إكسل
التقارير الحديثة
تقارير ذات صلة
شهادات العملاء
تقرير سوق أنظمة SCADA من Insight Partners شامل، ويقدم رؤى قيّمة حول الاتجاهات الحالية والتوقعات المستقبلية. تميّز الفريق باحترافية عالية وسرعة في الاستجابة ودعم مستمر طوال الوقت. نحن راضون جدًا ونوصي بشدة بخدماتهم.
ران كيديم شريك, شركة ريالي تكنولوجيز المحدودةطلبتُ تقريرًا عن سوق برمجيات محدد، وأعدّه الفريق في غضون أيام قليلة. كانت المعلومات ذات صلة وثيقة وعرضها جيد. ثم طلبتُ بعض التعديلات والإضافات على التقرير. وكان الفريق متجاوبًا للغاية، وحصلتُ على التقرير النهائي في أقل من أسبوع.
جان هيرفيه جين رئيس مجلس الإدارة, فيوتشر أناليتيكاعملنا مع شركة "إنسايت بارتنرز" لإجراء دراسة سوقية وتوقعات مهمة. زودونا برؤى واضحة حول الفرص والمخاطر، مما ساعدنا في صياغة خططنا. كانت أبحاثهم سهلة الاستخدام ومبنية على بيانات دقيقة، مما ساعدنا على اتخاذ قرارات ذكية وواثقة. نوصي بهم بشدة.
بيوش ناجبال نائب الرئيس الأول, شعاع عالي عالميقدّمت شركة Insight Partners أبحاثًا سوقية ثاقبة ومنظمة جيدًا بخبرة واسعة في هذا المجال. تميّز فريقهم بالاحترافية وسرعة الاستجابة طوال الوقت. وسهّل موقعهم الإلكتروني سهل الاستخدام الوصول إلى تقارير القطاع. نوصي بهم بشدة لخدمات بحثية موثوقة وعالية الجودة.
يوكيهيكو أداتشي المدير التنفيذي, ديب بلو، ذ.م.م.هذه أول مرة أشتري فيها تقرير سوق من The Insight Partners. رغم أنني كنت مترددًا في البداية، إلا أنني زرت موقعهم الإلكتروني وشعرت براحة أكبر للمخاطرة وشراء تقرير السوق. أنا راضٍ تمامًا عن جودة التقرير وخدمة العملاء. كانت لديّ عدة أسئلة وتعليقات حول التقرير الأولي، ولكن بعد بضع محادثات عبر البريد الإلكتروني مع محللهم، أعتقد أن لديّ تقريرًا يمكنني استخدامه كمدخل لعملية التخطيط الاستراتيجي لدينا. شكرًا جزيلاً لكم على تخصيص وقتكم الإضافي وجعل هذه التجربة إيجابية. سأوصي بخدماتكم للآخرين بالتأكيد، وستكونون أول من ألجأ إليه عندما نحتاج إلى المزيد من بيانات السوق.
جون سوزوكي الرئيس والرئيس التنفيذي وعضو مجلس الإدارة, بي كيه تكنولوجيزأود أن أقدّر دعمكم واحترافيتكم في الاستجابة لطلبي للحصول على معلومات بشأن سوق التشخيص المخبري للأمراض المعدية في نيجيريا. كما أُقدّر صبركم وتوجيهكم، واستعدادكم لتقديم خصم، مما مكّننا في النهاية من إتمام الصفقة. أتطلع إلى التعامل مع "ذا إنسايت بارتنرز" مستقبلًا، كل ذلك بفضل الانطباع الذي تركتموه لديّ نتيجةً لهذا اللقاء الأول.
الدكتور تشيجيوك أونيا المدير الإداري, شركة باينكريست للرعاية الصحية المحدودةسبب الشراء
- اتخاذ قرارات مدروسة
- فهم ديناميكيات السوق
- تحليل المنافسة
- رؤى العملاء
- توقعات السوق
- تخفيف المخاطر
- التخطيط الاستراتيجي
- مبررات الاستثمار
- تحديد الأسواق الناشئة
- تحسين استراتيجيات التسويق
- تعزيز الكفاءة التشغيلية
- مواكبة التوجهات التنظيمية


 احصل على عينة مجانية ل - سوق أجهزة قياس سرعة الرياح