تقرير سوق الأسلاك والكابلات 2031 حسب القطاعات والجغرافيا والديناميكيات والتطورات الأخيرة والرؤى الاستراتيجية
البيانات التاريخية : 2021-2022 | سنة الأساس : 2023 | فترة التنبؤ : 2024-2031حجم سوق الأسلاك والكابلات وتوقعاته (2021-2031)، والحصة العالمية والإقليمية، والاتجاهات، وفرص النمو، وتغطية التقرير: حسب النوع (الكابلات والأسلاك وأجهزة التحكم بالدفع والسحب) وصناعة الاستخدام النهائي (الطائرات، والنقل، والطب، والبحرية، والبناء)، والجغرافيا
- تاريخ التقرير : Mar 2026
- رمز التقرير : TIPRE00027590
- الفئة : الإلكترونيات وأشباه الموصلات
- الحالة : البيانات الصادرة
- تنسيقات التقارير المتاحة :


- عدد الصفحات : 150
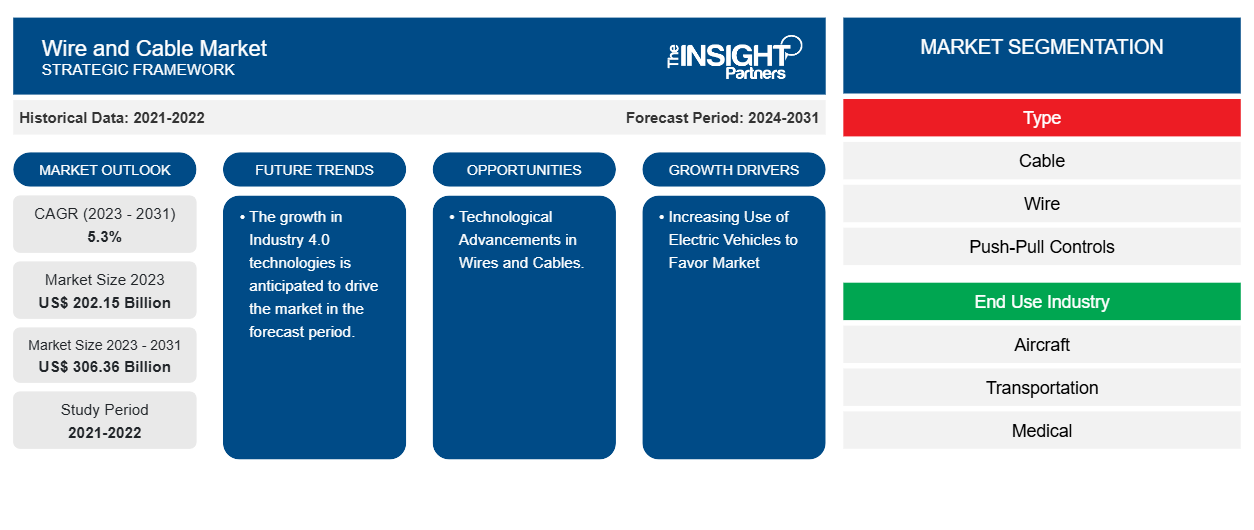
من المتوقع أن يصل حجم سوق الأسلاك والكابلات إلى 306.36 مليار دولار أمريكي بحلول عام 2031 من 202.15 مليار دولار أمريكي في عام 2023. ومن المتوقع أن يسجل السوق معدل نمو سنوي مركب بنسبة 5.3٪ خلال الفترة 2023-2031. ومن المرجح أن يظل الاستخدام المتزايد للسيارات الكهربائية والنمو في قطاع البناء من الاتجاهات والدوافع الرئيسية في السوق.
تحليل سوق الأسلاك والكابلات
يشهد سوق الأسلاك والكابلات نموًا كبيرًا على مستوى العالم. ويعزى هذا النمو إلى الاستخدام المتزايد للسيارات الكهربائية والنمو في قطاع البناء. علاوة على ذلك، من المتوقع أن يوفر التبني المتزايد للأسلاك والكابلات في الصناعة الطبية وتنفيذ الصناعة 4.0 العديد من الفرص في سوق الأسلاك والكابلات. بالإضافة إلى ذلك، فإن الحاجة المتزايدة للطائرات ومتانة وقابلية تكيف أسلاك الكابلات تعزز السوق.
نظرة عامة على سوق الأسلاك والكابلات
يجب تحديد حجم الأسلاك والكابلات الكهربائية وتركيبها بشكل صحيح لاجتياز الفحص الكهربائي والحفاظ على تشغيل الكهرباء بأمان في منزلك. سيعلمك هذا الدليل الفرق بين أنواع الأسلاك الكهربائية وأنواع الكابلات الكهربائية. ستتعلم أيضًا كيفية الاختيار بين الكابلات والأسلاك الكهربائية لمشاريعك.
قم بتخصيص هذا التقرير ليناسب متطلباتك
ستحصل على تخصيص لأي تقرير - مجانًا - بما في ذلك أجزاء من هذا التقرير، أو تحليل على مستوى الدولة، وحزمة بيانات Excel، بالإضافة إلى الاستفادة من العروض والخصومات الرائعة للشركات الناشئة والجامعات
سوق الأسلاك والكابلات: رؤى استراتيجية
-
احصل على أهم اتجاهات السوق الرئيسية لهذا التقرير.ستتضمن هذه العينة المجانية تحليلاً للبيانات، بدءًا من اتجاهات السوق وحتى التقديرات والتوقعات.
محركات وفرص سوق الأسلاك والكابلات
زيادة استخدام المركبات الكهربائية لصالح السوق
تزداد شعبية المركبات الكهربائية. ومع استمرار ارتفاع الطلب من جانب المستهلكين، تزداد الحاجة إلى الأسلاك والكابلات ومكونات الشحن الأخرى الخاصة بالمركبات الكهربائية . في الأجزاء الداخلية من المركبات الكهربائية، فكر في الأسلاك كموصلات مفردة والكابلات كمجموعات من الأسلاك أو حزم الموصلات. تعمل الأسلاك والكابلات على توصيل الكهرباء التي تغذي بطارية المركبة وتحافظ على تشغيل المركبة. هناك نوعان من كابلات المركبات الكهربائية:
- كابلات البطارية - على عكس كابلات ICE ذات الجهد المنخفض، فهي مصممة لتيارات كهربائية وجهد أعلى.
- كابلات الشحن - تستخدم لتوصيل السيارة بمصدر كهربائي خارجي.
كابلات بطاريات المركبات الكهربائية مسؤولة عن نقل الطاقة بين حزمة البطاريات والأنظمة الكهربائية المختلفة. وعلى عكس كابلات محركات الاحتراق الداخلي ذات الجهد المنخفض، فإن كابلات البطاريات الخاصة بالمركبات الكهربائية والمركبات الهجينة مصممة لتيارات وجهد كهربائي أعلى وتعمل بجهد يتراوح من بضع مئات من الفولتات إلى أكثر من 1000 فولت. وبالتالي، بالنظر إلى المعايير المذكورة أعلاه، من المتوقع أن تكتسب سوق الأسلاك والكابلات زخمًا في السنوات القادمة.
التقدم التكنولوجي في الأسلاك والكابلات.
إن التطورات التكنولوجية في الأسلاك والكابلات تحدث في صناعات تطبيقية مختلفة، مدعومة بمعايير حكومية متغيرة وابتكارات مستمرة. في صناعة الأسلاك والكابلات، بما في ذلك كابلات الطاقة والتحكم، ينقسم التطور التكنولوجي إلى عزل ودرجة الجهد. من خلال تقديم بوليمرات ذات جودة أفضل وتقليل السُمك، يمكن تحقيق الخصائص الكهربائية والميكانيكية المطلوبة، جنبًا إلى جنب مع الجهد العالي. يمكن للكابلات المصنوعة من مواد عزل متقدمة التعامل مع درجات حرارة أعلى ومقاومة الرطوبة والمواد الكيميائية وتقديم أداء كهربائي أفضل. كما تم استكشاف تقنية النانو لتحسين خصائص المواد. تسمح التطورات التكنولوجية مثل كابلات التيار المستمر عالي الجهد (HVDC) بنقل الكهرباء لتقليل خسائر الطاقة. لقد تحسنت هذه التكنولوجيا مع تصنيفات الجهد الأعلى والعزل الأفضل.
تقرير تحليل تجزئة سوق الأسلاك والكابلات
القطاعات الرئيسية التي ساهمت في اشتقاق تحليل سوق الأسلاك والكابلات هي نوع الصناعة والاستخدام النهائي.
- بناءً على النوع، يتم تقسيم سوق الأسلاك والكابلات إلى كبلات وأسلاك وأدوات تحكم بالدفع والسحب. ومن المتوقع أن يحظى قطاع مكونات إدارة الطاقة بحصة سوقية كبيرة خلال فترة التوقعات.
- بناءً على صناعة الاستخدام النهائي، يتم تقسيم سوق الأسلاك والكابلات إلىالطائرات، والنقل، والطب، والبحرية، والبناء. ومن المتوقع أن يحظى قطاع الطائرات بحصة سوقية كبيرة خلال الفترة المتوقعة.
تحليل حصة سوق الأسلاك والكابلات حسب المنطقة الجغرافية
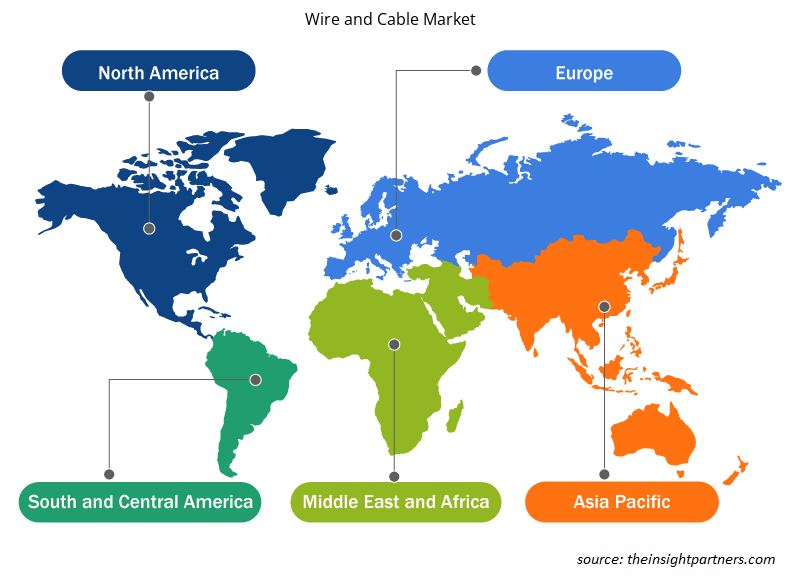
ينقسم النطاق الجغرافي لتقرير سوق الأسلاك والكابلات بشكل أساسي إلى خمس مناطق: أمريكا الشمالية، ومنطقة آسيا والمحيط الهادئ، وأوروبا، والشرق الأوسط وأفريقيا، وأمريكا الجنوبية والوسطى.
سيطرت أمريكا الشمالية على سوق الأسلاك والكابلات. وتنقسم سوق أمريكا الشمالية إلى الولايات المتحدة وكندا والمكسيك. وقد أدت اتجاهات تبني التكنولوجيا العالية في مختلف الصناعات في منطقة أمريكا الشمالية إلى تغذية نمو سوق الأسلاك والكابلات. ومن المتوقع أن تؤدي عوامل مثل زيادة اعتماد الأدوات الرقمية والإنفاق التكنولوجي المرتفع من قبل الوكالات الحكومية إلى دفع نمو سوق الأسلاك والكابلات في أمريكا الشمالية. زيادة استخدام المركبات الكهربائية في المنطقة.
علاوة على ذلك، فإن التركيز القوي على البحث والتطوير في الاقتصادات المتقدمة في الولايات المتحدة وكندا يجبر اللاعبين في أمريكا الشمالية على جلب حلول متقدمة تقنيًا إلى السوق. بالإضافة إلى ذلك، يوجد في الولايات المتحدة عدد كبير من اللاعبين في سوق الأسلاك والكابلات الذين يركزون بشكل متزايد على تطوير حلول مبتكرة. تساهم كل هذه العوامل في نمو سوق الأسلاك والكابلات في المنطقة.
رؤى إقليمية حول سوق الأسلاك والكابلات
لقد قام المحللون في Insight Partners بشرح الاتجاهات والعوامل الإقليمية المؤثرة على سوق الأسلاك والكابلات طوال فترة التوقعات بشكل شامل. يناقش هذا القسم أيضًا قطاعات سوق الأسلاك والكابلات والجغرافيا في جميع أنحاء أمريكا الشمالية وأوروبا ومنطقة آسيا والمحيط الهادئ والشرق الأوسط وأفريقيا وأمريكا الجنوبية والوسطى.
- احصل على البيانات الإقليمية المحددة لسوق الأسلاك والكابلات
نطاق تقرير سوق الأسلاك والكابلات
| سمة التقرير | تفاصيل |
|---|---|
| حجم السوق في عام 2023 | 202.15 مليار دولار أمريكي |
| حجم السوق بحلول عام 2031 | 306.36 مليار دولار أمريكي |
| معدل النمو السنوي المركب العالمي (2023 - 2031) | 5.3% |
| البيانات التاريخية | 2021-2022 |
| فترة التنبؤ | 2024-2031 |
| القطاعات المغطاة |
حسب النوع
|
| المناطق والدول المغطاة |
أمريكا الشمالية
|
| قادة السوق وملفات تعريف الشركات الرئيسية |
|
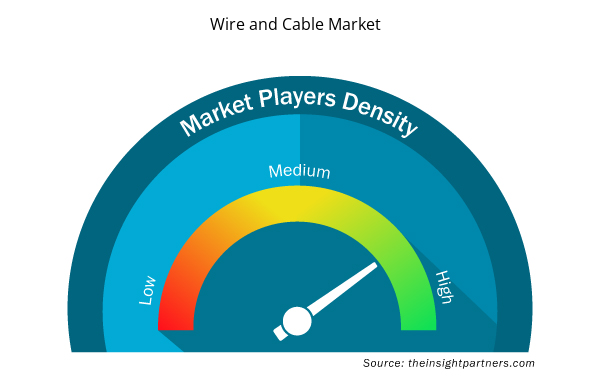
كثافة اللاعبين في سوق الأسلاك والكابلات: فهم تأثيرها على ديناميكيات الأعمال
يشهد سوق الأسلاك والكابلات نموًا سريعًا، مدفوعًا بالطلب المتزايد من المستخدم النهائي بسبب عوامل مثل تفضيلات المستهلك المتطورة والتقدم التكنولوجي والوعي المتزايد بفوائد المنتج. ومع ارتفاع الطلب، تعمل الشركات على توسيع عروضها والابتكار لتلبية احتياجات المستهلكين والاستفادة من الاتجاهات الناشئة، مما يؤدي إلى زيادة نمو السوق.
تشير كثافة اللاعبين في السوق إلى توزيع الشركات أو المؤسسات العاملة في سوق أو صناعة معينة. وهي تشير إلى عدد المنافسين (اللاعبين في السوق) الموجودين في مساحة سوق معينة نسبة إلى حجمها أو قيمتها السوقية الإجمالية.
الشركات الرئيسية العاملة في سوق الأسلاك والكابلات هي:
- شركة ASK Automotive المحدودة
- ر.كابيل
- تكنولوجيا كابلات بيرغن
- إليوت للتصنيع
- شركة كارل ستال سافا للصناعات المحدودة
- كابل ليكسكو
إخلاء المسؤولية : الشركات المذكورة أعلاه ليست مرتبة بأي ترتيب معين.
- احصل على نظرة عامة على أهم اللاعبين الرئيسيين في سوق الأسلاك والكابلات
أخبار سوق الأسلاك والكابلات والتطورات الأخيرة
يتم تقييم سوق الأسلاك والكابلات من خلال جمع البيانات النوعية والكمية بعد البحث الأولي والثانوي، والذي يتضمن منشورات الشركات المهمة وبيانات الجمعيات وقواعد البيانات. فيما يلي بعض التطورات في سوق الأسلاك والكابلات:
- أصدرت شركة NAPA المصنعة لقطع غيار السيارات كتالوجًا مكونًا من ثمانية أرقام لإطلاق مجموعتها الجديدة تمامًا من كابلات شحن المركبات الكهربائية في المملكة المتحدة. (موقع شركة NAPA على الويب، سبتمبر 2022)
- استحوذت شركة Shell España SA على 100% من شركة Cable Energía، وهي شركة إسبانية تعمل في تطوير وتشغيل نقاط شحن المركبات الكهربائية. سيمكن هذا الاستحواذ شركة Shell من تقديم خدمات شحن المركبات الكهربائية أثناء التنقل للسائقين والأساطيل في مواقع الوجهة في إسبانيا والبرتغال. من خلال هذه الصفقة، تواصل شركة Shell تطوير استراتيجيتها لتصبح الشركة الرائدة عالميًا في مجال شحن المركبات الكهربائية. (المصدر: شركة Shell España SA، موقع الشركة على الإنترنت، يونيو 2022)
تقرير سوق الأسلاك والكابلات والتغطية والنتائج المتوقعة
يوفر تقرير "حجم سوق الأسلاك والكابلات والتوقعات (2021-2031)" تحليلاً مفصلاً للسوق يغطي المجالات التالية:
- حجم سوق الأسلاك والكابلات وتوقعاته على المستويات العالمية والإقليمية والوطنية لجميع قطاعات السوق الرئيسية التي يغطيها النطاق
- اتجاهات سوق الأسلاك والكابلات بالإضافة إلى ديناميكيات السوق مثل المحركات والقيود والفرص الرئيسية
- تحليل مفصل لقوى PEST/Porter الخمس وSWOT
- تحليل سوق الأسلاك والكابلات يغطي اتجاهات السوق الرئيسية والإطار العالمي والإقليمي والجهات الفاعلة الرئيسية واللوائح والتطورات الأخيرة في السوق
- تحليل المشهد الصناعي والمنافسة الذي يغطي تركيز السوق، وتحليل خريطة الحرارة، واللاعبين البارزين، والتطورات الأخيرة في سوق الأسلاك والكابلات
- ملفات تعريف الشركة التفصيلية

نافين خبيرٌ متمرسٌ في أبحاث السوق والاستشارات، يتمتع بخبرةٍ تزيد عن 9 سنوات في مشاريع مُخصصة ومُشتركة واستشارية. يشغل حاليًا منصب نائب الرئيس المساعد، وقد نجح في إدارة أصحاب المصلحة عبر سلسلة قيمة المشاريع، وألّف أكثر من 100 تقرير بحثي وأكثر من 30 مهمة استشارية. يمتد نطاق عمله ليشمل مشاريع صناعية وحكومية، مساهمًا بشكل كبير في نجاح العملاء واتخاذ القرارات القائمة على البيانات.
نافين حاصلٌ على شهادة في هندسة الإلكترونيات والاتصالات من جامعة فرجينيا التقنية، كارناتاكا، وشهادة ماجستير في إدارة الأعمال في التسويق والعمليات من جامعة مانيبال. وهو عضوٌ نشطٌ في معهد مهندسي الكهرباء والإلكترونيات (IEEE) لمدة 9 سنوات، حيث شارك في مؤتمراتٍ وندواتٍ تقنية، وتطوّع على مستوى الأقسام والمناطق. قبل منصبه الحالي، عمل مستشارًا استراتيجيًا مساعدًا في IndustryARC، ومستشارًا للخوادم الصناعية في شركة هيوليت باكارد (HP Global).
- التحليل التاريخي (سنتان)، سنة الأساس، التوقعات (7 سنوات) مع معدل النمو السنوي المركب
- تحليل PEST و SWOT
- حجم السوق والقيمة / الحجم - عالمي، إقليمي، بلد
- الصناعة والمنافسة
- مجموعة بيانات إكسل
التقارير الحديثة
تقارير ذات صلة
شهادات العملاء
تقرير سوق أنظمة SCADA من Insight Partners شامل، ويقدم رؤى قيّمة حول الاتجاهات الحالية والتوقعات المستقبلية. تميّز الفريق باحترافية عالية وسرعة في الاستجابة ودعم مستمر طوال الوقت. نحن راضون جدًا ونوصي بشدة بخدماتهم.
ران كيديم شريك, شركة ريالي تكنولوجيز المحدودةطلبتُ تقريرًا عن سوق برمجيات محدد، وأعدّه الفريق في غضون أيام قليلة. كانت المعلومات ذات صلة وثيقة وعرضها جيد. ثم طلبتُ بعض التعديلات والإضافات على التقرير. وكان الفريق متجاوبًا للغاية، وحصلتُ على التقرير النهائي في أقل من أسبوع.
جان هيرفيه جين رئيس مجلس الإدارة, فيوتشر أناليتيكاعملنا مع شركة "إنسايت بارتنرز" لإجراء دراسة سوقية وتوقعات مهمة. زودونا برؤى واضحة حول الفرص والمخاطر، مما ساعدنا في صياغة خططنا. كانت أبحاثهم سهلة الاستخدام ومبنية على بيانات دقيقة، مما ساعدنا على اتخاذ قرارات ذكية وواثقة. نوصي بهم بشدة.
بيوش ناجبال نائب الرئيس الأول, شعاع عالي عالميقدّمت شركة Insight Partners أبحاثًا سوقية ثاقبة ومنظمة جيدًا بخبرة واسعة في هذا المجال. تميّز فريقهم بالاحترافية وسرعة الاستجابة طوال الوقت. وسهّل موقعهم الإلكتروني سهل الاستخدام الوصول إلى تقارير القطاع. نوصي بهم بشدة لخدمات بحثية موثوقة وعالية الجودة.
يوكيهيكو أداتشي المدير التنفيذي, ديب بلو، ذ.م.م.هذه أول مرة أشتري فيها تقرير سوق من The Insight Partners. رغم أنني كنت مترددًا في البداية، إلا أنني زرت موقعهم الإلكتروني وشعرت براحة أكبر للمخاطرة وشراء تقرير السوق. أنا راضٍ تمامًا عن جودة التقرير وخدمة العملاء. كانت لديّ عدة أسئلة وتعليقات حول التقرير الأولي، ولكن بعد بضع محادثات عبر البريد الإلكتروني مع محللهم، أعتقد أن لديّ تقريرًا يمكنني استخدامه كمدخل لعملية التخطيط الاستراتيجي لدينا. شكرًا جزيلاً لكم على تخصيص وقتكم الإضافي وجعل هذه التجربة إيجابية. سأوصي بخدماتكم للآخرين بالتأكيد، وستكونون أول من ألجأ إليه عندما نحتاج إلى المزيد من بيانات السوق.
جون سوزوكي الرئيس والرئيس التنفيذي وعضو مجلس الإدارة, بي كيه تكنولوجيزأود أن أقدّر دعمكم واحترافيتكم في الاستجابة لطلبي للحصول على معلومات بشأن سوق التشخيص المخبري للأمراض المعدية في نيجيريا. كما أُقدّر صبركم وتوجيهكم، واستعدادكم لتقديم خصم، مما مكّننا في النهاية من إتمام الصفقة. أتطلع إلى التعامل مع "ذا إنسايت بارتنرز" مستقبلًا، كل ذلك بفضل الانطباع الذي تركتموه لديّ نتيجةً لهذا اللقاء الأول.
الدكتور تشيجيوك أونيا المدير الإداري, شركة باينكريست للرعاية الصحية المحدودةسبب الشراء
- اتخاذ قرارات مدروسة
- فهم ديناميكيات السوق
- تحليل المنافسة
- رؤى العملاء
- توقعات السوق
- تخفيف المخاطر
- التخطيط الاستراتيجي
- مبررات الاستثمار
- تحديد الأسواق الناشئة
- تحسين استراتيجيات التسويق
- تعزيز الكفاءة التشغيلية
- مواكبة التوجهات التنظيمية


 احصل على عينة مجانية ل - سوق الأسلاك والكابلات