
Marktgröße, Trends, Anteile und Prognose für Drähte und Kabel – 2030
Marktgröße und Prognose für Drähte und Kabel (2021 – 2031), Bericht über globale und regionale Anteile, Trends und Wachstumschancenanalyse: Nach Typ (Kabel, Drähte und Push-Pull-Steuerungen) und Endverbrauchsbranche (Flugzeuge, Transport, Medizin, Marine und Bauwesen) und Geografie
- Status : Veröffentlichte Daten
- Berichtscode : TIPRE00027590
- Kategorie : Elektronik und Halbleiter
- Anzahl der Seiten : 150
- Verfügbare Berichtsformate :


- Datum der letzten Aktualisierung : June 20, 2025

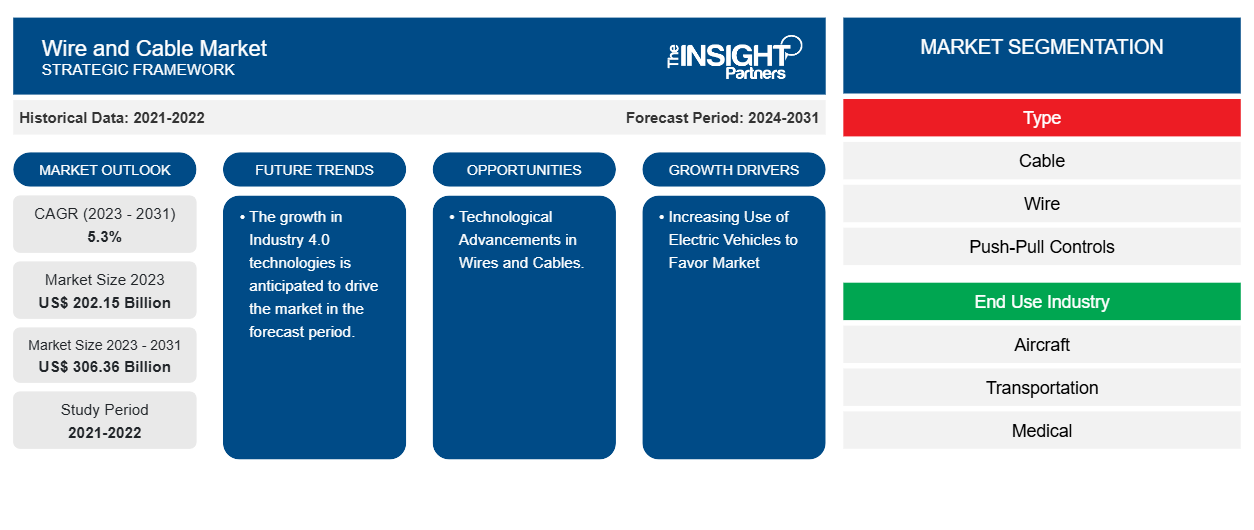
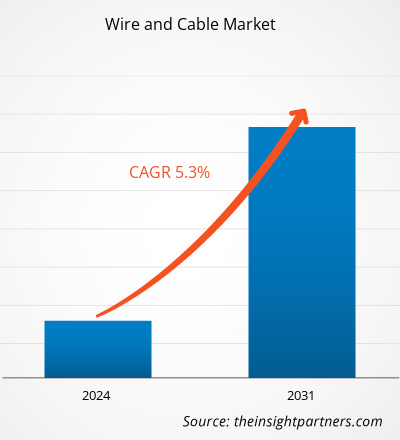
Der Markt für Drähte und Kabel soll von 202,15 Milliarden US-Dollar im Jahr 2023 auf 306,36 Milliarden US-Dollar im Jahr 2031 anwachsen. Der Markt soll zwischen 2023 und 2031 eine durchschnittliche jährliche Wachstumsrate (CAGR) von 5,3 % verzeichnen. Die zunehmende Nutzung von Elektrofahrzeugen und das Wachstum im Bausektor dürften weiterhin wichtige Trends und Treiber des Marktes bleiben.
Draht- und Kabelmarktanalyse
Der Markt für Drähte und Kabel verzeichnet weltweit ein deutliches Wachstum. Dieses Wachstum ist auf die zunehmende Nutzung von Elektrofahrzeugen und das Wachstum im Bausektor zurückzuführen. Darüber hinaus wird erwartet, dass die zunehmende Verwendung von Drähten und Kabeln in der Medizinbranche und die Umsetzung von Industrie 4.0 dem Markt für Drähte und Kabel zahlreiche Chancen eröffnen. Darüber hinaus werden der zunehmende Bedarf an Flugzeugen sowie die Haltbarkeit und Anpassungsfähigkeit von Kabeln und Drähten den Markt ankurbeln.
Draht- und Kabelmarktübersicht
Elektrische Leitungen und Kabel müssen die richtige Größe haben und richtig installiert sein, damit sie eine Elektroprüfung bestehen und die Stromversorgung in Ihrem Haus sicher ist. In diesem Handbuch erfahren Sie, wie Sie zwischen den Arten von elektrischen Leitungen und den Arten von elektrischen Kabeln unterscheiden. Außerdem erfahren Sie, wie Sie für Ihre Projekte zwischen elektrischen Kabeln und Drähten wählen.
Passen Sie diesen Bericht Ihren Anforderungen an
Sie erhalten kostenlose Anpassungen an jedem Bericht, einschließlich Teilen dieses Berichts oder einer Analyse auf Länderebene, eines Excel-Datenpakets sowie tolle Angebote und Rabatte für Start-ups und Universitäten.
Draht- und Kabelmarkt: Strategische Einblicke
-
Holen Sie sich die wichtigsten Markttrends aus diesem Bericht.Dieses KOSTENLOSE Beispiel umfasst eine Datenanalyse von Markttrends bis hin zu Schätzungen und Prognosen.
Treiber und Chancen auf dem Draht- und Kabelmarkt
Zunehmender Einsatz von Elektrofahrzeugen begünstigt den Markt
Elektrofahrzeuge erfreuen sich zunehmender Beliebtheit. Da die Verbrauchernachfrage weiter steigt, steigt auch der Bedarf an Drähten, Kabeln und anderen Ladekomponenten für Elektrofahrzeuge . Stellen Sie sich im Innenleben von Elektrofahrzeugen Drähte als einzelne Leiter und Kabel als Drahtgruppen oder Leiterbündel vor. Die Drähte und Kabel leiten den Strom, der die Fahrzeugbatterie mit Strom versorgt und das Fahrzeug am Laufen hält. Es gibt zwei Arten von Kabeln für Elektrofahrzeuge:
- Batteriekabel – Im Gegensatz zu Niederspannungs-ICE-Kabeln sind sie für höhere elektrische Ströme und Spannungen ausgelegt.
- Ladekabel – werden zum Verbinden des Fahrzeugs mit einer externen Stromquelle verwendet.
EV-Batteriekabel sind für die Stromübertragung zwischen dem Batteriepaket und verschiedenen elektrischen Systemen verantwortlich. Im Gegensatz zu Niederspannungskabeln für Verbrennungsmotoren sind Batteriekabel für Elektro- und Hybridfahrzeuge für höhere Stromstärken und Spannungen ausgelegt und arbeiten mit Spannungen zwischen einigen hundert Volt und über 1.000 Volt. Unter Berücksichtigung der oben genannten Parameter wird erwartet, dass der Markt für Drähte und Kabel in den kommenden Jahren an Dynamik gewinnen wird.
Technologischer Fortschritt bei Drähten und Kabeln.
Technologische Fortschritte bei Drähten und Kabeln finden in verschiedenen Anwendungsbranchen statt, unterstützt durch sich ändernde staatliche Standards und ständige Innovationen. In der Draht- und Kabelindustrie, einschließlich Strom- und Steuerkabeln, wird die technologische Entwicklung in Isolierung und Spannungsklasse unterteilt. Durch das Angebot hochwertigerer Polymere und eine geringere Dicke können die gewünschten elektrischen und mechanischen Eigenschaften sowie eine höhere Spannung erreicht werden. Kabel aus fortschrittlichen Isoliermaterialien können höheren Temperaturen standhalten, sind feuchtigkeits- und chemikalienbeständig und bieten eine bessere elektrische Leistung. Auch die Nanotechnologie wurde erforscht, um Materialeigenschaften zu verbessern. Technologische Fortschritte wie Hochspannungs-Gleichstromkabel (HGÜ) ermöglichen eine Stromübertragung, um Energieverluste zu reduzieren. Diese Technologie wurde durch höhere Spannungswerte und bessere Isolierung verbessert.
Segmentierungsanalyse des Draht- und Kabelmarktberichts
Wichtige Segmente, die zur Ableitung der Draht- und Kabelmarktanalyse beigetragen haben, sind der Typ und die Endverbrauchsbranche.
- Der Markt für Drähte und Kabel wird nach Typ in Kabel-, Draht- und Push-Pull-Steuerungen unterteilt. Das Segment der Power-Management-Komponenten dürfte im Prognosezeitraum einen erheblichen Marktanteil halten.
- Basierend auf der Endverbrauchsindustrie ist der Draht- und Kabelmarkt unterteilt inFlugzeuge, Transport, Medizin, Schifffahrt und Bauwesen. Das Flugzeugsegment wird im Prognosezeitraum voraussichtlich einen erheblichen Marktanteil halten.
Draht- und Kabel-Marktanteilsanalyse nach Geografie
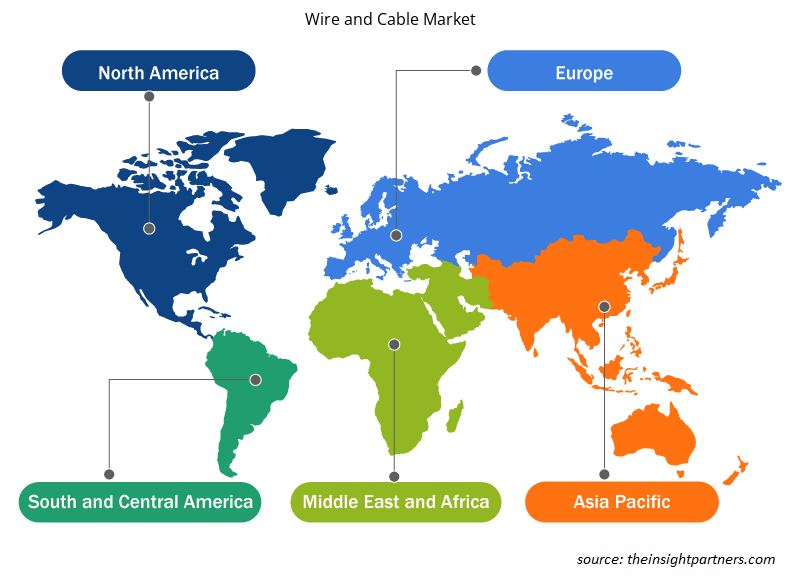
Der geografische Umfang des Draht- und Kabelmarktberichts ist hauptsächlich in fünf Regionen unterteilt: Nordamerika, Asien-Pazifik, Europa, Naher Osten und Afrika sowie Süd- und Mittelamerika.
Nordamerika dominiert den Draht- und Kabelmarkt. Der nordamerikanische Markt ist in die USA, Kanada und Mexiko unterteilt. Hochtechnologische Trends in verschiedenen Branchen in der nordamerikanischen Region haben das Wachstum des Draht- und Kabelmarktes vorangetrieben. Faktoren wie die zunehmende Einführung digitaler Tools und hohe Technologieausgaben von Regierungsbehörden dürften das Wachstum des nordamerikanischen Draht- und Kabelmarktes vorantreiben. Zunehmende Nutzung von Elektrofahrzeugen in der Region.
Darüber hinaus zwingt die starke Betonung von Forschung und Entwicklung in den Industrieländern der USA und Kanadas die nordamerikanischen Akteure dazu, technologisch fortschrittliche Lösungen auf den Markt zu bringen. Darüber hinaus gibt es in den USA eine große Anzahl von Akteuren im Draht- und Kabelmarkt, die sich zunehmend auf die Entwicklung innovativer Lösungen konzentrieren. All diese Faktoren tragen zum Wachstum des Draht- und Kabelmarkts in der Region bei.
Regionale Einblicke in den Draht- und Kabelmarkt
Die regionalen Trends und Faktoren, die den Draht- und Kabelmarkt während des Prognosezeitraums beeinflussen, wurden von den Analysten von Insight Partners ausführlich erläutert. In diesem Abschnitt werden auch die Marktsegmente und die Geografie des Draht- und Kabelmarkts in Nordamerika, Europa, im asiatisch-pazifischen Raum, im Nahen Osten und Afrika sowie in Süd- und Mittelamerika erörtert.
- Erhalten Sie regionale Daten zum Draht- und Kabelmarkt
Umfang des Marktberichts für Drähte und Kabel
| Berichtsattribut | Details |
|---|---|
| Marktgröße im Jahr 2023 | 202,15 Milliarden US-Dollar |
| Marktgröße bis 2031 | 306,36 Milliarden US-Dollar |
| Globale CAGR (2023 - 2031) | 5,3 % |
| Historische Daten | 2021-2022 |
| Prognosezeitraum | 2024–2031 |
| Abgedeckte Segmente |
Nach Typ
|
| Abgedeckte Regionen und Länder |
Nordamerika
|
| Marktführer und wichtige Unternehmensprofile |
|
Marktdichte von Drähten und Kabeln: Auswirkungen auf die Geschäftsdynamik verstehen
Der Markt für Drähte und Kabel wächst rasant. Die Nachfrage der Endverbraucher steigt aufgrund von Faktoren wie sich entwickelnden Verbraucherpräferenzen, technologischen Fortschritten und einem größeren Bewusstsein für die Vorteile des Produkts. Mit der steigenden Nachfrage erweitern Unternehmen ihr Angebot, entwickeln Innovationen, um die Bedürfnisse der Verbraucher zu erfüllen, und nutzen neue Trends, was das Marktwachstum weiter ankurbelt.
Die Marktteilnehmerdichte bezieht sich auf die Verteilung von Firmen oder Unternehmen, die in einem bestimmten Markt oder einer bestimmten Branche tätig sind. Sie gibt an, wie viele Wettbewerber (Marktteilnehmer) in einem bestimmten Marktraum im Verhältnis zu seiner Größe oder seinem gesamten Marktwert präsent sind.
Die wichtigsten auf dem Draht- und Kabelmarkt tätigen Unternehmen sind:
- ASK Automotive Pvt Ltd
- R KABEL
- Bergen Cable Technology
- Elliott-Fertigung
- Carl Stahl Sava Industries, Inc
- LEXCO-KABEL
Haftungsausschluss : Die oben aufgeführten Unternehmen sind nicht in einer bestimmten Reihenfolge aufgeführt.
- Überblick über die wichtigsten Akteure auf dem Draht- und Kabelmarkt
Neuigkeiten und aktuelle Entwicklungen auf dem Draht- und Kabelmarkt
Der Draht- und Kabelmarkt wird durch die Erhebung qualitativer und quantitativer Daten nach Primär- und Sekundärforschung bewertet, die wichtige Unternehmensveröffentlichungen, Verbandsdaten und Datenbanken umfasst. Nachfolgend sind einige der Entwicklungen auf dem Draht- und Kabelmarkt aufgeführt:
- Der Autoersatzteilhersteller NAPA hat einen Katalog mit acht Teilenummern veröffentlicht, um seine brandneue Reihe von Aftermarket-Ladekabeln für Elektrofahrzeuge in Großbritannien auf den Markt zu bringen. (NAPA-Firmenwebsite, September 2022)
- Shell España SA hat 100 % von Cable Energía übernommen, einem spanischen Entwickler und Betreiber von Ladestationen für Elektrofahrzeuge. Durch diese Übernahme kann Shell Fahrern und Flotten an Zielorten in Spanien und Portugal Ladedienste für unterwegs anbieten. Mit dieser Transaktion setzt Shell seine Strategie fort, der weltweit führende Anbieter von Ladestationen für Elektrofahrzeuge zu werden. (Quelle: Shell España SA, Unternehmenswebsite, Juni 2022)
Marktbericht zu Drähten und Kabeln – Umfang und Ergebnisse
Der Bericht „Marktgröße und Prognose für Drähte und Kabel (2021–2031)“ bietet eine detaillierte Analyse des Marktes, die die folgenden Bereiche abdeckt:
- Draht- und Kabelmarktgröße und -prognose auf globaler, regionaler und Länderebene für alle wichtigen Marktsegmente, die im Rahmen des Berichts abgedeckt sind
- Trends und Marktdynamiken im Bereich Drähte und Kabel wie Treiber, Hemmnisse und wichtige Chancen
- Detaillierte PEST/Porters Five Forces- und SWOT-Analyse
- Analyse des Draht- und Kabelmarkts mit Blick auf wichtige Markttrends, globale und regionale Rahmenbedingungen, wichtige Akteure, Vorschriften und aktuelle Marktentwicklungen
- Branchenlandschaft und Wettbewerbsanalyse, einschließlich Marktkonzentration, Heatmap-Analyse, prominenten Akteuren und aktuellen Entwicklungen für den Draht- und Kabelmarkt
- Detaillierte Firmenprofile

Naveen ist ein erfahrener Marktforschungs- und Beratungsexperte mit über 9 Jahren Erfahrung in kundenspezifischen, syndizierten und Beratungsprojekten. In seiner aktuellen Funktion als Associate Vice President hat er erfolgreich Stakeholder entlang der gesamten Projektwertschöpfungskette gemanagt und ist Autor von über 100 Forschungsberichten und über 30 Beratungsaufträgen. Seine Arbeit erstreckt sich auf Industrie- und Regierungsprojekte und trägt maßgeblich zum Kundenerfolg und zur datengesteuerten Entscheidungsfindung bei.
Naveen hat einen Ingenieursabschluss in Elektronik und Kommunikation von der VTU, Karnataka, und einen MBA in Marketing und Operations von der Manipal University. Er ist seit 9 Jahren aktives IEEE-Mitglied und nimmt an Konferenzen und technischen Symposien teil und engagiert sich ehrenamtlich auf Sektions- und regionaler Ebene. Vor seiner aktuellen Position arbeitete er als Associate Strategic Consultant bei IndustryARC und als Industrial Server Consultant bei Hewlett Packard (HP Global).
- Umfassende Analyse der Marktgröße und Prognosen
- Detaillierte Segmentierungsanalyse
- Tiefgehende Bewertung der Marktdynamik
- Einblicke auf regionaler und nationaler Ebene
- Wettbewerbslandschaft und Unternehmens-Benchmarking
- Strategische Business Intelligence
Erfahrungsberichte
Der SCADA-Systemmarktbericht von Insight Partners ist umfassend und bietet wertvolle Einblicke in aktuelle Trends und Zukunftsprognosen. Das Team war durchweg hochprofessionell, reaktionsschnell und hilfsbereit. Wir sind sehr zufrieden und können die Dienstleistungen wärmstens empfehlen.
RAN KEDEM Partner, Reali Technologies LTDsIch habe einen Bericht über einen sehr spezifischen Softwaremarkt angefordert, und das Team hat ihn innerhalb weniger Tage erstellt. Die Informationen waren sehr relevant und gut präsentiert. Anschließend habe ich einige Änderungen und Ergänzungen zum Bericht angefordert. Das Team reagierte erneut sehr schnell, und ich erhielt den Abschlussbericht in weniger als einer Woche.
JEAN-HERVE JENN Vorsitzende, Future AnalyticaWir haben mit The Insight Partners für eine wichtige Marktstudie und Prognose zusammengearbeitet. Sie gaben uns klare Einblicke in Chancen und Risiken, die uns bei der Gestaltung unserer Pläne halfen. Ihre Recherchen waren benutzerfreundlich und basierten auf soliden Daten. Sie halfen uns, kluge und sichere Entscheidungen zu treffen. Wir können sie wärmstens empfehlen.
PIYUSH NAGPAL Sr. Vizepräsident, Fernlicht GlobalDie Insight Partners lieferten aufschlussreiche, gut strukturierte Marktforschung mit fundierter Fachkompetenz. Ihr Team war durchweg professionell und reaktionsschnell. Die benutzerfreundliche Website ermöglichte den Zugriff auf Branchenberichte. Wir empfehlen sie wärmstens für zuverlässige und hochwertige Forschungsdienstleistungen.
YUKIHIKO ADACHI Geschäftsführer, Deep Blue, LLC.Dies ist das erste Mal, dass ich einen Marktbericht von The Insight Partners erworben habe. Obwohl ich zunächst unsicher war, besuchte ich die Website und fühlte mich dann sicherer, das Risiko einzugehen und einen Marktbericht zu kaufen. Ich bin mit der Qualität des Berichts und dem Kundenservice rundum zufrieden. Ich hatte einige Fragen und Anmerkungen zum ersten Bericht, aber nach einigen E-Mail-Gesprächen mit dem Analysten bin ich überzeugt, dass ich einen Bericht habe, den ich als Input für unseren strategischen Planungsprozess verwenden kann. Vielen Dank, dass Sie sich die Zeit genommen und dies zu einer positiven Erfahrung gemacht haben. Ich werde Ihren Service auf jeden Fall weiterempfehlen und Sie werden meine erste Anlaufstelle sein, wenn wir weitere Marktdaten benötigen.
JOHN SUZUKI Präsident und Chief Executive Officer, Vorstandsmitglied, BK TechnologiesIch möchte mich für Ihre Unterstützung und die Professionalität bedanken, die Sie bei der Bearbeitung meiner Informationsanfrage zum IVD-Markt für Infektionskrankheiten in Nigeria gezeigt haben. Ich schätze Ihre Geduld, Ihre Beratung und die Tatsache, dass Sie bereit waren, einen Rabatt anzubieten, der uns schließlich den Abschluss eines Geschäfts ermöglichte. Ich freue mich darauf, The Insight Partners in Zukunft wieder zu beauftragen, dank des Eindrucks, den Sie bei dieser ersten Begegnung bei mir hinterlassen haben.
DR. CHIJIOKE ONYIA GESCHÄFTSFÜHRERIN, PineCrest Healthcare Ltd.Grund zum Kauf
- Fundierte Entscheidungsfindung
- Marktdynamik verstehen
- Wettbewerbsanalyse
- Kundeneinblicke
- Marktprognosen
- Risikominimierung
- Strategische Planung
- Investitionsbegründung
- Identifizierung neuer Märkte
- Verbesserung von Marketingstrategien
- Steigerung der Betriebseffizienz
- Anpassung an regulatorische Trends


