
Marktübersicht für künstliche Gelenke, Wachstum, Trends, Analyse, Forschungsbericht (2021-2031)
Marktgröße und Prognose für künstliche Gelenke (2021 – 2031), Bericht über globale und regionale Anteile, Trends und Wachstumschancenanalyse: Nach Typ (zementierte und nicht zementierte Gelenke), Material (Keramik, Legierungen, Oxinium und andere), Anwendung (künstliche Kniegelenke, künstliche Hüftgelenke, künstliche Schultergelenke und andere), Endbenutzer (Krankenhäuser, ambulante Pflegezentren und andere) und Geografie
- Status : Veröffentlichte Daten
- Berichtscode : TIPHE100001392
- Kategorie : Biowissenschaften
- Anzahl der Seiten : 150
- Verfügbare Berichtsformate :


- Datum der letzten Aktualisierung : February 15, 2025

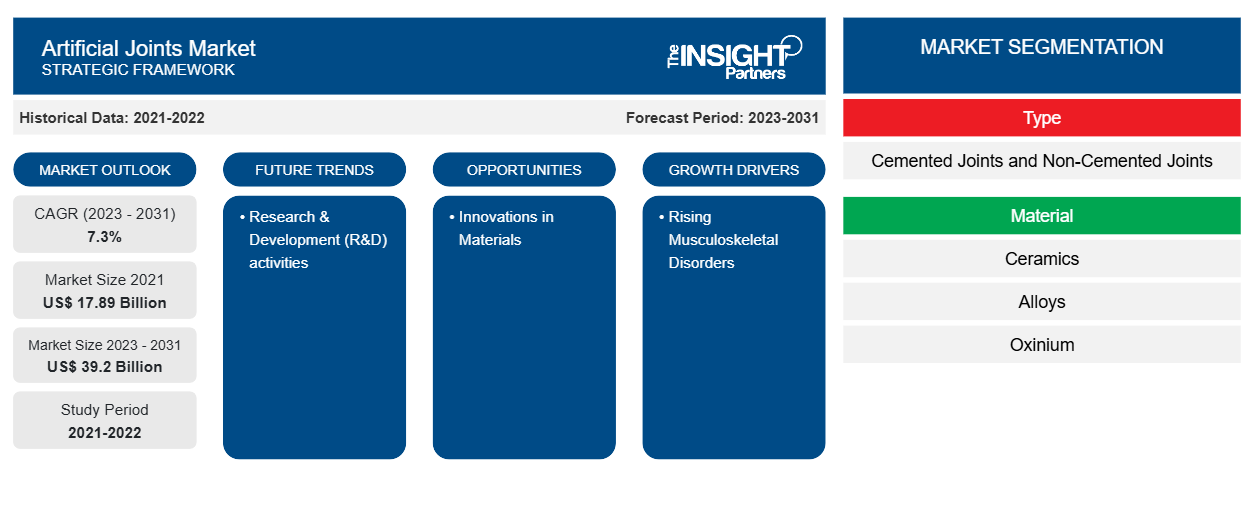
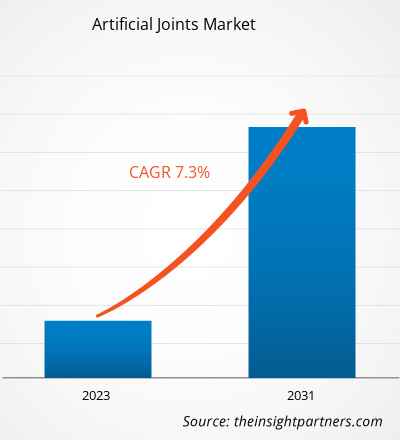
Der Markt für künstliche Gelenke wurde 2021 auf 17,89 Milliarden US-Dollar geschätzt und soll bis 2031 39,2 Milliarden US-Dollar erreichen. Von 2023 bis 2031 wird für den Markt eine durchschnittliche jährliche Wachstumsrate von 7,3 % erwartet. Forschungs- und Entwicklungsaktivitäten (F&E) werden voraussichtlich weiterhin wichtige Trends auf dem Markt für künstliche Gelenke bleiben.JointsMarket was valued at US$ 17.89 billion in 2021 and is expected to reach US$ 39.2 billion by 2031. The market is expected to register a CAGR of 7.3% from 2023–2031. Research & Development (R&D) activities is likely to remain key Artificial Joints Market trends.
Künstliche GelenkeMarktanalyse
Zunahme von Muskel-Skelett-Erkrankungen
Gelenkersatz ist zu einem wesentlichen Faktor für die Erhaltung und Wiederherstellung geworden, um eine breite Palette von muskuloskelettalen Problemen bei muskuloskelettalen Erkrankungen zu behandeln. So wurden beispielsweise im Jahr 2019 in England mehr als 200.000 Hüft- und Kniegelenkersatzoperationen durchgeführt, davon 189 Hüft- und 130 Kniegelenkersatzoperationen. Daher steigt mit der Zunahme von muskuloskelettalen Erkrankungen die Nachfrage nach künstlichen Gelenken. Moderne künstliche Gelenke sind Hightech-Produkte, die aus speziellen Materialien unter Verwendung einzigartiger technologischer Geräte hergestellt werden. Diese Designs werden auf der Grundlage von Systemanalysemethoden, dem physiologischen Zustand der Patienten und der Beseitigung der Komplikationen gerechtfertigt und entwickelt. Daher sind die Entwicklung moderner künstlicher Gelenke mit nicht-invasiver Operationsoption, die für die Patienten weniger schmerzhaft sind, die einflussreichsten Faktoren, die für das Wachstum des Marktes für künstliche Gelenke in den Jahren 2021–2031 verantwortlich sind.
Künstliche GelenkeMarktübersicht
Technologie, Innovation und intelligente technologische Lösungen wie diese beeinflussen künstliche Gelenke weiterhin erheblich. Zunehmende Erkrankungen des Bewegungsapparats und intelligente Technologien bei künstlichen Gelenken sind die einflussreichsten Faktoren, die für das Wachstum des Marktes für künstliche Gelenke verantwortlich sind. Forschungs- und Entwicklungsaktivitäten (F&E) sind ein wichtiger Trend für das Wachstum des Marktes für künstliche Gelenke. Innovationen bei Materialien werden lukrative Marktchancen bieten.
Passen Sie diesen Bericht Ihren Anforderungen an
Sie erhalten kostenlos individuelle Anpassungen an jedem Bericht, einschließlich Teilen dieses Berichts oder einer Analyse auf Länderebene, eines Excel-Datenpakets sowie tolle Angebote und Rabatte für Start-ups und Universitäten.
Markt für künstliche Gelenke: Strategische Einblicke
-
Holen Sie sich die wichtigsten Markttrends aus diesem Bericht.Dieses KOSTENLOSE Beispiel umfasst eine Datenanalyse von Markttrends bis hin zu Schätzungen und Prognosen.
Künstliche GelenkeMarkttreiber und Chancen
Intelligente Technologien für künstliche Gelenke begünstigen den Markt
Hersteller möchten intelligente orthopädische Implantate entwickeln, die den Krankheitsverlauf bei Patienten überwachen. Webster ist ein solcher Hersteller, der intelligente orthopädische Implantate entwickelt, die den Krankheitsverlauf bei Patienten überwachen und die Informationen dann per Funk und Handgerät an medizinisches Fachpersonal übermitteln. Bei einer Infektion könnten die Implantate nicht nur die Ärzte alarmieren, sondern auch ein Medikament freisetzen. Traditionell wird für künstliche Implantate robustes und leichtes Titan verwendet. Webster verwendet jedoch ein anderes Material als Titan mit einer oxidierten Oberfläche, die mit Kohlenstoffnanoröhren beschichtet ist, die als Elektrode fungieren. Durch Anlegen einer Spannung und Messen der Leitfähigkeit der Implantatoberfläche könnten Ärzte mithilfe der Nanoröhren eines der drei Dinge erkennen, die mit einem Implantat passieren können. Daher werden intelligente künstliche Gelenke in den kommenden Jahren einen beträchtlichen Markt erobern, und selbst Top-Hersteller wie Zimmer Biomet werden Geräte entwickeln, die die traditionellen Methoden der künstlichen Gelenkimplantate übertreffen werden.orthopaedic implants that monitor patients progression and then transmit the information to healthcare professionals through radio and a handheld device. If infection occurs, the implants could not only alert doctors, but also can release a drug. Traditionally, strong and lightweight titanium is a material choice for artificial implants. However, Webster is using a different material other than titanium with an oxidized surface that's coated with carbon nanotubes with working as an electrode. By applying a voltage and measuring the conductivity of the implant surface, doctors could use the nanotubes to sense one of the three things that can happen to an implant. Therefore, smart artificial joints will take a considerable market in the coming years and even top manufacturers like Zimmer Biomet will develop devices that will overcome traditional artificial joints implants methods.
Innovationen im Markt für Materialien für künstliche Gelenke – eine Chance
Dank Innovationen bei Operationstechniken sind Eingriffe wie Hüftgelenkersatz und Knieoperationen zur gängigen Praxis geworden. Darüber hinaus bieten Innovationen bei künstlichen Gelenkmaterialien den Herstellern auf lange Sicht lukrative Marktchancen. So kann beispielsweise die Entwicklung eines patentierten Nylontyps als zusätzliche Beschichtung auf der Kunststoffoberfläche eines Gelenkersatzes verwendet werden. Diese Oberfläche bedeckt den Kugelteil eines Kugelgelenks, der normalerweise aus einem „Ultrahochmolekulargewicht-Polyethylen (UHMWPE)“-Material besteht. Darüber hinaus werden derzeit noch Versuche durchgeführt, bei denen Nylonbeschichtungen mit UHMWPE kombiniert werden, um ein neues Material mit spannenden Eigenschaften zu schaffen. Daher bieten Materialinnovationen bei künstlichen Gelenken lukrative Marktchancen, die in den kommenden Jahren für beträchtliche Marktanteile sorgen werden.
Künstliche Gelenke
Marktbericht-Segmentierungsanalyse
Wichtige Segmente, die zur Ableitung der Marktanalyse für künstliche Gelenke beigetragen haben, sind Eignung und Dienstleistungen.
- Basierend auf dem Typ ist der Markt für künstliche Gelenke in zementierte und nicht zementierte Gelenke unterteilt. Die zementierten Gelenke könnten im Jahr 2023 einen größeren Marktanteil haben.
- Basierend auf dem Material ist der Markt für künstliche Gelenke in Keramik, Legierungen, Oxinium und andere unterteilt. Die Keramik könnte im Jahr 2023 einen größeren Marktanteil haben.
- Basierend auf der Anwendung ist der Markt für künstliche Gelenke in künstliche Kniegelenke, künstliche Hüftgelenke, künstliche Schultergelenke und andere unterteilt. Die künstlichen Kniegelenke könnten im Jahr 2023 einen größeren Marktanteil haben.
- Basierend auf dem Endverbraucher ist der Markt für künstliche Gelenke in Krankenhäuser, ambulante Pflegezentren und andere unterteilt. Die Krankenhäuser könnten im Jahr 2023 einen größeren Marktanteil halten.
Künstliche Gelenke Marktanteilsanalyse nach Geografie
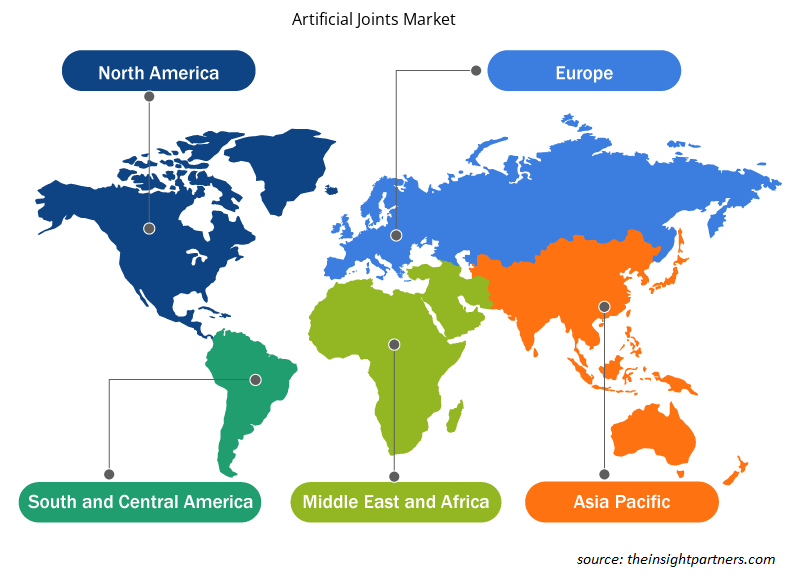
Der geografische Umfang des Marktberichts für künstliche Gelenke ist hauptsächlich in fünf Regionen unterteilt: Nordamerika, Asien-Pazifik, Europa, Naher Osten und Afrika sowie Südamerika/Süd- und Mittelamerika.
Nordamerika dominiert den Markt für künstliche Gelenke. In Nordamerika haben die USA einen beträchtlichen Anteil an künstlichen Gelenken. Die Präsenz führender Medizinproduktehersteller in den USA und steigende F&E-Aktivitäten im Bereich Materialien sind die einflussreichsten Faktoren für das Marktwachstum. Der asiatisch-pazifische Raum wird in den kommenden Jahren voraussichtlich die höchste durchschnittliche jährliche Wachstumsrate aufweisen.
Künstliche Gelenke
Umfang des Marktberichts
Regionale Einblicke in den Markt für künstliche Gelenke
Die regionalen Trends und Faktoren, die den Markt für künstliche Gelenke im gesamten Prognosezeitraum beeinflussen, wurden von den Analysten von Insight Partners ausführlich erläutert. In diesem Abschnitt werden auch die Marktsegmente und die Geografie für künstliche Gelenke in Nordamerika, Europa, im asiatisch-pazifischen Raum, im Nahen Osten und Afrika sowie in Süd- und Mittelamerika erörtert.
- Erhalten Sie regionale Daten zum Markt für künstliche Gelenke
Umfang des Marktberichts über künstliche Gelenke
| Berichtsattribut | Details |
|---|---|
| Marktgröße im Jahr 2021 | 17,89 Milliarden US-Dollar |
| Marktgröße bis 2031 | 39,2 Milliarden US-Dollar |
| Globale CAGR (2023 - 2031) | 7,3 % |
| Historische Daten | 2021-2022 |
| Prognosezeitraum | 2023–2031 |
| Abgedeckte Segmente |
Nach Typ
|
| Abgedeckte Regionen und Länder |
Nordamerika
|
| Marktführer und wichtige Unternehmensprofile |
|
Marktteilnehmerdichte: Der Einfluss auf die Geschäftsdynamik
Der Markt für künstliche Gelenke wächst rasant, angetrieben durch die steigende Nachfrage der Endnutzer aufgrund von Faktoren wie sich entwickelnden Verbraucherpräferenzen, technologischen Fortschritten und einem größeren Bewusstsein für die Vorteile des Produkts. Mit steigender Nachfrage erweitern Unternehmen ihr Angebot, entwickeln Innovationen, um die Bedürfnisse der Verbraucher zu erfüllen, und nutzen neue Trends, was das Marktwachstum weiter ankurbelt.
Die Marktteilnehmerdichte bezieht sich auf die Verteilung der Firmen oder Unternehmen, die in einem bestimmten Markt oder einer bestimmten Branche tätig sind. Sie gibt an, wie viele Wettbewerber (Marktteilnehmer) in einem bestimmten Marktraum im Verhältnis zu seiner Größe oder seinem gesamten Marktwert präsent sind.
Die wichtigsten auf dem Markt für künstliche Gelenke tätigen Unternehmen sind:
- Zimmer Biomet,
- Smith & Neffe,
- Stryker,
- Medtronic,
- Johnson & Johnson Services, Inc.,
- Exactech, Inc.,
Haftungsausschluss : Die oben aufgeführten Unternehmen sind nicht in einer bestimmten Reihenfolge aufgeführt.
- Überblick über die wichtigsten Akteure auf dem Markt für künstliche Gelenke
Künstliche GelenkeMarktnachrichten und aktuelle Entwicklungen
Der Markt für künstliche Gelenke wird durch die Erfassung qualitativer und quantitativer Daten nach Primär- und Sekundärforschung bewertet, die wichtige Unternehmensveröffentlichungen, Verbandsdaten und Datenbanken umfasst. Im Folgenden finden Sie eine Liste der Entwicklungen auf dem Markt für künstliche Gelenke und Strategien:
- Im Februar 2020 kündigte RSIP Vision die Einführung einer computergestützten Bildverarbeitungstechnologie an, um Knochen vor Knie- und Hüftersatzoperationen genauer zu visualisieren und so menschliche Fehler zu reduzieren.
Künstliche GelenkeMarktbericht - Abdeckung und Ergebnisse
Der Bericht „Marktgröße und Prognose für künstliche Gelenke (2021–2031)“ bietet eine detaillierte Analyse des Marktes, die die folgenden Bereiche abdeckt:
- Marktgröße und Prognose auf globaler, regionaler und Länderebene für alle wichtigen Marktsegmente, die im Rahmen des Projekts abgedeckt sind
- Marktdynamik wie Treiber, Beschränkungen und wichtige Chancen
- Wichtige Zukunftstrends
- Detaillierte PEST/Porters Five Forces- und SWOT-Analyse
- Globale und regionale Marktanalyse mit wichtigen Markttrends, wichtigen Akteuren, Vorschriften und aktuellen Marktentwicklungen
- Branchenlandschaft und Wettbewerbsanalyse, einschließlich Marktkonzentration, Heatmap-Analyse, prominenten Akteuren und aktuellen Entwicklungen
- Detaillierte Firmenprofile

Mrinal ist eine erfahrene Research-Analystin mit über 8 Jahren Erfahrung in der Marktanalyse und Beratung im Bereich Life Sciences. Mit ihrer strategischen Denkweise und ihrem unerschütterlichen Streben nach Exzellenz hat sie sich umfassende Expertise in den Bereichen Pharmaprognosen, Marktchancenbewertung und Entwicklung von Branchen-Benchmarks angeeignet. Ihre Arbeit konzentriert sich darauf, umsetzbare Erkenntnisse zu liefern, die Kunden fundierte strategische Entscheidungen ermöglichen. Mrinals Kernkompetenz liegt in der Übersetzung komplexer quantitativer Datensätze in aussagekräftige Geschäftsinformationen. Ihr analytischer Scharfsinn ist entscheidend für die Entwicklung von Go-to-Market-Strategien (GTM) und die Erschließung von Wachstumschancen in der Pharma- und Medizinproduktebranche. Als vertrauenswürdige Beraterin konzentriert sie sich konsequent auf die Optimierung von Arbeitsabläufen und die Etablierung von Best Practices, um so Innovation und Betriebseffizienz für ihre Kunden zu fördern.
- Umfassende Analyse der Marktgröße und Prognosen
- Detaillierte Segmentierungsanalyse
- Tiefgehende Bewertung der Marktdynamik
- Einblicke auf regionaler und nationaler Ebene
- Wettbewerbslandschaft und Unternehmens-Benchmarking
- Strategische Business Intelligence
Erfahrungsberichte
Der SCADA-Systemmarktbericht von Insight Partners ist umfassend und bietet wertvolle Einblicke in aktuelle Trends und Zukunftsprognosen. Das Team war durchweg hochprofessionell, reaktionsschnell und hilfsbereit. Wir sind sehr zufrieden und können die Dienstleistungen wärmstens empfehlen.
RAN KEDEM Partner, Reali Technologies LTDsIch habe einen Bericht über einen sehr spezifischen Softwaremarkt angefordert, und das Team hat ihn innerhalb weniger Tage erstellt. Die Informationen waren sehr relevant und gut präsentiert. Anschließend habe ich einige Änderungen und Ergänzungen zum Bericht angefordert. Das Team reagierte erneut sehr schnell, und ich erhielt den Abschlussbericht in weniger als einer Woche.
JEAN-HERVE JENN Vorsitzende, Future AnalyticaWir haben mit The Insight Partners für eine wichtige Marktstudie und Prognose zusammengearbeitet. Sie gaben uns klare Einblicke in Chancen und Risiken, die uns bei der Gestaltung unserer Pläne halfen. Ihre Recherchen waren benutzerfreundlich und basierten auf soliden Daten. Sie halfen uns, kluge und sichere Entscheidungen zu treffen. Wir können sie wärmstens empfehlen.
PIYUSH NAGPAL Sr. Vizepräsident, Fernlicht GlobalDie Insight Partners lieferten aufschlussreiche, gut strukturierte Marktforschung mit fundierter Fachkompetenz. Ihr Team war durchweg professionell und reaktionsschnell. Die benutzerfreundliche Website ermöglichte den Zugriff auf Branchenberichte. Wir empfehlen sie wärmstens für zuverlässige und hochwertige Forschungsdienstleistungen.
YUKIHIKO ADACHI Geschäftsführer, Deep Blue, LLC.Dies ist das erste Mal, dass ich einen Marktbericht von The Insight Partners erworben habe. Obwohl ich zunächst unsicher war, besuchte ich die Website und fühlte mich dann sicherer, das Risiko einzugehen und einen Marktbericht zu kaufen. Ich bin mit der Qualität des Berichts und dem Kundenservice rundum zufrieden. Ich hatte einige Fragen und Anmerkungen zum ersten Bericht, aber nach einigen E-Mail-Gesprächen mit dem Analysten bin ich überzeugt, dass ich einen Bericht habe, den ich als Input für unseren strategischen Planungsprozess verwenden kann. Vielen Dank, dass Sie sich die Zeit genommen und dies zu einer positiven Erfahrung gemacht haben. Ich werde Ihren Service auf jeden Fall weiterempfehlen und Sie werden meine erste Anlaufstelle sein, wenn wir weitere Marktdaten benötigen.
JOHN SUZUKI Präsident und Chief Executive Officer, Vorstandsmitglied, BK TechnologiesIch möchte mich für Ihre Unterstützung und die Professionalität bedanken, die Sie bei der Bearbeitung meiner Informationsanfrage zum IVD-Markt für Infektionskrankheiten in Nigeria gezeigt haben. Ich schätze Ihre Geduld, Ihre Beratung und die Tatsache, dass Sie bereit waren, einen Rabatt anzubieten, der uns schließlich den Abschluss eines Geschäfts ermöglichte. Ich freue mich darauf, The Insight Partners in Zukunft wieder zu beauftragen, dank des Eindrucks, den Sie bei dieser ersten Begegnung bei mir hinterlassen haben.
DR. CHIJIOKE ONYIA GESCHÄFTSFÜHRERIN, PineCrest Healthcare Ltd.Grund zum Kauf
- Fundierte Entscheidungsfindung
- Marktdynamik verstehen
- Wettbewerbsanalyse
- Kundeneinblicke
- Marktprognosen
- Risikominimierung
- Strategische Planung
- Investitionsbegründung
- Identifizierung neuer Märkte
- Verbesserung von Marketingstrategien
- Steigerung der Betriebseffizienz
- Anpassung an regulatorische Trends


