
Marktanalyse und Prognose für elektrische Bedienfelder nach Größe, Anteil, Wachstum, Trends 2030
Marktprognose für elektrische Bedienfelder bis 2030 – Auswirkungen von COVID-19 und globale Analyse nach Form (geschlossen und offen), Typ (Niederspannung und Mittel- und Hochspannung) und Branche (Fertigung, Chemie, Automobil, Lebensmittel und Getränke, Energie, Öl und Gas, Pharmazie, Luft- und Raumfahrt und Verteidigung und andere)
- Status : Veröffentlicht
- Berichtscode : TIPRE00015709
- Kategorie : Elektronik und Halbleiter
- Anzahl der Seiten : 150
- Verfügbare Berichtsformate :


- Datum der letzten Aktualisierung : November 19, 2025

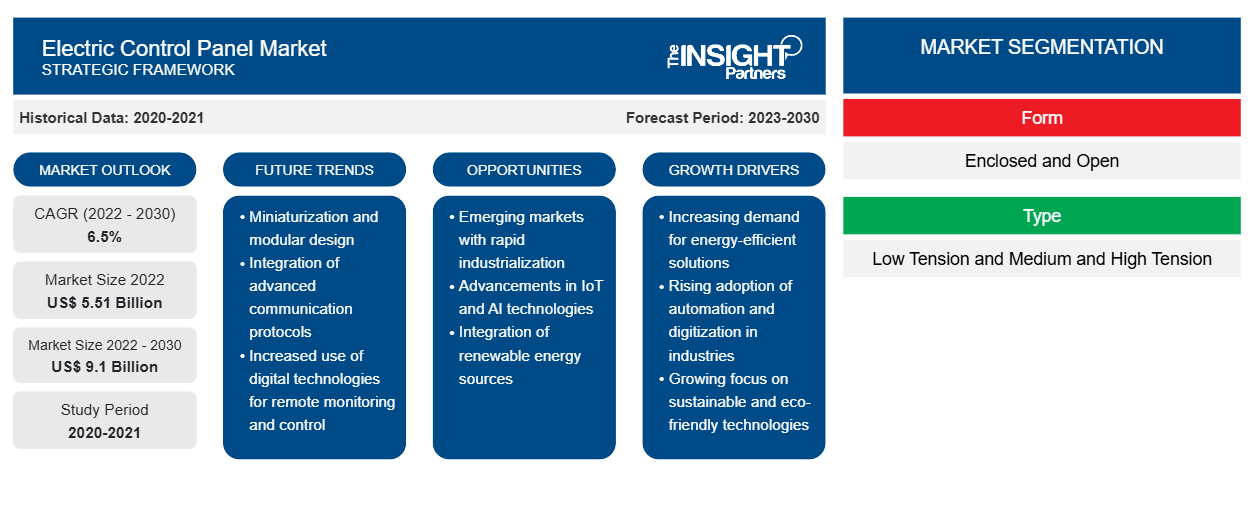
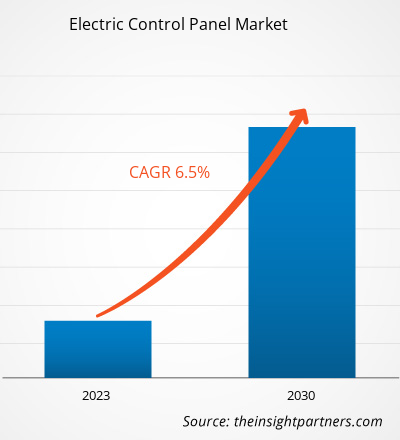
Der Markt für elektrische Schalttafeln soll von 5.507,35 Millionen US-Dollar im Jahr 2022 auf 9.096,16 Millionen US-Dollar im Jahr 2030 wachsen; von 2022 bis 2030 wird mit einer durchschnittlichen jährlichen Wachstumsrate von 6,5 % gerechnet.
Elektrische Schalttafeln sind starre Gehäuse, die elektrische Geräte kombinieren, die elektrische Energie verwenden, um die Funktionen von Maschinen oder mechanischen Geräten zu überwachen und zu steuern. Sie bestehen aus zwei Teilen – elektrischen Komponenten und Schalttafelgehäuse. Die Zusammensetzung elektrischer Schalttafeln variiert je nach Branche und sie können entsprechend angepasst werden. Die elektrischen Schalttafeln verfügen über Steuerungen, Schaltanlagen, Anzeigelampen, Relais, Drucktasten und SPS. Die Verteilertafeln sind mit Sicherheits-/Schutzhinweisen in Bezug auf Phasenumkehr, Nieder- und Hochspannungsrelais, einfache Phasenvermeidung, Phasenungleichgewicht, Rückleistung, Über- und Unterfrequenzrelais, eingeschränkten Erdschluss usw. ausgestattet. Schalttafeln sind entweder offen oder geschlossen und enthalten die Steuerung von Schaltkreiskomponenten oder die Steuerung von Stromkreiskomponenten oder eine Kombination aus beidem. Die elektrische Schalttafel arbeitet mit einer Vielzahl von Industriegeräten, darunter Motoren, Pumpen, Industriemaschinen, Heizgeräte, Maschinen, HLK-Systeme , Beleuchtung usw. Das Entwerfen und Einsetzen elektrischer Schalttafeln kann ein komplizierter Prozess sein, da selbst ein kleiner Fehler in diesen Schalttafeln große Probleme verursachen kann. Daher müssen Unternehmen Schalttafeln von einer vertrauenswürdigen Marke beschaffen, die nach Industriestandards zertifiziert ist.
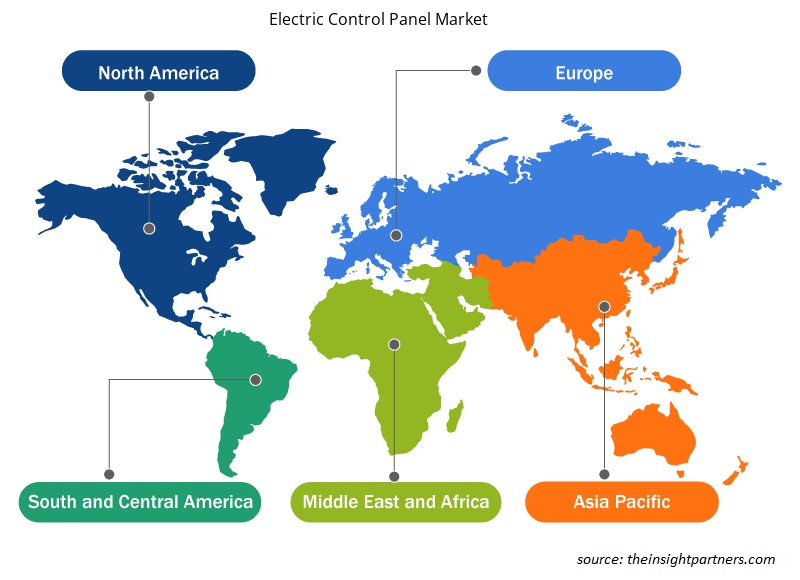
Der asiatisch-pazifische Raum dominierte 2021 den Marktanteil von elektrischen Bedienfeldern mit mehr als 40 %, gefolgt von Nordamerika, Europa, dem MEA und SAM. Die Region ist Heimat fast aller Arten von Branchen, die Endverbraucher von elektrischen Bedienfeldern sein können, wie z. B. Fertigungsindustrie, Lebensmittel- und Getränkeindustrie, Pharmaindustrie und Chemieindustrie. Darüber hinaus ist die große Präsenz von Akteuren auf dem Markt für elektrische Bedienfelder – wie IndustLabs, EBI Electric, PanelTEK und PanelShop.com – einer der Hauptfaktoren, die das Wachstum des Marktes für elektrische Bedienfelder in der Region ankurbeln.
Pharmaunternehmen in europäischen Ländern sind die Hauptendverbraucher von elektrischen Bedienfeldern. Mit der wachsenden Zahl von Krankenhäusern und Kliniken steigt auch die Nachfrage nach elektrischen Bedienfeldern in der Region. APAC umfasst mehrere Entwicklungsländer, darunter China, Indien, Singapur, Vietnam und andere südostasiatische Länder, sowie Industrieländer wie Japan und Australien. Die florierenden Energie- und Fertigungssektoren in China, Japan, Taiwan, Indien und Südkorea dürften lukrative Möglichkeiten für die Akteure auf dem Markt für elektrische Bedienfelder schaffen. Darüber hinaus erleben die Länder im MEA und SAM aufgrund der wachsenden Geschäftstätigkeit in Öl- und Erdölraffinerien, Energieversorgern und der Automobilindustrie auch die Einführung von elektrischen Bedienfeldern, was das Marktwachstum für elektrische Bedienfelder in diesen Regionen im Prognosezeitraum voraussichtlich ankurbeln wird.
Passen Sie diesen Bericht Ihren Anforderungen an
Sie erhalten kostenlos individuelle Anpassungen an jedem Bericht, einschließlich Teilen dieses Berichts oder einer Analyse auf Länderebene, eines Excel-Datenpakets sowie tolle Angebote und Rabatte für Start-ups und Universitäten.
Markt für elektrische Bedienfelder: Strategische Einblicke
-
Holen Sie sich die wichtigsten Markttrends aus diesem Bericht.Dieses KOSTENLOSE Beispiel umfasst eine Datenanalyse von Markttrends bis hin zu Schätzungen und Prognosen.
Auswirkungen der COVID-19-Pandemie auf den Markt für elektrische Bedienfelder
Verschiedene Volkswirtschaften im asiatisch-pazifischen Raum verzeichneten im Jahr 2020 einen starken Rückgang ihres Bruttoinlandsprodukts (BIP) aufgrund des plötzlichen Stillstands vieler Wirtschaftsaktivitäten in der gesamten Region. Die Länder dieser Region verfügen über bedeutende Öl- und Gas-, Schifffahrts- und Telekommunikationsindustrien. Laut der Organisation für wirtschaftliche Zusammenarbeit und Entwicklung (OECD) waren Länder wie Indien, Australien, China und Japan von der Pandemie schwer betroffen. Indien war das am schlimmsten von der Pandemie betroffene Land in dieser Region. Die von den Regierungen verhängten Beschränkungen zur Eindämmung der Ausbreitung von COVID-19 in der Anfangsphase der Krise beeinträchtigten den Produktionsprozess in diesen Ländern aufgrund der begrenzten Verfügbarkeit von Arbeitskräften, was das Wachstum des Marktes für elektrische Schalttafeln im Jahr 2020 behinderte. Die Pandemie hatte jedoch nur geringe Auswirkungen auf den Energiesektor, was dazu beitrug, dass während der Pandemie weiterhin Nachfrage nach elektrischen Schalttafeln in diesem Sektor bestand.
Mit der Wiedereröffnung der Wirtschaft und der Wiederaufnahme des Betriebs im Jahr 2021 stieg der Bedarf verschiedener Endverbraucher an elektrischen Schalttafeln allmählich. Aufgrund groß angelegter Impfbemühungen und der Lockerung sozialer Beschränkungen begannen die Unternehmen zudem, mit hohen Belegschaftskapazitäten zu arbeiten.
Markteinblicke – Markt für elektrische Schalttafeln
Der asiatisch-pazifische Raum dominierte 2021 den Markt für elektrische Schalttafeln und wird seine Dominanz voraussichtlich während des gesamten Prognosezeitraums beibehalten. Die meisten Regierungsbehörden gehen davon aus, die Ziele der Industrie 4.0 innerhalb der nächsten fünf Jahre zu erreichen. Um dies in den Standards der Industrie 4.0 zu erreichen, wären wirksame gesetzliche Rahmenbedingungen erforderlich, wie etwa die Bereitstellung eines neuen Spektrums für eine bessere Konnektivität und die Förderung der Kreativität bei neuen Lösungen. Der Mudigubba Solar Park 2000 MW ist ein Projekt mit einem Budget von 2.400 Millionen US-Dollar. Die Bauarbeiten begannen im 3. Quartal 2021 und sollen im 4. Quartal 2023 abgeschlossen sein. Das Projekt zielt darauf ab, den Agrarsektor neun Stunden lang während der Tageslichtstunden mit Strom zu versorgen. Unter Berücksichtigung aller oben genannten Faktoren werden diese Energieprojekte und der Anstieg der Nachfrage nach Elektrizität die Nachfrage nach Schalttafeln erzeugen und so den Markt für elektrische Schalttafeln im asiatisch-pazifischen Raum ankurbeln.
Branchenbasierte Einblicke
Der Markt für elektrische Bedienfelder ist branchenbezogen in Fertigung, Chemie, Automobil, Lebensmittel und Getränke, Energie, Öl und Gas, Pharmazie, Luft- und Raumfahrt und Verteidigung sowie Sonstige unterteilt. Das Segment Sonstige umfasst die Schifffahrts- und Textilindustrie. Die Art des verwendeten Bedienfelds variiert je nach Branche und den Anforderungen der jeweiligen Branche.
Der Markt für elektrische Schalttafeln ist nach Form, Typ, Branche und Geografie segmentiert. Basierend auf der Form ist der Markt für elektrische Schalttafeln in geschlossene und offene unterteilt. Basierend auf dem Typ ist der Markt für elektrische Schalttafeln in Niederspannung und Mittel- und Hochspannung unterteilt. Nach Branchen ist der Markt in Fertigung, Chemie, Automobil, Lebensmittel und Getränke, Energie, Öl und Gas, Pharmazie, Luft- und Raumfahrt und Verteidigung und andere segmentiert. Basierend auf der Geografie ist der Markt für elektrische Schalttafeln hauptsächlich in Nordamerika, Europa, Asien-Pazifik (APAC), Naher Osten und Afrika (MEA) sowie Süd- und Mittelamerika unterteilt.
Regionale Einblicke in den Markt für elektrische Bedienfelder
Die regionalen Trends und Faktoren, die den Markt für elektrische Bedienfelder im Prognosezeitraum beeinflussen, wurden von den Analysten von Insight Partners ausführlich erläutert. In diesem Abschnitt werden auch die Marktsegmente und die Geografie von elektrischen Bedienfeldern in Nordamerika, Europa, im asiatisch-pazifischen Raum, im Nahen Osten und Afrika sowie in Süd- und Mittelamerika erörtert.
- Erhalten Sie regionale Daten zum Markt für elektrische Bedienfelder
Umfang des Marktberichts über elektrische Bedienfelder
| Berichtsattribut | Details |
|---|---|
| Marktgröße im Jahr 2022 | 5,51 Milliarden US-Dollar |
| Marktgröße bis 2030 | 9,1 Milliarden US-Dollar |
| Globale CAGR (2022 - 2030) | 6,5 % |
| Historische Daten | 2020-2021 |
| Prognosezeitraum | 2023–2030 |
| Abgedeckte Segmente |
Nach Formular
|
| Abgedeckte Regionen und Länder |
Nordamerika
|
| Marktführer und wichtige Unternehmensprofile |
|
Dichte der Marktteilnehmer für elektrische Schalttafeln: Die Auswirkungen auf die Geschäftsdynamik verstehen
Der Markt für elektrische Bedienfelder wächst rasant, angetrieben durch die steigende Nachfrage der Endnutzer aufgrund von Faktoren wie sich entwickelnden Verbraucherpräferenzen, technologischen Fortschritten und einem größeren Bewusstsein für die Vorteile des Produkts. Mit steigender Nachfrage erweitern Unternehmen ihr Angebot, entwickeln Innovationen, um die Bedürfnisse der Verbraucher zu erfüllen, und nutzen neue Trends, was das Marktwachstum weiter ankurbelt.
Die Marktteilnehmerdichte bezieht sich auf die Verteilung von Firmen oder Unternehmen, die in einem bestimmten Markt oder einer bestimmten Branche tätig sind. Sie gibt an, wie viele Wettbewerber (Marktteilnehmer) in einem bestimmten Marktraum im Verhältnis zu seiner Größe oder seinem gesamten Marktwert präsent sind.
Die wichtigsten auf dem Markt für elektrische Bedienfelder tätigen Unternehmen sind:
- ABB Ltd.
- Bectrol
- Cetal
- Eaton
- Leviton Manufacturing Co., Ltd.
Haftungsausschluss : Die oben aufgeführten Unternehmen sind nicht in einer bestimmten Reihenfolge aufgeführt.
- Überblick über die wichtigsten Akteure auf dem Markt für elektrische Schalttafeln
ABB Ltd.; Bectrol; Cetal; Eaton; Leviton Manufacturing Co., Ltd.; RITTAL GMBH & CO. KG; Rockwell Automation, Inc.; Schneider Electric SE; Siemens AG; und SIMON PROtec sind einige der wichtigsten Akteure im Ökosystem, die im Rahmen der Marktanalyse für elektrische Schalttafeln profiliert wurden. Neben diesen 10 Akteuren wurden im Rahmen dieser Studie auch mehrere andere prominente globale und regionale Unternehmen, aufstrebende Akteure, Marktstörer und Nischenmarktakteure analysiert.
Die Akteure auf dem Markt für elektrische Schalttafeln konzentrieren sich hauptsächlich auf die Entwicklung fortschrittlicher und effizienter Produkte.
- Im Februar 2022 führte ABB India, ein Hersteller von Maschinenbau und Industrieausrüstung, eine neue Produktlinie von Messgeräten zur elektrischen Messung und Leistungsüberwachung für Schalttafeln und Bedienfelder ein.
- Im November 2020 kündigte das Unternehmen der Siemens AG für intelligente, adaptive Infrastruktur die Integration von Control Panel Design in das TIA Selection Tool an und fügte der Konfigurations- und Bestellsoftware von Siemens damit zusätzliche Tools zur Elektroplanung hinzu.

Naveen ist ein erfahrener Marktforschungs- und Beratungsexperte mit über 9 Jahren Erfahrung in kundenspezifischen, syndizierten und Beratungsprojekten. In seiner aktuellen Funktion als Associate Vice President hat er erfolgreich Stakeholder entlang der gesamten Projektwertschöpfungskette gemanagt und ist Autor von über 100 Forschungsberichten und über 30 Beratungsaufträgen. Seine Arbeit erstreckt sich auf Industrie- und Regierungsprojekte und trägt maßgeblich zum Kundenerfolg und zur datengesteuerten Entscheidungsfindung bei.
Naveen hat einen Ingenieursabschluss in Elektronik und Kommunikation von der VTU, Karnataka, und einen MBA in Marketing und Operations von der Manipal University. Er ist seit 9 Jahren aktives IEEE-Mitglied und nimmt an Konferenzen und technischen Symposien teil und engagiert sich ehrenamtlich auf Sektions- und regionaler Ebene. Vor seiner aktuellen Position arbeitete er als Associate Strategic Consultant bei IndustryARC und als Industrial Server Consultant bei Hewlett Packard (HP Global).
- Umfassende Analyse der Marktgröße und Prognosen
- Detaillierte Segmentierungsanalyse
- Tiefgehende Bewertung der Marktdynamik
- Einblicke auf regionaler und nationaler Ebene
- Wettbewerbslandschaft und Unternehmens-Benchmarking
- Strategische Business Intelligence
Erfahrungsberichte
Der SCADA-Systemmarktbericht von Insight Partners ist umfassend und bietet wertvolle Einblicke in aktuelle Trends und Zukunftsprognosen. Das Team war durchweg hochprofessionell, reaktionsschnell und hilfsbereit. Wir sind sehr zufrieden und können die Dienstleistungen wärmstens empfehlen.
RAN KEDEM Partner, Reali Technologies LTDsIch habe einen Bericht über einen sehr spezifischen Softwaremarkt angefordert, und das Team hat ihn innerhalb weniger Tage erstellt. Die Informationen waren sehr relevant und gut präsentiert. Anschließend habe ich einige Änderungen und Ergänzungen zum Bericht angefordert. Das Team reagierte erneut sehr schnell, und ich erhielt den Abschlussbericht in weniger als einer Woche.
JEAN-HERVE JENN Vorsitzende, Future AnalyticaWir haben mit The Insight Partners für eine wichtige Marktstudie und Prognose zusammengearbeitet. Sie gaben uns klare Einblicke in Chancen und Risiken, die uns bei der Gestaltung unserer Pläne halfen. Ihre Recherchen waren benutzerfreundlich und basierten auf soliden Daten. Sie halfen uns, kluge und sichere Entscheidungen zu treffen. Wir können sie wärmstens empfehlen.
PIYUSH NAGPAL Sr. Vizepräsident, Fernlicht GlobalDie Insight Partners lieferten aufschlussreiche, gut strukturierte Marktforschung mit fundierter Fachkompetenz. Ihr Team war durchweg professionell und reaktionsschnell. Die benutzerfreundliche Website ermöglichte den Zugriff auf Branchenberichte. Wir empfehlen sie wärmstens für zuverlässige und hochwertige Forschungsdienstleistungen.
YUKIHIKO ADACHI Geschäftsführer, Deep Blue, LLC.Dies ist das erste Mal, dass ich einen Marktbericht von The Insight Partners erworben habe. Obwohl ich zunächst unsicher war, besuchte ich die Website und fühlte mich dann sicherer, das Risiko einzugehen und einen Marktbericht zu kaufen. Ich bin mit der Qualität des Berichts und dem Kundenservice rundum zufrieden. Ich hatte einige Fragen und Anmerkungen zum ersten Bericht, aber nach einigen E-Mail-Gesprächen mit dem Analysten bin ich überzeugt, dass ich einen Bericht habe, den ich als Input für unseren strategischen Planungsprozess verwenden kann. Vielen Dank, dass Sie sich die Zeit genommen und dies zu einer positiven Erfahrung gemacht haben. Ich werde Ihren Service auf jeden Fall weiterempfehlen und Sie werden meine erste Anlaufstelle sein, wenn wir weitere Marktdaten benötigen.
JOHN SUZUKI Präsident und Chief Executive Officer, Vorstandsmitglied, BK TechnologiesIch möchte mich für Ihre Unterstützung und die Professionalität bedanken, die Sie bei der Bearbeitung meiner Informationsanfrage zum IVD-Markt für Infektionskrankheiten in Nigeria gezeigt haben. Ich schätze Ihre Geduld, Ihre Beratung und die Tatsache, dass Sie bereit waren, einen Rabatt anzubieten, der uns schließlich den Abschluss eines Geschäfts ermöglichte. Ich freue mich darauf, The Insight Partners in Zukunft wieder zu beauftragen, dank des Eindrucks, den Sie bei dieser ersten Begegnung bei mir hinterlassen haben.
DR. CHIJIOKE ONYIA GESCHÄFTSFÜHRERIN, PineCrest Healthcare Ltd.Grund zum Kauf
- Fundierte Entscheidungsfindung
- Marktdynamik verstehen
- Wettbewerbsanalyse
- Kundeneinblicke
- Marktprognosen
- Risikominimierung
- Strategische Planung
- Investitionsbegründung
- Identifizierung neuer Märkte
- Verbesserung von Marketingstrategien
- Steigerung der Betriebseffizienz
- Anpassung an regulatorische Trends


