
Marktstrategien für Gelenkschmerzinjektionen, Top-Player, Wachstumschancen, Analyse und Prognose bis 2028
Marktprognose für Gelenkschmerzinjektionen bis 2028 – Auswirkungen von COVID-19 und globale Analyse nach Arzneimittel (Hyaluronsäure, Kortikosteroide und andere), Gelenktyp (Knie, Fuß und Knöchel, Schulter und Ellenbogen, Hüfte und andere) und Vertriebskanal (Apotheken, Krankenhausapotheken und andere)
- Status : Veröffentlicht
- Berichtscode : TIPRE00003536
- Kategorie : Biowissenschaften
- Anzahl der Seiten : 162
- Verfügbare Berichtsformate :


- Datum der letzten Aktualisierung : June 13, 2024

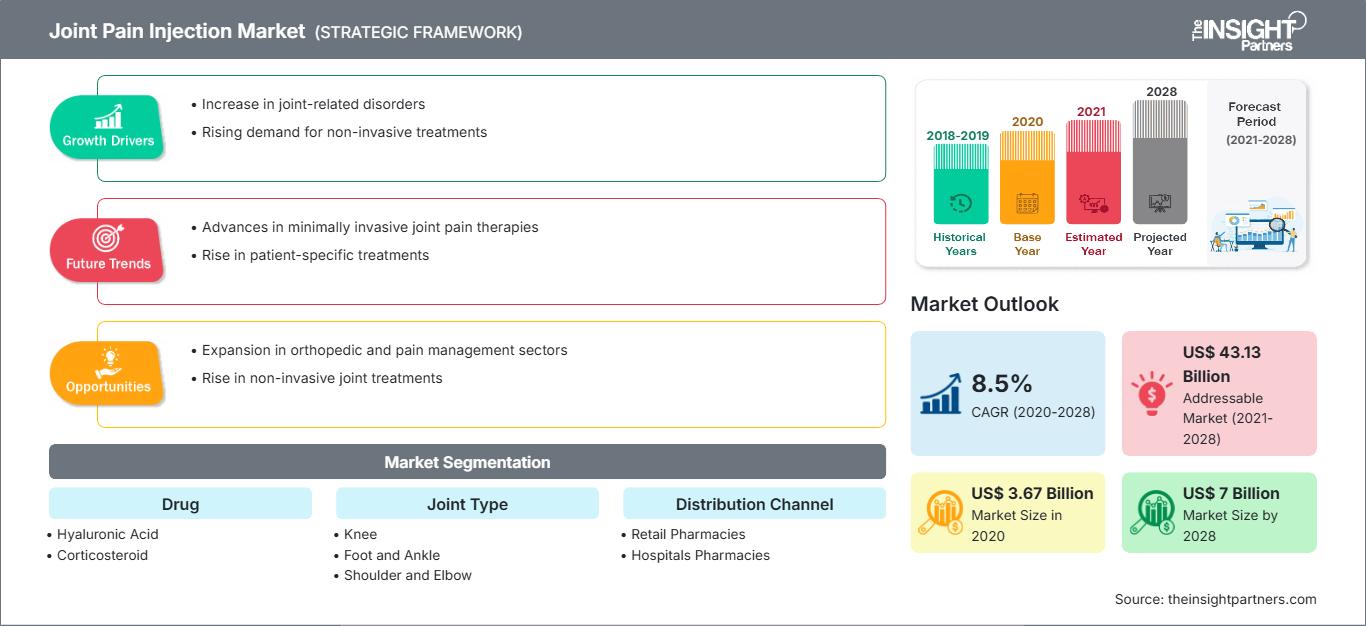
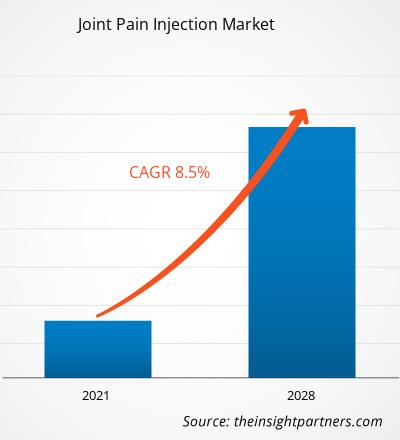
[Forschungsbericht]Der Markt für Gelenkschmerzinjektionen soll von 3.667,45 Millionen US-Dollar im Jahr 2020 auf 6.996,88 Millionen US-Dollar im Jahr 2028 anwachsen; für den Zeitraum 2021–2028 wird ein durchschnittliches jährliches Wachstum von 8,5 % erwartet.
Gelenkschmerzinjektionen lindern starke Schmerzen schneller und reduzieren Gelenkentzündungen. Zu den auf dem Markt erhältlichen Injektionsarten gehören Kortikosteroid-Injektionen, Hyaluronsäure-Injektionen (HA), plättchenreiches Plasma (PRP) und Plazentagewebematrix-Injektionen (PTM). Das Wachstum des Marktes für Gelenkschmerzinjektionen wird auf Faktoren wie die hohe Prävalenz von Muskel-Skelett-Erkrankungen und die steigende Zahl von Sportverletzungen zurückgeführt. Allerdings behindern die hohen Kosten für Gelenkreparaturtherapien das Marktwachstum.
Markteinblicke
Hohe Prävalenz von Muskel-Skelett-Erkrankungen
Passen Sie diesen Bericht Ihren Anforderungen an
Sie erhalten kostenlos Anpassungen an jedem Bericht, einschließlich Teilen dieses Berichts oder einer Analyse auf Länderebene, eines Excel-Datenpakets sowie tolle Angebote und Rabatte für Start-ups und Universitäten.
Markt für Gelenkschmerzinjektionen: Strategische Einblicke
-
Holen Sie sich die wichtigsten Markttrends aus diesem Bericht.Dieses KOSTENLOSE Beispiel umfasst Datenanalysen, die von Markttrends bis hin zu Schätzungen und Prognosen reichen.
Muskuloskelettale Erkrankungen sind medizinische Leiden, die Muskeln, Knochen und Gelenke in Nacken, Schultern, Handgelenken, Rücken, Hüfte, Beinen, Knien und Füßen betreffen. Zu diesen Erkrankungen zählen Sehnenentzündungen, Karpaltunnelsyndrom, Osteoarthritis, rheumatoide Arthritis (RA), Fibromyalgie und Knochenbrüche. Laut dem 2018 aktualisierten Factsheet der Weltgesundheitsorganisation (WHO) sind Muskel-Skelett-Erkrankungen die zweithäufigste Ursache für Behinderungen weltweit. Demnach werden Prävalenz und Auswirkungen von Muskel-Skelett-Erkrankungen voraussichtlich mit der zunehmenden Alterung der Bevölkerung und der Zunahme von Risikofaktoren für nichtübertragbare Krankheiten (NCDs) weltweit zunehmen. Laut den Daten der Jahrestagung 2016 der American Academy of Orthopedic Surgeons leidet in den USA etwa jeder zweite Erwachsene an einer Muskel-Skelett-Erkrankung. Laut den Centers for Disease Control and Prevention (CDC) verursacht Arthritis außerdem starke Schmerzen, von denen in den USA jedes Jahr Millionen Menschen betroffen sind. Etwa jeder vierte Arthritispatient, also etwa 15 Millionen von insgesamt etwa 54 Millionen Patienten, leidet unter starken, arthritisbedingten Gelenkschmerzen.
Osteoarthritis (OA) ist eine der am weitesten verbreiteten Gelenkerkrankungen in den USA und wird durch den Abbau des Gelenkknorpels zwischen den Knochen verursacht. Sie wird auch als degenerative Gelenkerkrankung oder „Verschleißarthritis“ bezeichnet. Laut den Centers for Disease Control and Prevention (CDC) leiden in den USA mehr als 32,5 Millionen Erwachsene an Osteoarthritis. Und laut dem National Health Service (NHS) haben in Großbritannien mehr als 10 Millionen Menschen Arthritis oder ähnliche Gelenkerkrankungen. Laut Bupa Health Insurance ist Osteoarthritis die am weitesten verbreitete Arthritisform in Großbritannien. Sie betrifft etwa ein Drittel der über 45-Jährigen im Land, also rund 8,75 Millionen Menschen. Die hohe Prävalenz von Muskel-Skelett-Erkrankungen in verschiedenen Ländern führt daher zu einer steigenden Zahl von Behandlungen, die dafür durchgeführt werden, und treibt so das Wachstum des Marktes für Gelenkschmerzinjektionen voran.
Medikamentenbasierte Erkenntnisse
Der Markt für Gelenkschmerzinjektionen ist nach Medikamenten segmentiert in Hyaluronsäure, Kortikosteroide und andere. Das Kortikosteroidsegment hatte 2020 den größten Marktanteil und wird im Prognosezeitraum voraussichtlich die höchste durchschnittliche jährliche Wachstumsrate verzeichnen.
Gelenktypbasierte Erkenntnisse
Basierend auf dem Gelenktyp ist der Markt für Gelenkschmerzinjektionen in Knie, Fuß und Knöchel, Schulter und Ellenbogen, Hüfte und andere Anwendungen segmentiert. Das Kniesegment hatte im Jahr 2020 den größten Marktanteil und dürfte im Prognosezeitraum die höchste durchschnittliche jährliche Wachstumsrate (CAGR) auf dem Markt verzeichnen.
Injektion bei Gelenkschmerzen
Regionale Einblicke in den Markt für Gelenkschmerzinjektionen
Die Analysten von The Insight Partners haben die regionalen Trends und Faktoren, die den Markt für Gelenkschmerzinjektionen im Prognosezeitraum beeinflussen, ausführlich erläutert. In diesem Abschnitt werden auch die Marktsegmente und die geografische Lage in Nordamerika, Europa, dem asiatisch-pazifischen Raum, dem Nahen Osten und Afrika sowie Süd- und Mittelamerika erörtert.
Umfang des Marktberichts zur Injektion von Gelenkschmerzen
| Berichtsattribut | Einzelheiten |
|---|---|
| Marktgröße in 2020 | US$ 3.67 Billion |
| Marktgröße nach 2028 | US$ 7 Billion |
| Globale CAGR (2020 - 2028) | 8.5% |
| Historische Daten | 2018-2019 |
| Prognosezeitraum | 2021-2028 |
| Abgedeckte Segmente |
By Arzneimittel
|
| Abgedeckte Regionen und Länder |
Nordamerika
|
| Marktführer und wichtige Unternehmensprofile |
|
Dichte der Marktteilnehmer für Gelenkschmerzinjektionen: Verständnis ihrer Auswirkungen auf die Geschäftsdynamik
Der Markt für Gelenkschmerzinjektionen wächst rasant. Die steigende Nachfrage der Endverbraucher ist auf Faktoren wie veränderte Verbraucherpräferenzen, technologische Fortschritte und ein stärkeres Bewusstsein für die Produktvorteile zurückzuführen. Mit der steigenden Nachfrage erweitern Unternehmen ihr Angebot, entwickeln Innovationen, um den Bedürfnissen der Verbraucher gerecht zu werden, und nutzen neue Trends, was das Marktwachstum weiter ankurbelt.
- Holen Sie sich die Markt für Gelenkschmerzinjektionen Übersicht der wichtigsten Akteure
Einblicke basierend auf Vertriebskanälen
Basierend auf den Vertriebskanälen ist der Markt für Injektionen gegen Gelenkschmerzen in Einzelhandelsapotheken, Krankenhausapotheken und andere segmentiert. Das Segment Wundversorgung hatte 2020 den größten Marktanteil, und das Segment Knochentransplantate wird im Prognosezeitraum voraussichtlich die höchste durchschnittliche jährliche Wachstumsrate (CAGR) auf dem Markt verzeichnen.
Produkteinführungen und -zulassungen sind die gängigsten Strategien von Unternehmen, um ihre globale Präsenz und ihr Produktportfolio zu erweitern. Darüber hinaus konzentrieren sich die Akteure auf dem Markt für Injektionen gegen Gelenkschmerzen auf die Kooperationsstrategie, um ihren Kundenstamm zu erweitern, was ihnen wiederum ermöglicht, ihren Markennamen weltweit zu behaupten.
Markt für Injektionen gegen Gelenkschmerzen – nach Medikament
- Hyaluronsäure
- Kortikosteroid
- Sonstige
Markt für Injektionen gegen Gelenkschmerzen – nach Gelenktyp
- Knie
- Fuß und Knöchel
- Schulter und Ellenbogen
- Hüfte
- Sonstige
Markt für Injektionen gegen Gelenkschmerzen – nach Vertriebskanal
- Apotheken
- Krankenhausapotheken
- Sonstige
Markt für Injektionen gegen Gelenkschmerzen – nach Geografie
-
Nordamerika
- USA
- Kanada
- Mexiko
-
Europa
- Frankreich
- Deutschland
- Italien
- Großbritannien
- Spanien
- Restliches Europa
-
Asien-Pazifik (APAC)
- China
- Indien
- Südkorea
- Japan
- Australien
- Restlicher Asien-Pazifik-Raum
-
Naher Osten und Afrika (MEA)
- Südafrika
- Saudi-Arabien
- VAE
- Restlicher Naher Osten und Afrika
-
Süd- und Mittelamerika (BETRUG)
- Brasilien
- Argentinien
- Rest von Süd- und Mittelamerika
Firmenprofile
- Chugai Pharmaceutical Co., Ltd.
- Bioventus Inc.
- Fidia Pharma USA Inc.
- Flexion Therapeutics, Inc.
- SEIKAGAKU CORPORATION
- Ferring BV
- Sanofi
- Anika Therapeutics, Inc.
- Teva Pharmaceutical
- OrthogenRx, Inc.

Mrinal ist eine erfahrene Research-Analystin mit über 8 Jahren Erfahrung in der Marktanalyse und Beratung im Bereich Life Sciences. Mit ihrer strategischen Denkweise und ihrem unerschütterlichen Streben nach Exzellenz hat sie sich umfassende Expertise in den Bereichen Pharmaprognosen, Marktchancenbewertung und Entwicklung von Branchen-Benchmarks angeeignet. Ihre Arbeit konzentriert sich darauf, umsetzbare Erkenntnisse zu liefern, die Kunden fundierte strategische Entscheidungen ermöglichen. Mrinals Kernkompetenz liegt in der Übersetzung komplexer quantitativer Datensätze in aussagekräftige Geschäftsinformationen. Ihr analytischer Scharfsinn ist entscheidend für die Entwicklung von Go-to-Market-Strategien (GTM) und die Erschließung von Wachstumschancen in der Pharma- und Medizinproduktebranche. Als vertrauenswürdige Beraterin konzentriert sie sich konsequent auf die Optimierung von Arbeitsabläufen und die Etablierung von Best Practices, um so Innovation und Betriebseffizienz für ihre Kunden zu fördern.
- Umfassende Analyse der Marktgröße und Prognosen
- Detaillierte Segmentierungsanalyse
- Tiefgehende Bewertung der Marktdynamik
- Einblicke auf regionaler und nationaler Ebene
- Wettbewerbslandschaft und Unternehmens-Benchmarking
- Strategische Business Intelligence
Erfahrungsberichte
Der SCADA-Systemmarktbericht von Insight Partners ist umfassend und bietet wertvolle Einblicke in aktuelle Trends und Zukunftsprognosen. Das Team war durchweg hochprofessionell, reaktionsschnell und hilfsbereit. Wir sind sehr zufrieden und können die Dienstleistungen wärmstens empfehlen.
RAN KEDEM Partner, Reali Technologies LTDsIch habe einen Bericht über einen sehr spezifischen Softwaremarkt angefordert, und das Team hat ihn innerhalb weniger Tage erstellt. Die Informationen waren sehr relevant und gut präsentiert. Anschließend habe ich einige Änderungen und Ergänzungen zum Bericht angefordert. Das Team reagierte erneut sehr schnell, und ich erhielt den Abschlussbericht in weniger als einer Woche.
JEAN-HERVE JENN Vorsitzende, Future AnalyticaWir haben mit The Insight Partners für eine wichtige Marktstudie und Prognose zusammengearbeitet. Sie gaben uns klare Einblicke in Chancen und Risiken, die uns bei der Gestaltung unserer Pläne halfen. Ihre Recherchen waren benutzerfreundlich und basierten auf soliden Daten. Sie halfen uns, kluge und sichere Entscheidungen zu treffen. Wir können sie wärmstens empfehlen.
PIYUSH NAGPAL Sr. Vizepräsident, Fernlicht GlobalDie Insight Partners lieferten aufschlussreiche, gut strukturierte Marktforschung mit fundierter Fachkompetenz. Ihr Team war durchweg professionell und reaktionsschnell. Die benutzerfreundliche Website ermöglichte den Zugriff auf Branchenberichte. Wir empfehlen sie wärmstens für zuverlässige und hochwertige Forschungsdienstleistungen.
YUKIHIKO ADACHI Geschäftsführer, Deep Blue, LLC.Dies ist das erste Mal, dass ich einen Marktbericht von The Insight Partners erworben habe. Obwohl ich zunächst unsicher war, besuchte ich die Website und fühlte mich dann sicherer, das Risiko einzugehen und einen Marktbericht zu kaufen. Ich bin mit der Qualität des Berichts und dem Kundenservice rundum zufrieden. Ich hatte einige Fragen und Anmerkungen zum ersten Bericht, aber nach einigen E-Mail-Gesprächen mit dem Analysten bin ich überzeugt, dass ich einen Bericht habe, den ich als Input für unseren strategischen Planungsprozess verwenden kann. Vielen Dank, dass Sie sich die Zeit genommen und dies zu einer positiven Erfahrung gemacht haben. Ich werde Ihren Service auf jeden Fall weiterempfehlen und Sie werden meine erste Anlaufstelle sein, wenn wir weitere Marktdaten benötigen.
JOHN SUZUKI Präsident und Chief Executive Officer, Vorstandsmitglied, BK TechnologiesIch möchte mich für Ihre Unterstützung und die Professionalität bedanken, die Sie bei der Bearbeitung meiner Informationsanfrage zum IVD-Markt für Infektionskrankheiten in Nigeria gezeigt haben. Ich schätze Ihre Geduld, Ihre Beratung und die Tatsache, dass Sie bereit waren, einen Rabatt anzubieten, der uns schließlich den Abschluss eines Geschäfts ermöglichte. Ich freue mich darauf, The Insight Partners in Zukunft wieder zu beauftragen, dank des Eindrucks, den Sie bei dieser ersten Begegnung bei mir hinterlassen haben.
DR. CHIJIOKE ONYIA GESCHÄFTSFÜHRERIN, PineCrest Healthcare Ltd.Grund zum Kauf
- Fundierte Entscheidungsfindung
- Marktdynamik verstehen
- Wettbewerbsanalyse
- Kundeneinblicke
- Marktprognosen
- Risikominimierung
- Strategische Planung
- Investitionsbegründung
- Identifizierung neuer Märkte
- Verbesserung von Marketingstrategien
- Steigerung der Betriebseffizienz
- Anpassung an regulatorische Trends


