Estrategias de mercado de inyección de dolor en las articulaciones, principales actores, oportunidades de crecimiento, análisis y pronóstico para 2028
Estrategias de mercado de inyección de dolor en las articulaciones, principales actores, oportunidades de crecimiento, análisis y pronósticos para 2028
- Estado : Publicada
- Código de informe : TIPRE00003536
- Categoría : Ciencias de la vida
- Número de páginas : 162
- Formatos de informe disponibles :


- Fecha de última actualización : June 13, 2024


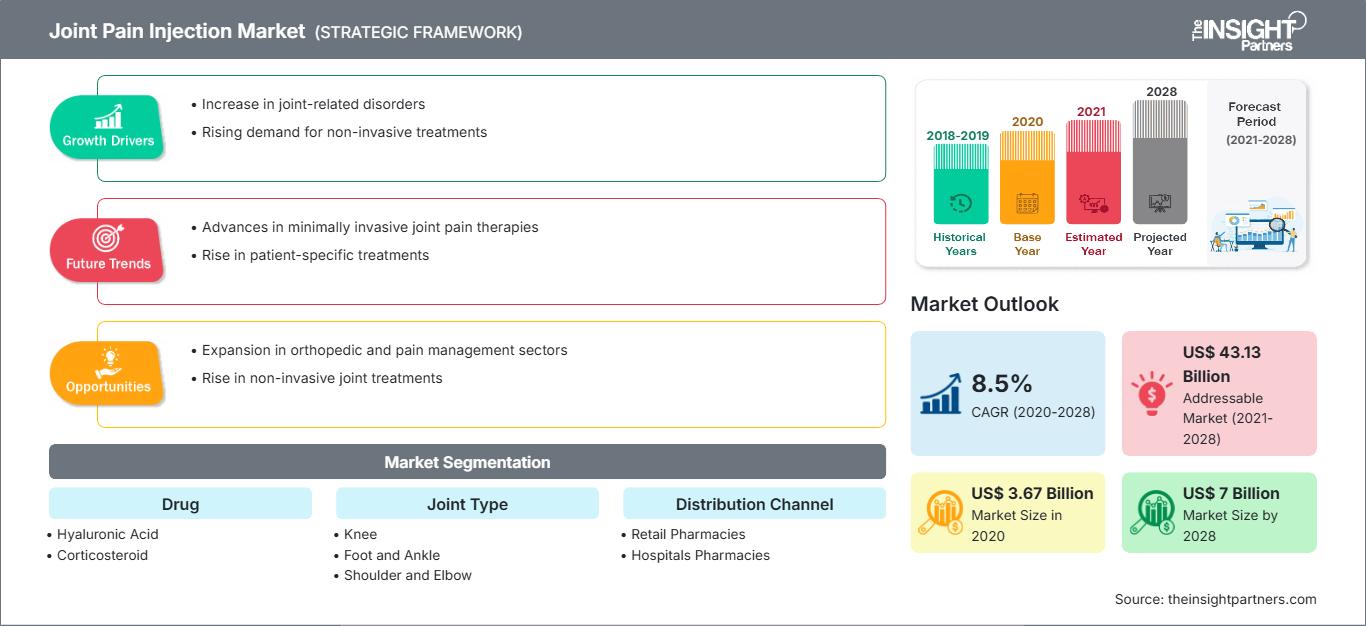
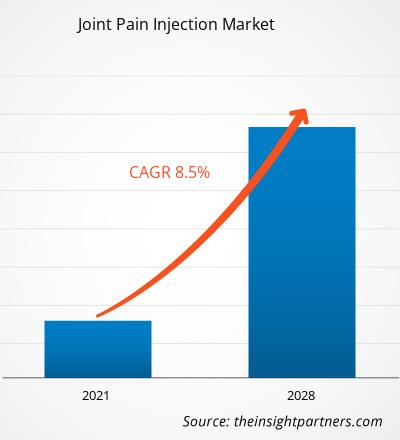
[Informe de investigación] Se espera que el mercado de inyecciones para el dolor articular alcance los 6.996,88 millones de dólares estadounidenses en 2028, frente a los 3.667,45 millones de dólares estadounidenses en 2020; se estima que crecerá a una tasa de crecimiento anual compuesta (TCAC) del 8,5% durante el período 2021-2028.
Las inyecciones para el dolor articular proporcionan un alivio más rápido del dolor intenso y reducen la inflamación de las articulaciones. Entre los diversos tipos de inyecciones disponibles en el mercado se incluyen las de corticosteroides, ácido hialurónico (AH), plasma rico en plaquetas (PRP) y matriz tisular placentaria (MTP). El crecimiento del mercado de inyecciones para el dolor articular se atribuye a factores como la alta prevalencia de trastornos musculoesqueléticos y el creciente número de lesiones deportivas. Sin embargo, los elevados costos de las terapias de reparación articular dificultan el crecimiento del mercado.
Perspectivas del mercado
Alta prevalencia de trastornos musculoesqueléticos
Obtendrá personalización en cualquier informe, sin cargo, incluidas partes de este informe o análisis a nivel de país, paquete de datos de Excel, así como también grandes ofertas y descuentos para empresas emergentes y universidades.
Mercado de inyecciones para el dolor articular: Perspectivas estratégicas
-
Obtenga las principales tendencias clave del mercado que se describen en este informe.Esta muestra GRATUITA incluirá análisis de datos, desde tendencias del mercado hasta estimaciones y pronósticos.
Los trastornos musculoesqueléticos son afecciones médicas que afectan los músculos, huesos y articulaciones del cuello, hombros, muñecas, espalda, caderas, piernas, rodillas y pies. Estas enfermedades incluyen tendinitis, síndrome del túnel carpiano, osteoartritis, artritis reumatoide (AR), fibromialgia y fracturas óseas. Según la hoja informativa de la Organización Mundial de la Salud (OMS), actualizada en 2018, las afecciones musculoesqueléticas son la segunda causa principal de discapacidad en todo el mundo. De acuerdo con la misma, se prevé que la prevalencia y el impacto de los trastornos musculoesqueléticos aumenten con el envejecimiento de la población y el incremento de los factores de riesgo de enfermedades no transmisibles (ENT) a nivel mundial. Según datos de la reunión anual de la Academia Estadounidense de Cirujanos Ortopédicos de 2016, aproximadamente 1 de cada 2 adultos en Estados Unidos padece un trastorno musculoesquelético. Además, según los Centros para el Control y la Prevención de Enfermedades (CDC), la artritis causa dolor intenso que afecta a millones de personas en Estados Unidos cada año. Aproximadamente uno de cada cuatro pacientes con artritis, es decir, unos 15 millones de un total de unos 54 millones de pacientes, experimenta dolor articular intenso relacionado con la artritis.
Además, la osteoartritis (OA) es uno de los trastornos articulares más comunes en Estados Unidos, causada por el desgaste del cartílago articular entre los huesos. También se conoce como artrosis o artritis por desgaste. Según los Centros para el Control y la Prevención de Enfermedades (CDC), más de 32,5 millones de adultos en Estados Unidos padecen osteoartritis. De igual manera, según el Servicio Nacional de Salud (NHS), más de 10 millones de personas en el Reino Unido tienen artritis u otras afecciones similares que afectan las articulaciones. Según Bupa Health Insurance, la osteoartritis es la forma más común de artritis en el Reino Unido, afectando a aproximadamente un tercio de las personas mayores de 45 años en el país, es decir, unos 8,75 millones de personas. Por lo tanto, esta alta prevalencia de trastornos musculoesqueléticos en diferentes países está incrementando el número de tratamientos que se realizan para tratarlos, impulsando así el crecimiento del mercado de inyecciones para el dolor articular.
Perspectivas basadas en fármacos
El mercado de inyecciones para el dolor articular, segmentado por fármaco, incluye ácido hialurónico, corticosteroides y otros. El segmento de corticosteroides representó la mayor cuota de mercado en 2020 y se prevé que registre la mayor tasa de crecimiento anual compuesto (TCAC) durante el período de pronóstico.
Perspectivas conjuntas basadas en el tipo
Según el tipo de articulación, el mercado de inyecciones para el dolor articular se segmenta en rodilla, pie y tobillo, hombro y codo, cadera y otras aplicaciones. El segmento de rodilla ostentó la mayor cuota de mercado en 2020 y se prevé que registre la mayor tasa de crecimiento anual compuesto (TCAC) durante el período de pronóstico.
Perspectivas regionales del mercado de inyecciones para el dolor articular
Los analistas de The Insight Partners han explicado en detalle las tendencias regionales y los factores que influyen en el mercado de inyecciones para el dolor articular durante el período de previsión. Esta sección también analiza los segmentos y la geografía del mercado de inyecciones para el dolor articular en Norteamérica, Europa, Asia Pacífico, Oriente Medio y África, y Sudamérica y Centroamérica.
Alcance del informe de mercado sobre inyecciones para el dolor articular
| Atributo del informe | Detalles |
|---|---|
| Tamaño del mercado en 2020 | 3.670 millones de dólares estadounidenses |
| Tamaño del mercado para 2028 | 7 mil millones de dólares |
| Tasa de crecimiento anual compuesto global (2020 - 2028) | 8,5% |
| Datos históricos | 2018-2019 |
| Período de pronóstico | 2021-2028 |
| Segmentos cubiertos |
Por drogas
|
| Regiones y países cubiertos |
América del norte
|
| Líderes del mercado y perfiles de empresas clave |
|
Densidad de participantes en el mercado de inyecciones para el dolor articular: comprensión de su impacto en la dinámica empresarial
El mercado de inyecciones para el dolor articular está creciendo rápidamente, impulsado por la creciente demanda de los usuarios finales debido a factores como la evolución de las preferencias de los consumidores, los avances tecnológicos y una mayor conciencia de los beneficios del producto. A medida que aumenta la demanda, las empresas amplían su oferta, innovan para satisfacer las necesidades de los consumidores y aprovechan las nuevas tendencias, lo que impulsa aún más el crecimiento del mercado.
- Obtenga una visión general de los principales actores del mercado de inyecciones para el dolor articular.
Información basada en el canal de distribución
Según el canal de distribución, el mercado de inyecciones para el dolor articular se segmenta en farmacias minoristas, farmacias hospitalarias y otros. El segmento de cuidado de heridas ostentó la mayor cuota de mercado en 2020, y se estima que el segmento de injertos óseos registrará la mayor tasa de crecimiento anual compuesto (TCAC) durante el período de pronóstico.
El lanzamiento y la aprobación de productos son estrategias comunes que adoptan las empresas para expandir su presencia global y su cartera de productos. Además, los actores del mercado de inyecciones para el dolor articular se centran en la estrategia de colaboración para ampliar su clientela, lo que, a su vez, les permite mantener su marca a nivel mundial.
Mercado de inyecciones para el dolor articular – por fármaco
- Ácido hialurónico
- Corticosteroide
- Otros
Mercado de inyecciones para el dolor articular: por tipo de articulación
- Rodilla
- Pie y tobillo
- Hombro y codo
- Cadera
- Otros
Mercado de inyecciones para el dolor articular: por canal de distribución
- Farmacias minoristas
- Farmacias de hospitales
- Otros
Mercado de inyecciones para el dolor articular – por geografía
-
América del norte
- A NOSOTROS
- Canadá
- México
-
Europa
- Francia
- Alemania
- Italia
- Reino Unido
- España
- El resto de Europa
-
Asia Pacífico (APAC)
- Porcelana
- India
- Corea del Sur
- Japón
- Australia
- Resto de Asia Pacífico
-
Oriente Medio y África (MEA)
- Sudáfrica
- Arabia Saudita
- Emiratos Árabes Unidos
- Resto de Oriente Medio y África
-
América del Sur y Central (ESTAFA)
- Brasil
- Argentina
- Resto de América del Sur y Central
Perfiles de empresas
- Compañía Farmacéutica Chugai, Ltd.
- Bioventus Inc.
- Fidia Pharma USA Inc.
- Flexion Therapeutics, Inc.
- CORPORACION SEIKAGAKU
- Ferring BV
- Sanofi
- Anika Therapeutics, Inc.
- Teva Pharmaceutical
- OrthogenRx, Inc.

Mrinal es una experimentada analista de investigación con más de 8 años de experiencia en inteligencia de mercado y consultoría en ciencias de la vida. Con una mentalidad estratégica y un firme compromiso con la excelencia, ha desarrollado una amplia experiencia en pronósticos farmacéuticos, evaluación de oportunidades de mercado y desarrollo de indicadores de referencia para la industria. Su trabajo se centra en brindar información práctica que permita a los clientes tomar decisiones estratégicas informadas.
La principal fortaleza de Mrinal reside en convertir conjuntos de datos cuantitativos complejos en inteligencia de negocios significativa. Su perspicacia analítica es fundamental para definir estrategias de salida al mercado (GTM) y descubrir oportunidades de crecimiento en los sectores farmacéutico y de dispositivos médicos. Como consultora de confianza, se centra constantemente en optimizar los procesos de flujo de trabajo y establecer las mejores prácticas, impulsando así la innovación y la eficiencia operativa para sus clientes.
- Análisis exhaustivo del tamaño del mercado y previsiones
- Análisis detallado de la segmentación
- Evaluación en profundidad de la dinámica del mercado
- Información a nivel regional y nacional
- Panorama competitivo y análisis comparativo de empresas
- Inteligencia empresarial estratégica
Testimonios
El informe de mercado de sistemas SCADA de Insight Partners es completo y ofrece información valiosa sobre las tendencias actuales y las previsiones futuras. El equipo fue altamente profesional, receptivo y me brindó un gran apoyo en todo momento. Estamos muy satisfechos y recomendamos ampliamente sus servicios.
RAN KEDEM Socio, Reali Technologies LTDsSolicité un informe sobre un mercado de software muy específico y el equipo lo elaboró en pocos días. La información era muy relevante y estaba bien presentada. Posteriormente, solicité algunos cambios y adiciones al informe. El equipo fue muy receptivo y recibí el informe final en menos de una semana.
JEAN-HERVE JENN Presidente, Future AnalyticaTrabajamos con The Insight Partners para un importante estudio y pronóstico de mercado. Nos brindaron una visión clara de las oportunidades y los riesgos, lo que nos ayudó a definir nuestros planes. Su investigación fue fácil de usar y se basó en datos sólidos. Nos ayudó a tomar decisiones inteligentes y seguras. Los recomendamos ampliamente.
PIYUSH NAGPAL Vicepresidente Sénior, , High Beam GlobalThe Insight Partners realizó una investigación de mercado profunda y bien estructurada con una sólida experiencia en el sector. Su equipo fue profesional y receptivo en todo momento. El sitio web, fácil de usar, facilitó el acceso a los informes del sector. Los recomendamos ampliamente por sus servicios de investigación confiables y de alta calidad.
YUKIHIKO ADACHI Director Ejecutivo, , Deep Blue, LLCEsta es la primera vez que compro un informe de mercado de The Insight Partners. Aunque al principio tenía dudas, visité su sitio web y me sentí más cómodo al arriesgarme y comprarlo. Estoy completamente satisfecho con la calidad del informe y el servicio al cliente. Tenía varias preguntas y comentarios sobre el informe inicial, pero después de un par de conversaciones por correo electrónico con su analista, creo que tengo un informe que puedo usar como base para nuestro proceso de planificación estratégica. Muchas gracias por tomarse el tiempo y hacer de esta una experiencia positiva. Sin duda, recomendaré sus servicios y serán mi primera opción cuando necesitemos más datos de mercado.
JOHN SUZUKI Presidente y Director Ejecutivo, Director de la Junta Directiva, BK TechnologiesAgradezco su apoyo y la profesionalidad que demostraron al atender mi solicitud de información sobre el mercado de diagnóstico in vitro (IVD) para enfermedades infecciosas en Nigeria. Agradezco su paciencia, su orientación y su disposición a ofrecerme un descuento, lo que finalmente nos permitió cerrar un trato. Espero poder colaborar con The Insight Partners en el futuro, gracias a la impresión que me causó este primer encuentro.
DRA. CHIJIOKE ONYIA, DIRECTORA GENERAL, PineCrest Healthcare Ltd.Razón para comprar
- Toma de decisiones informada
- Comprensión de la dinámica del mercado
- Análisis competitivo
- Información sobre clientes
- Pronósticos del mercado
- Mitigación de riesgos
- Planificación estratégica
- Justificación de la inversión
- Identificación de mercados emergentes
- Mejora de las estrategias de marketing
- Impulso de la eficiencia operativa
- Alineación con las tendencias regulatorias


