
PACS- und RIS-Markt, PACS- und RIS-Marktgröße, PACS- und RIS-Marktanteil, PACS- und RIS-Marktprognose, PACS- und RIS-Marktwachstum, PACS- und RIS-Marktanalyse, Marktbericht CAGR von 9,7 % nach Segmenten, Geografie, Dynamik, jüngsten Entwicklungen und strategischen Erkenntnissen
PACS- und RIS-Marktgröße und -prognose (2021 – 2031), Berichtsabdeckung zu globalen und regionalen Anteilen, Trends und Wachstumschancen: Nach Produkt (PACS und RIS), Komponente (Hardware, Software und Dienste), Bereitstellung (vor Ort, webbasiert und Cloud-basiert), Endbenutzer (Krankenhäuser, Diagnosezentren, Forschungs- und akademische Institute und andere) und Geografie
- Status : Veröffentlichte Daten
- Berichtscode : TIPRE00003005
- Kategorie : Biowissenschaften
- Anzahl der Seiten : 150
- Verfügbare Berichtsformate :


- Datum der letzten Aktualisierung : February 15, 2025

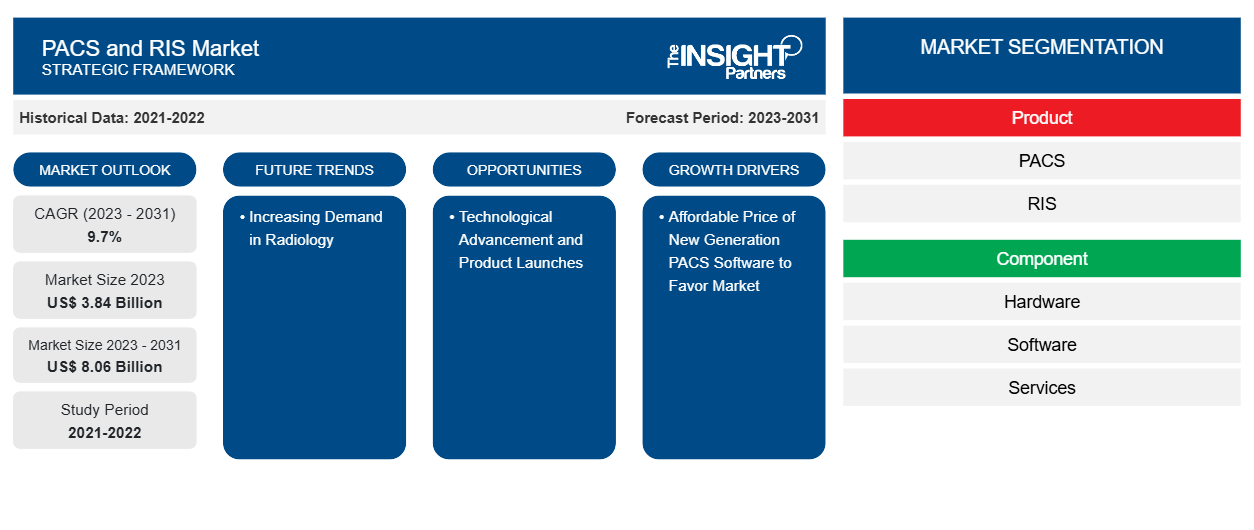
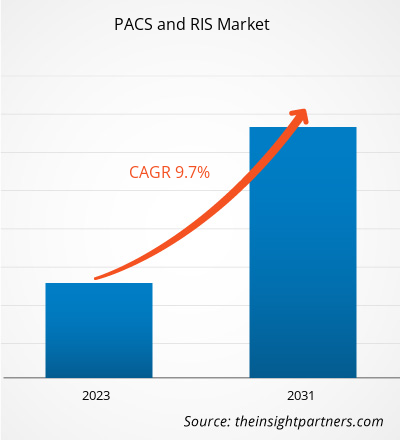
Der PACS- und RIS-Markt soll von 3,84 Milliarden US-Dollar im Jahr 2023 auf 8,06 Milliarden US-Dollar im Jahr 2031 anwachsen. Der Markt wird voraussichtlich zwischen 2023 und 2031 eine durchschnittliche jährliche Wachstumsrate (CAGR) von 9,7 % verzeichnen. Technologischer Fortschritt und Produkteinführungen werden wahrscheinlich weiterhin ein wichtiger Trend auf dem PACS- und RIS-Markt bleiben.PACS and RIS market size is projected to reach US$ 8.06 billion by 2031 from US$ 3.84 billion in 2023. The market is expected to register a CAGR of 9.7% in 2023–2031. Technological advancement and product launches will likely remain a vital PACS and RIS market trend.
PACS- und RIS-Marktanalyse
PACS-bezogene Fähigkeiten definieren das Potenzial der diagnostischen medizinischen Bildgebung neu und verändern die Möglichkeiten der Patientenversorgung. Schlüsselfaktoren für das Wachstum des PACS- und RIS-Marktes sind der Einsatz künstlicher Intelligenz (KI) in der Radiologie und medizinischen Bildgebung sowie RIS/PACS-Kombinationssystemen. Integrierte KI verbessert den radiologischen Entscheidungsprozess auf ein brauchbareres Niveau, hauptsächlich aufgrund der fortschrittlichen Fraktionen in der Algorithmenentwicklung und der erhöhten Verfügbarkeit von Rechenressourcen. Darüber hinaus wechseln viele Unternehmen und Praktiker der medizinischen Bildgebung von lokalen PACS-Systemen zu Cloud-PACS-Lösungen. Dieser unmittelbare Wechsel ist hauptsächlich auf Vorteile wie Kosteneffizienz, Skalierbarkeit und Datensicherheit zurückzuführen.
PACS- und RIS-Marktübersicht
Diabetes, Schlaganfall, Herzkrankheiten, Krebs und andere chronische Krankheiten sind die häufigsten Todesursachen, die mehrere bildgebende Sensorsysteme für Diagnose- und Behandlungsüberwachungszwecke erfordern. Die Verwendung von PACS bietet Patienten verschiedene Vorteile und erhöht die Effizienz der Krankenhäuser bei der Behandlung chronischer Krankheiten. PACS in Krankenhäusern verkürzt die längeren Untersuchungs- und Wartezeiten der Patienten. Es bietet auch eine angemessene Behandlung für Patienten mit chronischen Krankheiten und bietet somit in den kommenden Jahren erhebliche Wachstumschancen für den Markt.
Passen Sie diesen Bericht Ihren Anforderungen an
Sie erhalten kostenlose Anpassungen an jedem Bericht, einschließlich Teilen dieses Berichts oder einer Analyse auf Länderebene, eines Excel-Datenpakets sowie tolle Angebote und Rabatte für Start-ups und Universitäten.
PACS- und RIS-Markt: Strategische Einblicke
-
Holen Sie sich die wichtigsten Markttrends aus diesem Bericht.Dieses KOSTENLOSE Beispiel umfasst eine Datenanalyse von Markttrends bis hin zu Schätzungen und Prognosen.
PACS- und RIS-Markttreiber und -Chancen
Erschwinglicher Preis für PACS-Software der neuen Generation begünstigt den Markt
Moderne PACS sind zu einem günstigeren Preis erhältlich als ältere Versionen. Die Preise variieren je nach Studienvolumen, Praxisgröße und erforderlichen Integrationen. 1.000 PACS-Studien vor Ort können weniger als 10.000 US-Dollar pro Monat kosten, und es fallen jährliche Wartungs- und Supportgebühren von 2.000 US-Dollar an. Vor-Ort-PACS sind kostengünstiger als Cloud-basierte PACS. Darüber hinaus betragen die Speicherkosten bis zu 50 US-Dollar, also 5 % der früheren Kosten. Außerdem beträgt der Softwarepreis für die monatliche Nutzung 1.500 US-Dollar, ohne die vorläufige Einrichtung und eine internetfähige Anzeigestation oder einen PC. Die oben genannten Faktoren treiben das Wachstum des PACS- und RIS-Marktes voran.PACS are available at affordable price than its older versions. Pricing varies based on volume or studies, the practice size, and particular integrations needed. On-site 1,000 PACS studies can cost less than US$ 10,000 for a month and annual maintenance and support fees of US$2,000. On-site PACS is less costly than cloud-based PACS. Furthermore, the storage cost is up to US $50, i.e., 5% of the earlier cost. Also, the software price for a month usage is US$1,500, excluding the preliminary setup and an internet-capable viewing station or personal computer. The above factors is driving the PACS and RIS market growth.
Steigende Nachfrage in der Radiologie – eine Chance im PACS- und RIS-MarktPACS and RIS Market
Radiologie-Informationssystem (RIS) und Bildarchivierungs- und Kommunikationssystem (PACS) sind zwei Hauptlösungen zur Pflege und Verwaltung von Organisationsbildern im Bereich der Radiologie. RIS verwaltet den Datenfluss während der gesamten Berichtsverarbeitung effizient, während PACS die medizinischen Bilddaten privater Patienten effizient transportiert. Nach der Integration von RIS und PACS können Angehörige der Gesundheitsberufe problemlos auf medizinische Bilder zugreifen, wodurch die Ablehnung von Ansprüchen aufgrund falsch eingegebener Informationen reduziert wird. Andere Faktoren wie Bildverfolgung, spezifische Verfahrensberichte, automatisierte Abrechnung und andere helfen Radiologen dabei, den Überblick über Patientendaten zu behalten. Dies treibt das Wachstum des PACS- und RIS-Marktes voran.RIS) and Picture Archiving and Communication System (PACS) are two primary solutions to maintain and manage organization imaging in the field of radiology. RIS efficiently manages data flow throughout reporting processing, whereas PACS efficiently transports private patient medical imaging information. After integrating RIS and PACS, healthcare professionals access medical images easily, reducing claims denials due to incorrectly entered information. Other factors such as image tracking, specific procedure reporting, automated billing, and other is helping PACS and RIS Market.
Segmentierungsanalyse des PACS- und RIS-Marktberichts and RIS Market Report Segmentation Analysis
Wichtige Segmente, die zur Ableitung der PACS- und RIS-Marktanalyse beigetragen haben, sind Produkt, Komponente, Bereitstellung und Endbenutzer.PACS and RIS market analysis are product, component, deployment, and end user.
- Basierend auf dem Produkt ist der PACS- und RIS-Markt in PACS und RIS unterteilt. Das PACS-Segment hatte im Jahr 2023 einen größeren Marktanteil.PACS and RIS market is bifurcated into PACS and RIS. The PACS segment held a larger market share in 2023.
- Basierend auf den Komponenten ist der Markt in Hardware, Software und Dienstleistungen segmentiert. Das Softwaresegment hielt im Jahr 2023 einen größeren Marktanteil.
- Basierend auf der Bereitstellung ist der Markt in On-Premise und web- und cloudbasiert unterteilt. Das web- und cloudbasierte Segment hatte im Jahr 2023 einen größeren Marktanteil.
- In Bezug auf den Endverbraucher ist der Markt in Krankenhäuser, Diagnosezentren, Forschungs- und akademische Institute und andere unterteilt. Das Krankenhaussegment dominierte den Markt im Jahr 2023.
PACS- und RIS-Marktanteilsanalyse nach geografischer Lage
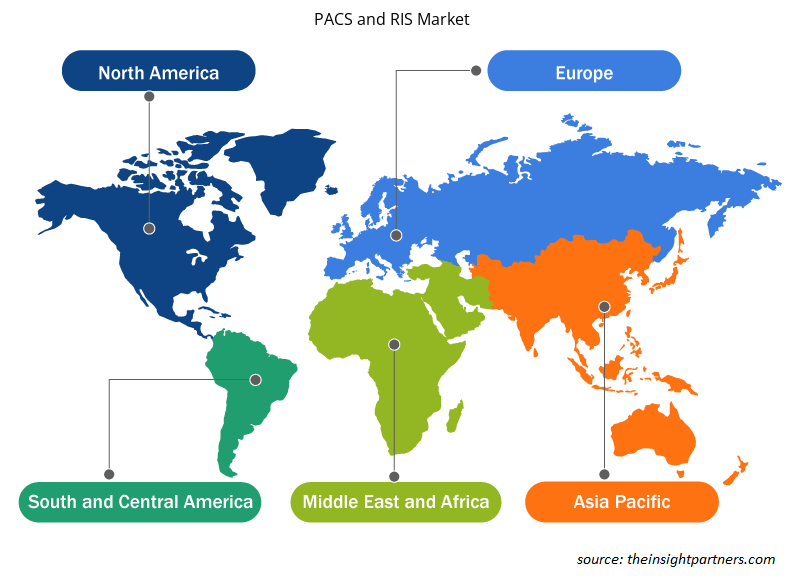
Der geografische Umfang des PACS- und RIS-Marktberichts ist hauptsächlich in fünf Regionen unterteilt: Nordamerika, Europa, Asien-Pazifik, Naher Osten und Afrika sowie Südamerika/Süd- und Mittelamerika. Der PACS- und RIS-Markt in Nordamerika ist bedeutend. Der PACS- und RIS-Markt wächst und erlebt in Nordamerika ein exponentielles Wachstum. Das Wachstum der Region wird hauptsächlich durch staatliche Investitionen in die Gesundheitsinfrastruktur, ein zunehmendes Bewusstsein für medizinische Bildgebung und ihre Vorteile im Zusammenhang mit der Implementierung von PACS und RIS vorangetrieben. Im März 2024 startete Synthesis Health einen Entwickler für eine Radiologie-Workflow-Plattform. Diese Plattform verfügt über mehrere Module, darunter eine KI-basierte Spracherkennungsfunktion, ein Workflow- und Berichtspaket sowie einen Diagnose- und Unternehmensviewer. Die oben genannten Faktoren dürften sich positiv auf das Wachstum des PACS- und RIS-Marktes auswirken.
Regionale Einblicke in den PACS- und RIS-Markt
Die regionalen Trends und Faktoren, die den PACS- und RIS-Markt während des Prognosezeitraums beeinflussen, wurden von den Analysten von Insight Partners ausführlich erläutert. In diesem Abschnitt werden auch PACS- und RIS-Marktsegmente und -Geografie in Nordamerika, Europa, im asiatisch-pazifischen Raum, im Nahen Osten und Afrika sowie in Süd- und Mittelamerika erörtert.
- Holen Sie sich die regionsspezifischen Daten für den PACS- und RIS-Markt
Umfang des PACS- und RIS-Marktberichts
| Berichtsattribut | Details |
|---|---|
| Marktgröße im Jahr 2023 | 3,84 Milliarden US-Dollar |
| Marktgröße bis 2031 | 8,06 Milliarden US-Dollar |
| Globale CAGR (2023 - 2031) | 9,7 % |
| Historische Daten | 2021-2022 |
| Prognosezeitraum | 2023–2031 |
| Abgedeckte Segmente |
Nach Produkt
|
| Abgedeckte Regionen und Länder |
Nordamerika
|
| Marktführer und wichtige Unternehmensprofile |
|
Marktteilnehmerdichte: Der Einfluss auf die Geschäftsdynamik
Der PACS- und RIS-Markt wächst rasant, angetrieben durch die steigende Nachfrage der Endnutzer aufgrund von Faktoren wie sich entwickelnden Verbraucherpräferenzen, technologischen Fortschritten und einem größeren Bewusstsein für die Vorteile des Produkts. Mit steigender Nachfrage erweitern Unternehmen ihr Angebot, entwickeln Innovationen, um die Bedürfnisse der Verbraucher zu erfüllen, und nutzen neue Trends, was das Marktwachstum weiter ankurbelt.
Die Marktteilnehmerdichte bezieht sich auf die Verteilung der Firmen oder Unternehmen, die in einem bestimmten Markt oder einer bestimmten Branche tätig sind. Sie gibt an, wie viele Wettbewerber (Marktteilnehmer) in einem bestimmten Marktraum im Verhältnis zu seiner Größe oder seinem gesamten Marktwert präsent sind.
Die wichtigsten auf dem PACS- und RIS-Markt tätigen Unternehmen sind:
- Agfa-Gevaert-Gruppe
- INFINITT Healthcare Co., Ltd.
- McKesson Corporation
- Cerner Corporation
- Allgemeine Elektrizit?tsgesellschaft
- Koninklijke Philips NV
Haftungsausschluss : Die oben aufgeführten Unternehmen sind nicht in einer bestimmten Reihenfolge aufgeführt.
- Überblick über die wichtigsten Akteure auf dem PACS- und RIS-Markt
PACS- und RIS-Marktnachrichten und aktuelle Entwicklungen
Der PACS- und RIS-Markt wird durch die Erhebung qualitativer und quantitativer Daten nach Primär- und Sekundärforschung bewertet, die wichtige Unternehmensveröffentlichungen, Verbandsdaten und Datenbanken umfasst. Im Folgenden finden Sie eine Liste der Entwicklungen auf dem Markt für Innovationen, Geschäftserweiterungen und Strategien:
- Im Mai 2024 führte das US-amerikanische Gesundheitssystem Change Healthcare Cloud-Native PACS ein. Das Unternehmen konzentriert sich auf den Übergang von lokalen Bildgebungssystemen zu Cloud-basierten und platzsparenden medizinischen Bildgebungslösungen, PACS und den dazugehörigen Tools für Kardiologie und Radiologie (Quelle: Change Healthcare, Pressemitteilung)
- Im September 2023, am Welttag der Patientensicherheit 2023, schlossen sich die Patient for Patient Safety Foundation (PFPSF) und das Consortium of Accredited Healthcare Organizations (CAHO) zusammen, um die Bedeutung der Patientenbeteiligung durch die Schaffung von Patientenbeiräten (Patient Advisory Councils, PACs) und die Förderung von Patient Reported Experience Measures (PREMs) hervorzuheben (Quelle: Patient for Patient Safety Foundation (PFPSF), Newsletter)
PACS- und RIS-Marktbericht – Abdeckung und Ergebnisse
Der Bericht „PACS- und RIS-Marktgröße und -prognose (2021–2031)“ bietet eine detaillierte Analyse des Marktes, die die folgenden Bereiche abdeckt:
- PACS und RIS Marktgröße und Prognose auf globaler, regionaler und Länderebene für alle wichtigen Marktsegmente, die im Rahmen des Projekts abgedeckt sind
- Marktdynamik wie Treiber, Beschränkungen und wichtige Chancen
PACS- und RIS-Markttrends
- Detaillierte PEST/Porters Five Forces- und SWOT-Analyse
- PACS- und RIS-Marktanalyse mit wichtigen Markttrends, globalen und regionalen Rahmenbedingungen, wichtigen Akteuren, Vorschriften und aktuellen Marktentwicklungen
- PACS- und RIS-Branchenlandschaft und Wettbewerbsanalyse, einschließlich Marktkonzentration, Heatmap-Analyse, prominenten Akteuren und aktuellen Entwicklungen
- Detaillierte Firmenprofile

Mrinal ist eine erfahrene Research-Analystin mit über 8 Jahren Erfahrung in der Marktanalyse und Beratung im Bereich Life Sciences. Mit ihrer strategischen Denkweise und ihrem unerschütterlichen Streben nach Exzellenz hat sie sich umfassende Expertise in den Bereichen Pharmaprognosen, Marktchancenbewertung und Entwicklung von Branchen-Benchmarks angeeignet. Ihre Arbeit konzentriert sich darauf, umsetzbare Erkenntnisse zu liefern, die Kunden fundierte strategische Entscheidungen ermöglichen. Mrinals Kernkompetenz liegt in der Übersetzung komplexer quantitativer Datensätze in aussagekräftige Geschäftsinformationen. Ihr analytischer Scharfsinn ist entscheidend für die Entwicklung von Go-to-Market-Strategien (GTM) und die Erschließung von Wachstumschancen in der Pharma- und Medizinproduktebranche. Als vertrauenswürdige Beraterin konzentriert sie sich konsequent auf die Optimierung von Arbeitsabläufen und die Etablierung von Best Practices, um so Innovation und Betriebseffizienz für ihre Kunden zu fördern.
- Umfassende Analyse der Marktgröße und Prognosen
- Detaillierte Segmentierungsanalyse
- Tiefgehende Bewertung der Marktdynamik
- Einblicke auf regionaler und nationaler Ebene
- Wettbewerbslandschaft und Unternehmens-Benchmarking
- Strategische Business Intelligence
Erfahrungsberichte
Der SCADA-Systemmarktbericht von Insight Partners ist umfassend und bietet wertvolle Einblicke in aktuelle Trends und Zukunftsprognosen. Das Team war durchweg hochprofessionell, reaktionsschnell und hilfsbereit. Wir sind sehr zufrieden und können die Dienstleistungen wärmstens empfehlen.
RAN KEDEM Partner, Reali Technologies LTDsIch habe einen Bericht über einen sehr spezifischen Softwaremarkt angefordert, und das Team hat ihn innerhalb weniger Tage erstellt. Die Informationen waren sehr relevant und gut präsentiert. Anschließend habe ich einige Änderungen und Ergänzungen zum Bericht angefordert. Das Team reagierte erneut sehr schnell, und ich erhielt den Abschlussbericht in weniger als einer Woche.
JEAN-HERVE JENN Vorsitzende, Future AnalyticaWir haben mit The Insight Partners für eine wichtige Marktstudie und Prognose zusammengearbeitet. Sie gaben uns klare Einblicke in Chancen und Risiken, die uns bei der Gestaltung unserer Pläne halfen. Ihre Recherchen waren benutzerfreundlich und basierten auf soliden Daten. Sie halfen uns, kluge und sichere Entscheidungen zu treffen. Wir können sie wärmstens empfehlen.
PIYUSH NAGPAL Sr. Vizepräsident, Fernlicht GlobalDie Insight Partners lieferten aufschlussreiche, gut strukturierte Marktforschung mit fundierter Fachkompetenz. Ihr Team war durchweg professionell und reaktionsschnell. Die benutzerfreundliche Website ermöglichte den Zugriff auf Branchenberichte. Wir empfehlen sie wärmstens für zuverlässige und hochwertige Forschungsdienstleistungen.
YUKIHIKO ADACHI Geschäftsführer, Deep Blue, LLC.Dies ist das erste Mal, dass ich einen Marktbericht von The Insight Partners erworben habe. Obwohl ich zunächst unsicher war, besuchte ich die Website und fühlte mich dann sicherer, das Risiko einzugehen und einen Marktbericht zu kaufen. Ich bin mit der Qualität des Berichts und dem Kundenservice rundum zufrieden. Ich hatte einige Fragen und Anmerkungen zum ersten Bericht, aber nach einigen E-Mail-Gesprächen mit dem Analysten bin ich überzeugt, dass ich einen Bericht habe, den ich als Input für unseren strategischen Planungsprozess verwenden kann. Vielen Dank, dass Sie sich die Zeit genommen und dies zu einer positiven Erfahrung gemacht haben. Ich werde Ihren Service auf jeden Fall weiterempfehlen und Sie werden meine erste Anlaufstelle sein, wenn wir weitere Marktdaten benötigen.
JOHN SUZUKI Präsident und Chief Executive Officer, Vorstandsmitglied, BK TechnologiesIch möchte mich für Ihre Unterstützung und die Professionalität bedanken, die Sie bei der Bearbeitung meiner Informationsanfrage zum IVD-Markt für Infektionskrankheiten in Nigeria gezeigt haben. Ich schätze Ihre Geduld, Ihre Beratung und die Tatsache, dass Sie bereit waren, einen Rabatt anzubieten, der uns schließlich den Abschluss eines Geschäfts ermöglichte. Ich freue mich darauf, The Insight Partners in Zukunft wieder zu beauftragen, dank des Eindrucks, den Sie bei dieser ersten Begegnung bei mir hinterlassen haben.
DR. CHIJIOKE ONYIA GESCHÄFTSFÜHRERIN, PineCrest Healthcare Ltd.Grund zum Kauf
- Fundierte Entscheidungsfindung
- Marktdynamik verstehen
- Wettbewerbsanalyse
- Kundeneinblicke
- Marktprognosen
- Risikominimierung
- Strategische Planung
- Investitionsbegründung
- Identifizierung neuer Märkte
- Verbesserung von Marketingstrategien
- Steigerung der Betriebseffizienz
- Anpassung an regulatorische Trends


