
Tamaño, participación y pronóstico del mercado de tarjetas de combustible para 2034
Tamaño y pronóstico del mercado de tarjetas de combustible (2021-2034), participación global y regional, tendencias y análisis de oportunidades de crecimiento. Cobertura del informe: Por tipo (tarjetas de combustible de marca, tarjetas de combustible para comercios y tarjetas de combustible universales); aplicación (recarga de combustible, estacionamiento, servicio de vehículos, peaje y otros).
- Estado : Datos publicados
- Código de informe : TIPRE00003099
- Categoría : Banca, servicios financieros y seguros
- Número de páginas : 150
- Formatos de informe disponibles :


- Fecha de última actualización : March 17, 2026

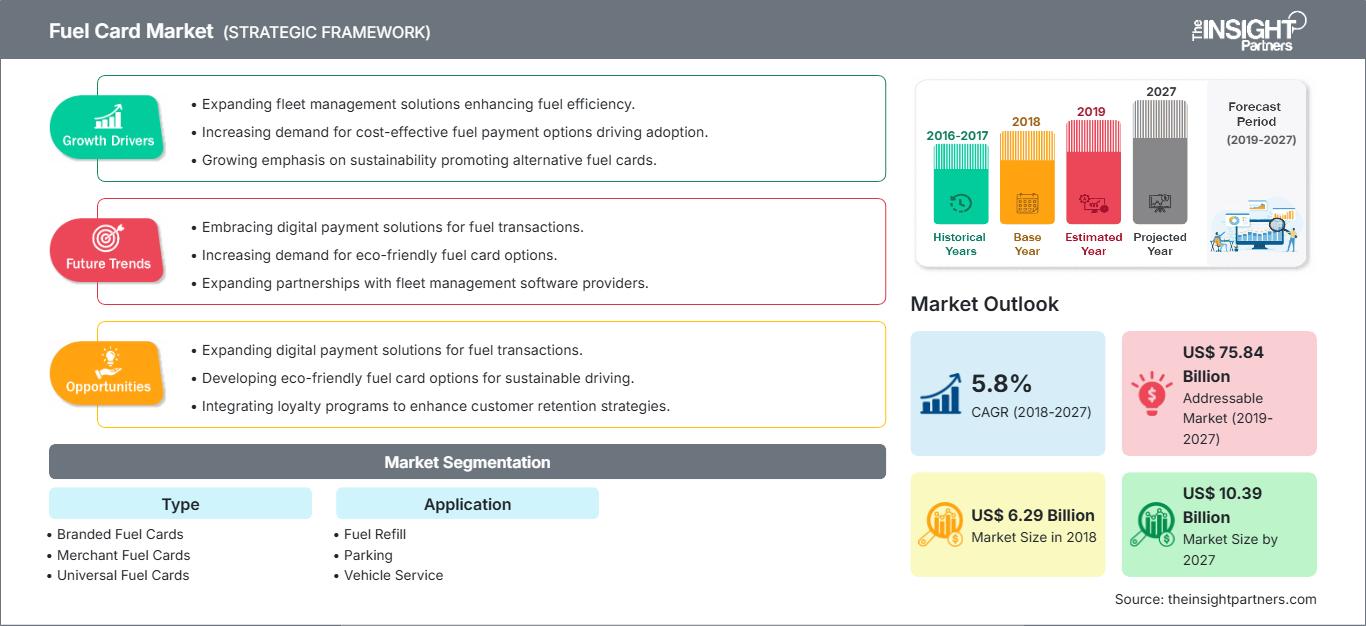
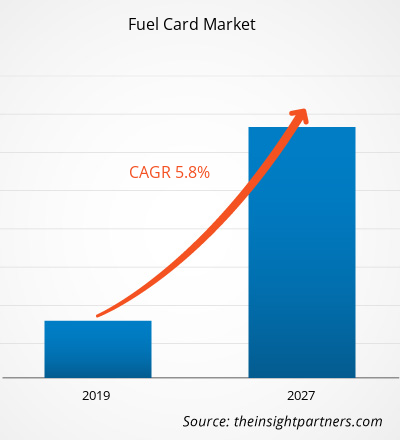
Se prevé que el mercado global de tarjetas de combustible alcance los 1024.600 millones de dólares estadounidenses en 2034, frente a los 520.880 millones de dólares estadounidenses en 2025. Se espera que el mercado registre una tasa de crecimiento anual compuesta (CAGR) del 7,41 % durante el período de pronóstico 2026-2034.
Entre las principales dinámicas del mercado se incluyen un mayor enfoque global en la optimización de los costos operativos, la creciente adopción de soluciones de pago digital en el sector logístico y un cambio significativo hacia la integración de la telemática y el software de gestión de flotas. Además, se espera que el mercado se beneficie de la creciente expansión de las redes de entrega de comercio electrónico, las estrictas normativas sobre la transparencia en la declaración de gastos de combustible y la creciente integración de la carga de vehículos eléctricos en los ecosistemas tradicionales de tarjetas de combustible.
Análisis del mercado de tarjetas de combustible
El análisis del mercado de tarjetas de combustible indica un cambio fundamental: de la simple facilitación de pagos a la inteligencia integral de flotas basada en datos. Las tendencias de adquisición muestran que el mercado se está bifurcando entre las redes tradicionales de compañías petroleras y las soluciones fintech universales multimarca que priorizan la flexibilidad y la amplia cobertura. Surgen oportunidades estratégicas en la integración de la Inteligencia Artificial (IA) para la predicción del gasto en combustible y la detección de fraudes, donde las alertas de anomalías en tiempo real ofrecen una clara ventaja competitiva sobre los métodos de conciliación manual. El análisis también señala que la expansión del mercado depende de la integración fluida de los sistemas de pago con el software de Planificación de Recursos Empresariales (ERP) existente y la escalabilidad de las plataformas de pago móviles. La diferenciación competitiva ahora radica en ofrecer servicios de valor añadido, como la recuperación automatizada de impuestos, el seguimiento de la huella de carbono y el análisis del comportamiento del conductor, lo que permite a los proveedores asegurar la fidelización a largo plazo en un entorno sensible a los precios.
Panorama general del mercado de tarjetas de combustible
Las tarjetas de combustible están evolucionando de ser una conveniencia corporativa de nicho a una infraestructura financiera crítica para la industria de la movilidad global. Si bien históricamente se centraban en ofrecer descuentos en el surtidor para el transporte pesado, el mercado se está expandiendo hacia diversos servicios de valor añadido, como el pago de peajes, el estacionamiento y el mantenimiento de vehículos. Tanto los gigantes energéticos globales como las ágiles empresas fintech disruptivas forman parte de este mercado, aprovechando las tecnologías sin contacto y basadas en la nube para optimizar la última milla de los pagos logísticos. A medida que las empresas de todo el mundo buscan mitigar el impacto de la volatilidad de los precios del combustible, las tarjetas de combustible han ganado popularidad como una herramienta estratégica para el control presupuestario y la transparencia. Europa sigue siendo un líder consolidado en su adopción, pero la región de Asia-Pacífico está emergiendo rápidamente como un corredor de alto crecimiento impulsado por el desarrollo de infraestructuras y la modernización del transporte comercial en las economías emergentes. Por ejemplo, el mercado en EE. UU. representa un segmento altamente sofisticado y dominante del panorama global, caracterizado por una extensa red de transporte comercial de mercancías y logística de larga distancia. El mercado se define por una alta penetración de tarjetas universales que ofrecen una amplia accesibilidad interestatal. Cada vez se hace más hincapié en la integración de los pagos de combustible con herramientas telemáticas avanzadas y de cumplimiento normativo para mejorar la productividad de la flota.
Personaliza este informe para adaptarlo a tus necesidades.
Obtén PERSONALIZACIÓN GRATUITAMercado de tarjetas de combustible: Perspectivas estratégicas
-
Descubra las principales tendencias del mercado que se recogen en este informe.Esta muestra GRATUITA incluirá análisis de datos, que abarcan desde tendencias de mercado hasta estimaciones y pronósticos.
Factores que impulsan el mercado de tarjetas de combustible y oportunidades
Factores que impulsan el mercado:
- Necesidad de mejorar la eficiencia de la flota y el control de costes: La volatilidad de los precios del combustible obliga a las empresas a buscar una visibilidad detallada del consumo. Las tarjetas de combustible ofrecen seguimiento en tiempo real y descuentos por volumen, lo que permite a los gestores de flotas reducir los gastos operativos y eliminar los gastos no autorizados mediante estrictos controles de compra.
- Digitalización acelerada de los ecosistemas de pago: La transición global hacia economías sin efectivo ha acelerado la adopción de tarjetas de combustible. La integración de aplicaciones móviles y tecnologías de pago sin contacto simplifica el proceso de transacción para los conductores, a la vez que proporciona recibos digitales inmediatos para la conciliación administrativa.
- Requisitos estrictos de cumplimiento normativo y fiscal: Las tarjetas de combustible modernas automatizan el complejo proceso de registro de impuestos sobre el combustible y la generación de informes listos para auditoría. Esto es especialmente importante para los operadores de transporte internacional, quienes deben cumplir con diversas jurisdicciones fiscales y normativas medioambientales.
Oportunidades de mercado:
- Expansión hacia los vehículos eléctricos (VE) y las soluciones multienergéticas: a medida que las flotas comerciales transitan hacia la energía sostenible, existe una importante oportunidad para que los proveedores ofrezcan tarjetas híbridas que admitan tanto el repostaje tradicional de petróleo como la carga de vehículos eléctricos dentro de una única plataforma de pago e informes.
- Integración de la telemática y el análisis basado en IA: Más allá de los pagos, existe una creciente demanda de plataformas que combinen datos de combustible con diagnósticos de vehículos. Se presentan oportunidades para desarrollar alertas de mantenimiento predictivo y herramientas de optimización de rutas basadas en datos de eficiencia de combustible en tiempo real.
- Crecimiento en los segmentos de pymes y microflotas: Si bien las grandes empresas cuentan con una buena oferta, el sector de las pequeñas y medianas empresas (pymes) sigue estando desatendido. Adaptar productos de tarjetas de combustible simplificados y de bajo costo para pequeñas empresas de reparto representa una vía de crecimiento con alto margen en los mercados emergentes.
Análisis de segmentación del informe de mercado de tarjetas de combustible
La cuota de mercado de las tarjetas de combustible se analiza en diversos segmentos para comprender mejor su estructura, potencial de crecimiento y tendencias emergentes. A continuación, se muestra el enfoque de segmentación estándar utilizado en la mayoría de los informes del sector:
Por tipo:
- Tarjetas de combustible de marca: Emitidas por compañías petroleras específicas, estas tarjetas se utilizan normalmente dentro de una red propia de estaciones de servicio. Son las preferidas por las flotas que operan en rutas fijas y buscan recompensas y descuentos exclusivos de la marca.
- Tarjetas de combustible universales: Estas tarjetas ofrecen la mayor cobertura y son aceptadas en múltiples marcas y estaciones de servicio independientes. Son el segmento de mayor crecimiento debido a la flexibilidad que brindan a los conductores de larga distancia que requieren diversas opciones de repostaje.
- Tarjetas de combustible para comercios: Emitidas por minoristas o proveedores especializados, estas tarjetas suelen centrarse en nichos específicos o regiones localizadas, ofreciendo ventajas personalizadas para la logística regional y los vehículos de servicio especializados.
Mediante solicitud:
- Repostaje de combustible: El segmento de aplicación principal, centrado en la adquisición simplificada de gasolina, diésel y combustibles alternativos, al tiempo que se capturan datos críticos de la transacción en el punto de venta.
- Aparcamiento: Un segmento de valor añadido en auge donde las tarjetas de combustible se utilizan para pagar el aparcamiento seguro de vehículos comerciales, lo que simplifica la gestión de gastos para los conductores en las zonas urbanas.
- Servicio de vehículos: Esta aplicación permite a los gestores de flotas consolidar los costes de mantenimiento, reparación y sustitución de neumáticos en un único ciclo de facturación, lo que mejora la supervisión del coste total de propiedad del vehículo.
- Cobro de peaje: Las funciones integradas de pago de peaje permiten un tránsito fluido por las autopistas, reduciendo los retrasos y las cargas administrativas asociadas con los pagos manuales en las cabinas de peaje.
- Otros: Incluye servicios diversos como asistencia en carretera, comodidades para el conductor y gastos relacionados con la cabina.
Por geografía:
- América del norte
- Europa
- Asia Pacífico
- América del Sur y Central
- Oriente Medio y África
Alcance del informe de mercado de tarjetas de combustible
| Atributo del informe | Detalles |
|---|---|
| Tamaño del mercado en 2025 | 520.880 millones de dólares estadounidenses |
| Tamaño del mercado para 2034 | 1024.6 mil millones de dólares estadounidenses |
| Tasa de crecimiento anual compuesta global (2026 - 2034) | 7,41% |
| Datos históricos | 2021-2024 |
| Período de pronóstico | 2026-2034 |
| Segmentos cubiertos |
Por tipo
|
| Regiones y países incluidos |
América del norte
|
| Líderes del mercado y perfiles de empresas clave |
|
Densidad de participantes en el mercado de tarjetas de combustible: comprender su impacto en la dinámica empresarial.
El mercado de tarjetas de combustible está experimentando un rápido crecimiento, impulsado por la creciente demanda de los usuarios finales debido a factores como la evolución de las preferencias de los consumidores, los avances tecnológicos y una mayor concienciación sobre los beneficios del producto. A medida que aumenta la demanda, las empresas amplían su oferta, innovan para satisfacer las necesidades de los consumidores y aprovechan las tendencias emergentes, lo que impulsa aún más el crecimiento del mercado.
Análisis de la cuota de mercado de las tarjetas de combustible por región geográfica
Se prevé que la región de Asia-Pacífico experimente el mayor crecimiento en los próximos años. Los mercados emergentes de América del Sur y Central, Oriente Medio y África también ofrecen numerosas oportunidades sin explotar para la expansión de proveedores de pagos digitales y especialistas en gestión de flotas.
El mercado de tarjetas de combustible está experimentando una transformación significativa, pasando de ser una herramienta de conveniencia regional a un ecosistema financiero global basado en datos. El crecimiento se debe a la creciente necesidad de transparencia logística, el auge del transporte impulsado por el comercio electrónico y la adopción de tecnologías de ciudades inteligentes. A continuación, se presenta un resumen de la cuota de mercado y las tendencias por región:
América del norte
- Cuota de mercado: Ocupa una posición de liderazgo a nivel mundial, respaldada por una infraestructura masiva de transporte comercial por carretera y la temprana adopción de la telemática.
-
Factores clave:
- El elevado volumen de operaciones de transporte de mercancías de larga distancia requiere soluciones de pago centralizadas.
- Integración generalizada de los dispositivos de registro electrónico (ELD) con las plataformas de pago de combustible.
- Énfasis intensivo en la prevención del fraude mediante tecnologías avanzadas de chip-and-PIN y monitorización basada en inteligencia artificial.
- Tendencias: Un cambio hacia aplicaciones de movilidad todo en uno que gestionen el combustible, los peajes y el alojamiento, junto con una rápida transición de la fase piloto a la de escala para la infraestructura de carga de vehículos eléctricos.
Europa
- Cuota de mercado: Representa un mercado muy maduro con la mayor densidad de uso de tarjetas de combustible entre las PYME y las flotas de vehículos corporativos.
-
Factores clave:
- Las complejas operaciones logísticas transfronterizas requieren la presentación de informes en múltiples divisas y con múltiples impuestos.
- Mandatos gubernamentales estrictos para el seguimiento de las emisiones de carbono y la gestión sostenible de flotas de vehículos.
- Los elevados precios del combustible están generando una demanda extrema de programas de descuentos basados en la fidelización de clientes.
- Tendencias: Gran énfasis en las tarjetas de combustible ecológicas que ofrecen funciones de compensación de carbono y soporte para combustibles HVO (aceite vegetal hidrotratado) y bio-GNL.
Asia-Pacífico
- Cuota de mercado: La región de mayor crecimiento, impulsada por las enormes inversiones en infraestructura en China, India y el sudeste asiático.
-
Factores clave:
- La rápida urbanización y la proliferación de servicios organizados de logística y entrega.
- Iniciativas gubernamentales para digitalizar la economía y abandonar los pagos en efectivo en el transporte público.
- El aumento de la propiedad de vehículos y la formalización del sector del transporte comercial.
- Tendencias: Integración de los pagos de combustible con las superaplicaciones más populares y un importante impulso por parte de las compañías petroleras nacionales para lanzar programas de fidelización digitales.
América del Sur y Central
- Cuota de mercado: Un mercado emergente con un importante potencial de crecimiento en los sectores de logística artesanal y regional de Brasil y Argentina.
-
Factores clave:
- Existe una creciente necesidad de combatir el robo de combustible y el fraude mediante límites seguros en las transacciones digitales.
- Modernización de las prácticas de gestión de flotas entre los proveedores de transporte agrícola y minero.
- Expansión de las redes de distribución de combustible a regiones rurales que anteriormente no contaban con este servicio.
- Tendencias: Crecimiento de los modelos de tarjetas de combustible prepago para gestionar los riesgos crediticios y un enfoque cada vez mayor en la compatibilidad con monederos móviles para los propietarios-operadores independientes.
Oriente Medio y África
- Cuota de mercado: Un mercado en desarrollo que está pasando de la gestión informal tradicional del combustible a sistemas comerciales formalizados.
-
Factores clave:
- Proyectos de transporte regional a gran escala e iniciativas de ciudades inteligentes en la región del CCG.
- Necesidad de un sistema eficiente de seguimiento del combustible en los sectores de la construcción pesada y de los servicios de petróleo y gas.
- Cambios estratégicos de las compañías petroleras nacionales hacia una oferta diversificada de servicios minoristas.
- Tendencias: Implementación de la identificación de vehículos basada en RFID para el repostaje automatizado y un enfoque creciente en la infraestructura digital ultrarresistente para operaciones en zonas remotas del desierto.
Alta densidad de mercado y competencia
La competencia se intensifica debido a la presencia de líderes consolidados como WEX Inc. y Corpay (antes FleetCor Technologies). Especialistas regionales y empresas de nicho como Edenred (Right Fuel Card), DKV Mobility y Radius Payment Solutions también contribuyen a un mercado diverso y en rápida expansión.
Este entorno competitivo impulsa a los proveedores a diferenciarse a través de:
- Integración de datos y conectividad del ecosistema: Posicionar las tarjetas de combustible como puertas de enlace a un software de gestión de flotas más amplio, haciendo hincapié en la sincronización de datos en tiempo real con los sistemas ERP y la telemática.
- Cartera de servicios ampliada: Incluye gastos no relacionados con el combustible, como la carga de vehículos eléctricos, los peajes y el mantenimiento, para ofrecer una herramienta financiera integral a los conductores.
- Integración vertical: Gestionar la transacción desde el surtidor hasta la oficina administrativa garantiza una mayor seguridad, una liquidación más rápida y la capacidad de ofrecer condiciones de crédito personalizadas a sectores específicos.
- Seguridad y mitigación del fraude: Utilización de inteligencia artificial y aprendizaje automático para detectar patrones de transacciones sospechosas y proporcionar capacidades de geolocalización que restrinjan el uso de la tarjeta a ubicaciones específicas.
Oportunidades y movimientos estratégicos
- Alianzas estratégicas con proveedores de infraestructura para vehículos eléctricos: para seguir siendo relevantes durante la transición energética, las empresas de tarjetas de combustible se están asociando con operadores de redes de carga para ofrecer un servicio de itinerancia sin interrupciones para flotas eléctricas.
- Colaboraciones ágiles en el sector Fintech: Nos asociamos con startups de pagos móviles y blockchain para mejorar la transparencia de las transacciones y reducir el tiempo de procesamiento de los pagos internacionales.
Las principales empresas que operan en el mercado de tarjetas de combustible son:
- BP PLC
- Corporación Exxon Mobil
- Fleetcor Technologies, Inc.
- Royal Dutch Shell plc
- Banco de Estados Unidos
- Wex Inc.
- DKV
- Servicios Mundiales de Combustible
- Edenerd
- Soluciones de pago Radius
Descargo de responsabilidad: Las empresas mencionadas anteriormente no están clasificadas en ningún orden en particular.
Noticias y novedades del mercado de tarjetas de combustible
- En septiembre de 2025, Right Fuel Card, perteneciente al Grupo Edenred, anunció el lanzamiento de Edenred Black, una tarjeta de combustible premium que supuso una importante evolución en la gestión del combustible de las flotas en el Reino Unido. Al ser la única tarjeta de combustible del país que combinaba el acceso a las estaciones de servicio BP y Shell en una sola tarjeta a un precio semanal fijo, Edenred Black ofrecía a los operadores de flotas una nueva y potente herramienta para optimizar las operaciones, reducir costes y, como primicia en el sector, acceder a programas de fidelización.
- En julio de 2025, Corpay revolucionó el panorama para los gestores de flotas con el lanzamiento de sus innovaciones más recientes: la tarjeta de combustible Corpay One Select para flotas mixtas y la tarjeta de combustible diésel Corpay One Select. Estas soluciones de última generación combinaban descuentos líderes en el mercado, controles de gastos optimizados y una gestión de mantenimiento más inteligente, todo ello integrado en la potente plataforma Corpay One.
Cobertura y entregables del informe de mercado de tarjetas de combustible
El informe "Tamaño y pronóstico del mercado de tarjetas de combustible (2021-2034)" proporciona un análisis detallado del mercado que abarca las siguientes áreas:
- Tamaño y pronóstico del mercado de tarjetas de combustible a nivel global, regional y nacional para todos los segmentos clave del mercado cubiertos en el alcance.
- Tendencias del mercado de tarjetas de combustible, así como dinámicas del mercado como factores impulsores, limitaciones y oportunidades clave.
- Análisis detallado PEST y FODA
- Análisis del mercado de tarjetas de combustible que abarca las principales tendencias del mercado, el marco global y regional, los principales actores, las regulaciones y los desarrollos recientes del mercado.
- Análisis del panorama de la industria y de la competencia, que abarca la concentración del mercado, el análisis de mapas de calor, los principales actores y los desarrollos recientes en el mercado de tarjetas de combustible.
- Perfiles detallados de las empresas

Ankita es una profesional dinámica en investigación de mercados y consultoría con más de 8 años de experiencia en los sectores de tecnología, medios de comunicación, TIC, electrónica y semiconductores. Ha liderado y ejecutado con éxito más de 100 proyectos de consultoría e investigación para clientes globales como Microsoft, Oracle, NEC Corporation, SAP, KPMG y Expeditors International. Sus principales competencias incluyen la evaluación de mercado, el análisis de datos, la previsión, la formulación de estrategias, la inteligencia competitiva y la redacción de informes.
Ankita es experta en la gestión de ciclos completos de proyecto, desde el diseño de propuestas de preventa y las conversaciones con los clientes hasta la entrega de información práctica posventa. Es experta en la gestión de equipos multifuncionales, la estructuración de módulos de investigación complejos y la alineación de soluciones con los objetivos de negocio específicos del cliente. Sus excelentes habilidades de comunicación, liderazgo y presentación le han permitido obtener constantemente resultados orientados al valor en entornos de mercado dinámicos y en constante evolución.
- Análisis exhaustivo del tamaño del mercado y previsiones
- Análisis detallado de la segmentación
- Evaluación en profundidad de la dinámica del mercado
- Información a nivel regional y nacional
- Panorama competitivo y análisis comparativo de empresas
- Inteligencia empresarial estratégica
Testimonios
El informe de mercado de sistemas SCADA de Insight Partners es completo y ofrece información valiosa sobre las tendencias actuales y las previsiones futuras. El equipo fue altamente profesional, receptivo y me brindó un gran apoyo en todo momento. Estamos muy satisfechos y recomendamos ampliamente sus servicios.
RAN KEDEM Socio, Reali Technologies LTDsSolicité un informe sobre un mercado de software muy específico y el equipo lo elaboró en pocos días. La información era muy relevante y estaba bien presentada. Posteriormente, solicité algunos cambios y adiciones al informe. El equipo fue muy receptivo y recibí el informe final en menos de una semana.
JEAN-HERVE JENN Presidente, Future AnalyticaTrabajamos con The Insight Partners para un importante estudio y pronóstico de mercado. Nos brindaron una visión clara de las oportunidades y los riesgos, lo que nos ayudó a definir nuestros planes. Su investigación fue fácil de usar y se basó en datos sólidos. Nos ayudó a tomar decisiones inteligentes y seguras. Los recomendamos ampliamente.
PIYUSH NAGPAL Vicepresidente Sénior, , High Beam GlobalThe Insight Partners realizó una investigación de mercado profunda y bien estructurada con una sólida experiencia en el sector. Su equipo fue profesional y receptivo en todo momento. El sitio web, fácil de usar, facilitó el acceso a los informes del sector. Los recomendamos ampliamente por sus servicios de investigación confiables y de alta calidad.
YUKIHIKO ADACHI Director Ejecutivo, , Deep Blue, LLCEsta es la primera vez que compro un informe de mercado de The Insight Partners. Aunque al principio tenía dudas, visité su sitio web y me sentí más cómodo al arriesgarme y comprarlo. Estoy completamente satisfecho con la calidad del informe y el servicio al cliente. Tenía varias preguntas y comentarios sobre el informe inicial, pero después de un par de conversaciones por correo electrónico con su analista, creo que tengo un informe que puedo usar como base para nuestro proceso de planificación estratégica. Muchas gracias por tomarse el tiempo y hacer de esta una experiencia positiva. Sin duda, recomendaré sus servicios y serán mi primera opción cuando necesitemos más datos de mercado.
JOHN SUZUKI Presidente y Director Ejecutivo, Director de la Junta Directiva, BK TechnologiesAgradezco su apoyo y la profesionalidad que demostraron al atender mi solicitud de información sobre el mercado de diagnóstico in vitro (IVD) para enfermedades infecciosas en Nigeria. Agradezco su paciencia, su orientación y su disposición a ofrecerme un descuento, lo que finalmente nos permitió cerrar un trato. Espero poder colaborar con The Insight Partners en el futuro, gracias a la impresión que me causó este primer encuentro.
DRA. CHIJIOKE ONYIA, DIRECTORA GENERAL, PineCrest Healthcare Ltd.Razón para comprar
- Toma de decisiones informada
- Comprensión de la dinámica del mercado
- Análisis competitivo
- Información sobre clientes
- Pronósticos del mercado
- Mitigación de riesgos
- Planificación estratégica
- Justificación de la inversión
- Identificación de mercados emergentes
- Mejora de las estrategias de marketing
- Impulso de la eficiencia operativa
- Alineación con las tendencias regulatorias


