Analyse et prévisions du marché des interfaces de communication par taille, part, croissance et tendances 2031
Données historiques : 2021-2022 | Année de référence : 2023 | Période de prévision : 2024-2031Taille et prévisions du marché des interfaces de communication (2021-2031), parts mondiales et régionales, tendances et opportunités de croissance. Rapport d'analyse : par produit (1 port, 2 ports et autres), mode de communication (filaire (Ethernet, USB, RS-232/RS-485 et autres) et sans fil et hybride), application (surveillance industrielle, système de surveillance de batterie, communication par capteurs à distance, système de signalisation ferroviaire, communication machine à machine et autres), et géographie.
- Statut : Données publiées
- Code du rapport : TIPRE00012442
- Catégorie : Électronique et semi-conducteurs
- Nombre de pages : 150
- Formats de rapport disponibles :


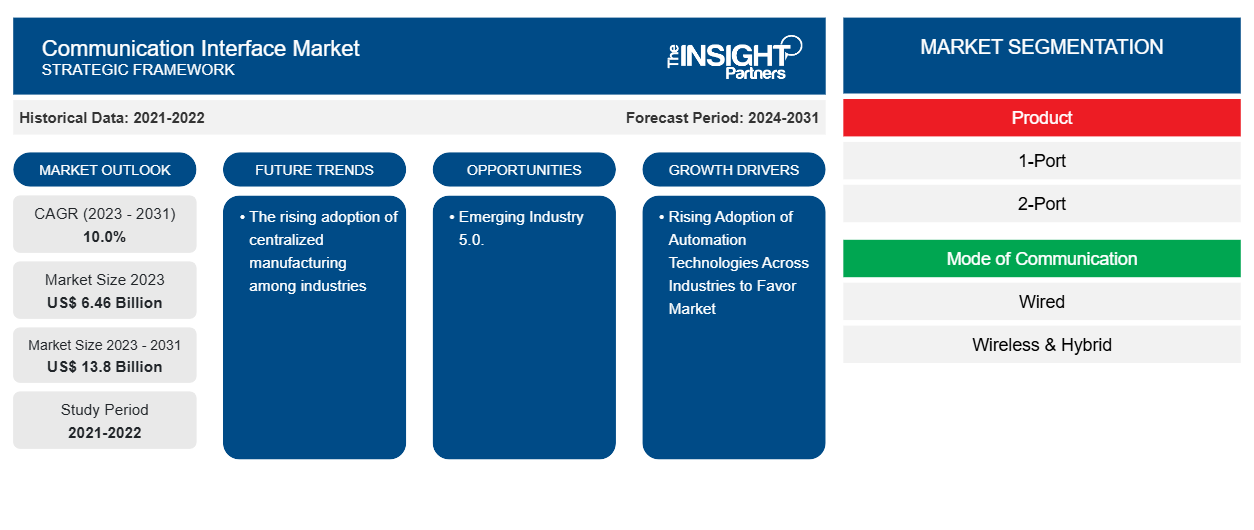
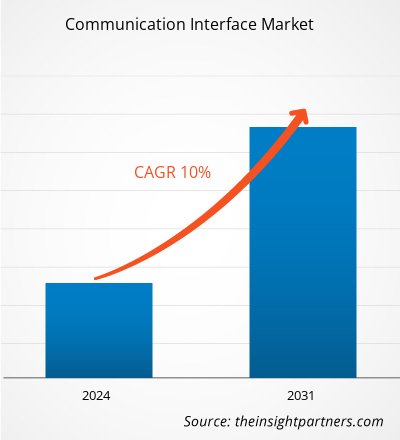
La taille du marché des interfaces de communication devrait atteindre 13,8 milliards de dollars américains d’ici 2031, contre 6,46 milliards de dollars américains en 2023. Le marché devrait enregistrer un TCAC de 10,0 % au cours de la période 2023-2031. L’adoption croissante des technologies d’automatisation dans tous les secteurs et le développement accru des robots seront probablement les principaux moteurs et tendances du marché des interfaces de communication.
Analyse du marché des interfaces de communication
Le marché des interfaces de communication connaît une croissance significative à l'échelle mondiale. Cette croissance est attribuée à l'adoption croissante des technologies d'automatisation dans les industries et au développement accru des robots. De plus, l'émergence de l'industrie 5.0 et l'adoption croissante de la fabrication centralisée dans les industries devraient stimuler le marché dans les années à venir.
Aperçu du marché des interfaces de communication
Les interfaces de communication sont les interfaces et protocoles qui permettent aux logiciels, systèmes d'exploitation, répertoires, réseaux, systèmes d'exploitation réseau ou logiciels Web installés sur un ordinateur d'interagir avec le logiciel de la plate-forme Microsoft sur un autre ordinateur, y compris, sans limitation, les communications conçues pour garantir la sécurité, l'authentification ou la confidentialité.
Personnalisez ce rapport en fonction de vos besoins
Vous bénéficierez d'une personnalisation gratuite de n'importe quel rapport, y compris de certaines parties de ce rapport, d'une analyse au niveau des pays, d'un pack de données Excel, ainsi que d'offres et de remises exceptionnelles pour les start-ups et les universités.
Marché des interfaces de communication : perspectives stratégiques
-
Obtenez les principales tendances clés du marché de ce rapport.Cet échantillon GRATUIT comprendra une analyse de données, allant des tendances du marché aux estimations et prévisions.
Facteurs moteurs et opportunités du marché des interfaces de communication
L'adoption croissante des technologies d'automatisation dans tous les secteurs favorise le marché
L'adoption croissante des technologies d'automatisation dans les industries stimule en effet le marché des interfaces de communication. Cela est dû à des facteurs tels que l'importance croissante de l'interconnectivité. Il existe un besoin important de communication transparente et pratique entre les différents systèmes et appareils d'automatisation. L'interface de communication permet le transfert de données et la communication entre les appareils. Les interfaces de communication courantes comprennent les interfaces USB, les interfaces HDMI, les interfaces VGA, les interfaces Ethernet, les interfaces réseau sans fil , etc. Ces interfaces peuvent être utilisées pour connecter des ordinateurs, des périphériques externes, des périphériques réseau, des moniteurs, des imprimantes, etc., pour réaliser des fonctions de transmission de données et de communication. À mesure que les industries intensifient leurs efforts d'automatisation, elles ont besoin d'une interface de communication qui peut facilement s'adapter aux nouvelles exigences et extensions.interconnectivity. There is a high need for seamless and convenient communication between various systems and devices in automation. The communication interface enables data transfer and communication between devices. Common communication interfaces include USB interfaces, HDMI interfaces, VGA interfaces, Ethernet interfaces,
Industrie émergente 5.0.
Le terme Industrie 5.0 fait référence aux personnes travaillant aux côtés de robots et de machines intelligentes. Il s'agit de robots aidant les humains à travailler mieux et plus rapidement en exploitant des technologies avancées telles que l'Internet des objets (IoT) et le big data. Il ajoute une touche humaine personnelle aux piliers de l'Industrie 4.0 que sont l'automatisation et l'efficacité. L'Industrie 5.0 ouvre la voie au prochain cycle d'innovation industrielle qui s'aligne sur les plateformes compatibles avec la quatrième itération et aborde l'importance de la collaboration entre la machine et l'homme, c'est-à-dire les robots collaboratifs. Les réseaux de communication jouent un rôle essentiel dans le maintien de l'intégration et de l'hyperconnectivité entre l'homme et les machines. Avec l'évolution des appareils en systèmes de systèmes, tels que l'intégration de l'Internet des objets (IoT) et des systèmes cyberphysiques (CPS), les caractéristiques des réseaux ont subi des changements importants.IoT) and big data. It adds a personal human touch to the Industry 4.0 pillars of automation and efficiency. Industry 5.0 paves the way to the next industrial innovation cycle that aligns with the platforms compatible with the fourth iteration and addresses the importance of collaboration between machine and man, i.e., collaborative robots. Communication networks play a pivotal role in maintaining the integration and hyperconnectivity between man and machines. With the evolution of devices into systems of systems, such as the integration of the Internet of Things (IoT) and cyber-physical systems (CPS), the characteristics of networks have undergone significant changes.
Analyse de segmentation du rapport sur le marché des interfaces de communication
Les segments clés qui ont contribué à l’élaboration de l’analyse du marché des interfaces de communication sont le produit, le mode de communication et l’application.
- En fonction du produit, le marché des interfaces de communication est divisé en 1 port, 2 ports et autres. Le segment 1 port devrait détenir une part de marché importante au cours de la période de prévision.
- En fonction du mode de communication, le marché des interfaces de communication est divisé en deux catégories : filaire (Ethernet, USB, RS-232/RS-485 et autres) et sans fil et hybride. Le segment filaire (Ethernet, USB, RS-232/RS-485 et autres) devrait détenir une part de marché importante au cours de la période de prévision.ethernet, USB, RS-232/RS-485, and others) and wireless & hybrid. The wired (ethernet, USB, RS-232/RS-485, and others) segment is anticipated to hold a significant market share in the forecast period.
- En termes d'applications, le marché est segmenté en surveillance industrielle, systèmes de surveillance de batterie, communication par capteurs à distance, systèmes de signalisation ferroviaire, communication machine à machine, etc. La surveillance industrielle devrait détenir une part de marché importante au cours de la période de prévision.
Analyse des parts de marché des interfaces de communication par zone géographique
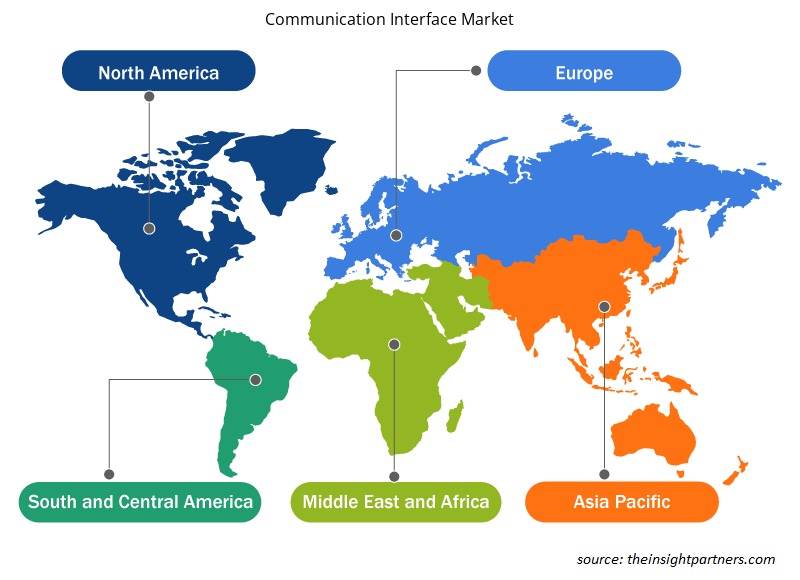
La portée géographique du rapport sur le marché des interfaces de communication est principalement divisée en cinq régions : Amérique du Nord, Asie-Pacifique, Europe, Moyen-Orient et Afrique, et Amérique du Sud et centrale.
L'Amérique du Nord domine le marché des interfaces de communication. Les tendances d'adoption de haute technologie dans diverses industries de la région nord-américaine ont alimenté la croissance du marché des interfaces de communication. Des facteurs tels que l'adoption accrue d'outils numériques et les dépenses technologiques élevées des agences gouvernementales devraient stimuler la croissance du marché nord-américain des interfaces de communication. De plus, l'accent mis sur la recherche et le développement dans les économies développées des États-Unis et du Canada oblige les acteurs nord-américains à introduire des solutions technologiquement avancées sur le marché. En outre, les États-Unis comptent un grand nombre d'acteurs du marché des interfaces de communication qui se concentrent de plus en plus sur le développement de solutions innovantes. Tous ces facteurs contribuent à la croissance du marché des interfaces de communication dans la région.fuelled the growth of the communication interface market. Factors such as increased adoption of digital tools and high technological spending by government agencies are expected to drive the North American communication interface market growth. Moreover, a strong emphasis on research and development in the developed economies of the US and Canada is forcing the North American players to bring technologically advanced solutions into the market. In addition, the US has a large number of communication interface market players who have been increasingly focusing on developing innovative solutions. All these factors contribute to the region's growth of the communication interface market.
Aperçu régional du marché des interfaces de communication
Les tendances et facteurs régionaux influençant le marché des interfaces de communication tout au long de la période de prévision ont été expliqués en détail par les analystes d’Insight Partners. Cette section traite également des segments et de la géographie du marché des interfaces de communication en Amérique du Nord, en Europe, en Asie-Pacifique, au Moyen-Orient et en Afrique, ainsi qu’en Amérique du Sud et en Amérique centrale.
- Obtenez les données régionales spécifiques au marché des interfaces de communication
Portée du rapport sur le marché des interfaces de communication
| Attribut de rapport | Détails |
|---|---|
| Taille du marché en 2023 | 6,46 milliards de dollars américains |
| Taille du marché d'ici 2031 | 13,8 milliards de dollars américains |
| Taux de croissance annuel composé mondial (2023-2031) | 10,0% |
| Données historiques | 2021-2022 |
| Période de prévision | 2024-2031 |
| Segments couverts |
Par produit
|
| Régions et pays couverts |
Amérique du Nord
|
| Leaders du marché et profils d'entreprises clés |
|
Densité des acteurs du marché des interfaces de communication : comprendre son impact sur la dynamique des entreprises
Le marché des interfaces de communication connaît une croissance rapide, tirée par la demande croissante des utilisateurs finaux en raison de facteurs tels que l'évolution des préférences des consommateurs, les avancées technologiques et une plus grande sensibilisation aux avantages du produit. À mesure que la demande augmente, les entreprises élargissent leurs offres, innovent pour répondre aux besoins des consommateurs et capitalisent sur les tendances émergentes, ce qui alimente davantage la croissance du marché.
La densité des acteurs du marché fait référence à la répartition des entreprises ou des sociétés opérant sur un marché ou un secteur particulier. Elle indique le nombre de concurrents (acteurs du marché) présents sur un marché donné par rapport à sa taille ou à sa valeur marchande totale.
Les principales entreprises opérant sur le marché des interfaces de communication sont :
- ABB Ltée.
- Eaton Corp Plc
- Honeywell International Inc
- Société Omron
- Rockwell Automation Inc
- Systèmes de jaugeage; Inc
Avis de non-responsabilité : les sociétés répertoriées ci-dessus ne sont pas classées dans un ordre particulier.
- Obtenez un aperçu des principaux acteurs du marché des interfaces de communication
Actualités et développements récents du marché des interfaces de communication
Le marché des interfaces de communication est évalué en collectant des données qualitatives et quantitatives après des recherches primaires et secondaires, qui comprennent d'importantes publications d'entreprise, des données d'association et des bases de données. Quelques-uns des développements du marché des interfaces de communication sont énumérés ci-dessous :
- Siemens lance le module d'interface de communication LOGO!. Avec plusieurs protocoles de communication, Modbus RTU/TCP, l'intégration d'applications via API RESTful et la possibilité d'accès au cloud, le LOGO! CIM est un véritable changement de jeu. Le LOGO! CIM permet d'envoyer et de recevoir des SMS, ainsi que de transférer des données des appareils LOGO! 8.3 vers le cloud AWS. Grâce au récepteur GNSS intégré (GPS), la position peut être suivie et transmise. (Source : site Web de la société Siemens, mai 2023)
- L'Inde a lancé l'interface de paiement unifiée (UPI) dans les Galeries Lafayette, grand magasin historique de Paris, après un lancement réussi dans l'emblématique Tour Eiffel. (Communiqué de presse, juillet 2024)
Rapport sur le marché des interfaces de communication : couverture et livrables
Le rapport « Taille et prévisions du marché des interfaces de communication (2021-2031) » fournit une analyse détaillée du marché couvrant les domaines ci-dessous :
- Taille et prévisions du marché des interfaces de communication aux niveaux mondial, régional et national pour tous les segments de marché clés couverts par le périmètre
- Tendances du marché des interfaces de communication ainsi que dynamique du marché telles que les facteurs moteurs, les contraintes et les opportunités clés
- Analyse détaillée des cinq forces de PEST/Porter et SWOT
- Analyse du marché des interfaces de communication couvrant les principales tendances du marché, le cadre mondial et régional, les principaux acteurs, les réglementations et les développements récents du marché
- Analyse du paysage industriel et de la concurrence couvrant la concentration du marché, l'analyse de la carte thermique, les principaux acteurs et les développements récents du marché des interfaces de communication.
- Profils d'entreprise détaillés

Naveen est un professionnel expérimenté des études de marché et du conseil, fort de plus de 9 ans d'expertise dans des projets personnalisés, syndiqués et de conseil. Actuellement vice-président associé, il a géré avec succès les parties prenantes tout au long de la chaîne de valeur des projets et a rédigé plus de 100 rapports de recherche et plus de 30 missions de conseil. Son expertise couvre des projets industriels et gouvernementaux, contribuant significativement à la réussite de ses clients et à la prise de décision fondée sur les données.
Naveen est titulaire d'un diplôme d'ingénieur en électronique et communication de la VTU, Karnataka, et d'un MBA en marketing et opérations de l'Université de Manipal. Membre actif de l'IEEE depuis 9 ans, il a participé à des conférences et des colloques techniques et s'est porté volontaire au niveau des sections et des régions. Avant d'occuper ce poste, il a travaillé comme consultant stratégique associé chez IndustryARC et comme consultant en serveurs industriels chez Hewlett Packard (HP Global).
- Analyse historique (2 ans), année de base, prévision (7 ans) avec TCAC
- Analyse PEST et SWOT
- Taille du marché Valeur / Volume - Mondial, Régional, Pays
- Industrie et paysage concurrentiel
- Ensemble de données Excel
Témoignages
Le rapport sur le marché des systèmes SCADA d'Insight Partners est complet et fournit des informations précieuses sur les tendances actuelles et les prévisions. L'équipe a fait preuve d'un grand professionnalisme, d'une grande réactivité et d'un grand soutien tout au long du projet. Nous sommes très satisfaits et recommandons vivement leurs services.
RAN KEDEM Partenaire, Reali Technologies LTDJ'ai demandé un rapport sur un marché logiciel très spécifique et l'équipe l'a produit en quelques jours. Les informations étaient très pertinentes et bien présentées. J'ai ensuite demandé des modifications et des ajouts au rapport. L'équipe a de nouveau été très réactive et j'ai reçu le rapport final en moins d'une semaine.
JEAN-HERVÉ JENN Président, Future AnalyticaNous avons collaboré avec The Insight Partners pour une importante étude de marché et des prévisions. Ils nous ont fourni une vision claire des opportunités et des risques, ce qui nous a aidés à élaborer nos plans. Leurs recherches étaient faciles à utiliser et basées sur des données solides. Elles nous ont permis de prendre des décisions éclairées et en toute confiance. Nous les recommandons vivement.
PIYUSH NAGPAL Vice-président principal, Feux de route mondiauxInsight Partners a réalisé une étude de marché pertinente et bien structurée, avec une solide expertise du domaine. Son équipe a fait preuve de professionnalisme et de réactivité tout au long du projet. Son site web convivial a facilité l'accès aux rapports sectoriels. Nous recommandons vivement ses services d'études fiables et de haute qualité.
YUKIHIKO ADACHI PDG, Bleu profond, LLC.C'est la première fois que j'achète une étude de marché auprès de The Insight Partners. J'étais un peu hésitant au début, mais j'ai consulté leur site web et me suis senti plus à l'aise pour prendre le risque d'acheter une étude de marché. Je suis entièrement satisfait de la qualité du rapport et du service client. J'avais plusieurs questions et commentaires concernant le rapport initial, mais après quelques échanges par e-mail avec leur analyste, je pense avoir obtenu un rapport qui pourra alimenter notre processus de planification stratégique. Merci beaucoup pour votre temps et pour avoir rendu cette expérience positive. Je recommanderai sans hésiter vos services et vous serez mon premier contact lorsque nous aurons besoin de données de marché supplémentaires.
JOHN SUZUKI Président-directeur général, administrateur du conseil d'administration, BK TechnologiesJe tiens à vous remercier pour votre soutien et le professionnalisme dont vous avez fait preuve lors du traitement de ma demande d'informations concernant le marché des dispositifs de diagnostic in vitro (DIV) pour les maladies infectieuses au Nigéria. J'apprécie votre patience, vos conseils et votre volonté d'offrir une réduction, ce qui nous a finalement permis de conclure un accord. Je me réjouis de collaborer à nouveau avec The Insight Partners, grâce à l'impression que vous m'avez laissée suite à cette première rencontre.
DR CHIJIOKE DIRECTEUR GÉNÉRAL D'ONYIA, PineCrest Healthcare Ltd.Raison d'acheter
- Prise de décision éclairée
- Compréhension de la dynamique du marché
- Analyse concurrentielle
- Connaissances clients
- Prévisions de marché
- Atténuation des risques
- Planification stratégique
- Justification des investissements
- Identification des marchés émergents
- Amélioration des stratégies marketing
- Amélioration de l'efficacité opérationnelle
- Alignement sur les tendances réglementaires


Débloquez des remises exclusives sur les rapports
Demander maintenant


 Obtenez un échantillon gratuit pour - Marché des interfaces de communication