
Dimensioni del mercato degli strumenti di rilevamento delle frodi pubblicitarie e opportunità chiave entro il 2034
Dimensioni e previsioni del mercato degli strumenti di rilevamento delle frodi pubblicitarie (2021-2034), quota globale e regionale, trend e opportunità di crescita. Copertura del rapporto di analisi: per tipo (sito web e dispositivi mobili) e utente finale (e-commerce, viaggi, finanza, giochi e altri).
- Stato : Dati rilasciati
- Codice del report : TIPRE00019813
- Categoria : Tecnologia, media e telecomunicazioni
- Numero di pagine : 150
- Formati di report disponibili :


- Data dell'ultimo aggiornamento : December 11, 2025

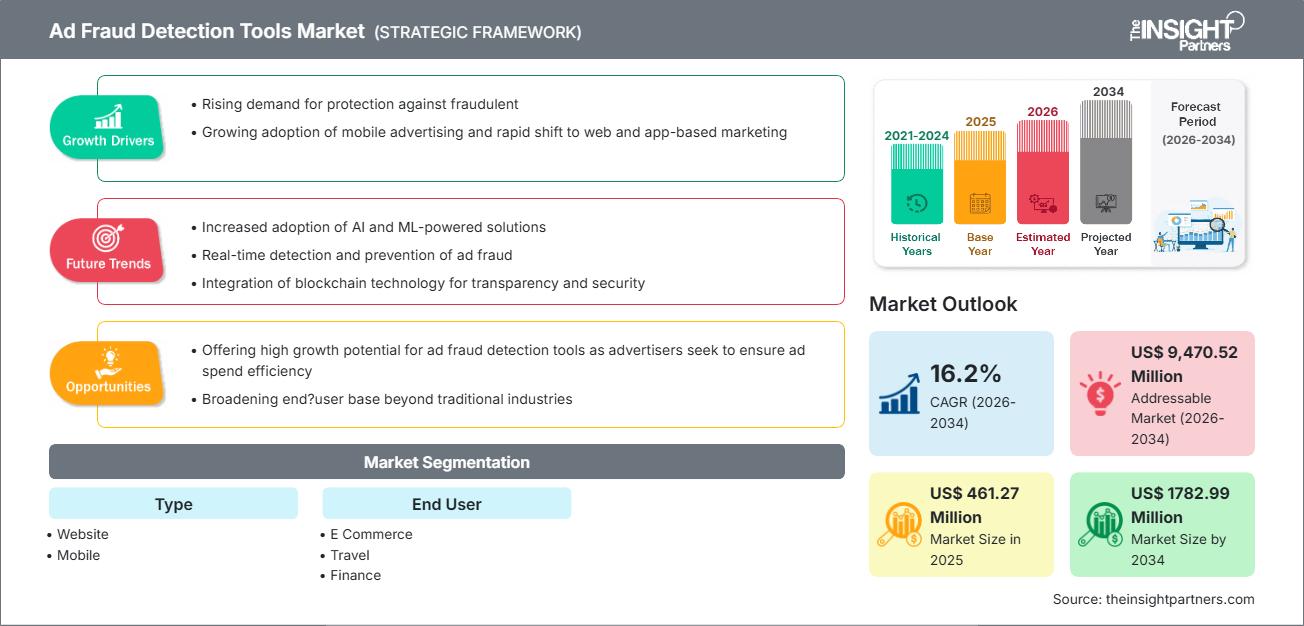
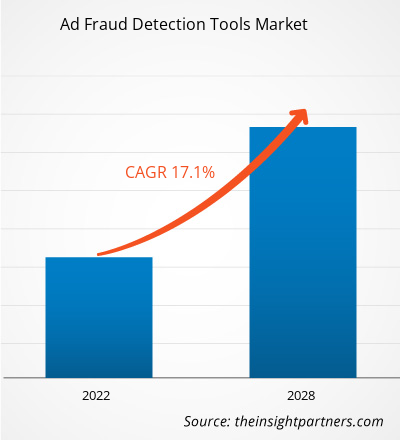
Si prevede che il mercato degli strumenti di rilevamento delle frodi pubblicitarie crescerà da 461,27 milioni di dollari nel 2025 a 1.782,99 milioni di dollari entro il 2034. Si prevede che il mercato registrerà un CAGR del 16,2% nel periodo 2026-2034.
Analisi di mercato degli strumenti di rilevamento delle frodi pubblicitarie
Le previsioni di mercato degli strumenti di rilevamento delle frodi pubblicitarie indicano una forte crescita, trainata dal crescente numero di campagne pubblicitarie digitali, dalla crescente consapevolezza delle frodi pubblicitarie e dalla necessità di proteggere la spesa pubblicitaria dal traffico fraudolento e dai clic non validi.
L'espansione è facilitata dal crescente utilizzo della pubblicità su dispositivi mobili e sul web, dalla proliferazione di PMI e start-up che utilizzano il marketing digitale e dall'aumento della spesa pubblicitaria nei settori dell'e-commerce, della finanza, dei giochi e di altri settori incentrati sul digitale.
Inoltre, il passaggio alla pubblicità multi-dispositivo e multi-canale e l'aumento degli acquisti di annunci programmatici rendono gli strumenti di rilevamento delle frodi pubblicitarie essenziali per massimizzare il ROI e prevenire la perdita di entrate, posizionando tali strumenti come essenziali per gli inserzionisti di tutte le dimensioni.
Panoramica del mercato degli strumenti di rilevamento delle frodi pubblicitarie
Gli strumenti di rilevamento delle frodi pubblicitarie sono soluzioni specializzate progettate per identificare, prevenire e mitigare le attività fraudolente nella pubblicità online, tra cui frodi sui clic, frodi sulle impressioni, frodi sulle installazioni e altro traffico non valido (IVT) o traffico non umano. Questi strumenti aiutano gli inserzionisti a garantire che la loro spesa pubblicitaria si traduca in un reale coinvolgimento degli utenti, metriche accurate e conversioni legittime.
Automatizzando il rilevamento del traffico sospetto, monitorando le campagne in tempo reale e fornendo analisi e reportistica, questi strumenti consentono agli inserzionisti di ottimizzare le prestazioni degli annunci, ridurre le perdite finanziarie e proteggere la reputazione del brand. Con la continua crescita della pubblicità digitale in termini di complessità e scala, gli strumenti di rilevamento delle frodi pubblicitarie fungono da spina dorsale per la sicurezza e l'integrità della pubblicità digitale in settori come l'e-commerce, la finanza, il gaming, i viaggi e altri ancora.
Personalizza questo report in base alle tue esigenze
Otterrai la personalizzazione gratuita di qualsiasi report, incluse parti di questo report, analisi a livello nazionale, pacchetto dati Excel e potrai usufruire di fantastiche offerte e sconti per start-up e università.
Mercato degli strumenti di rilevamento delle frodi pubblicitarie: approfondimenti strategici
-
Scopri le principali tendenze di mercato di questo rapporto.Questo campione GRATUITO includerà analisi dei dati, che spaziano dalle tendenze di mercato alle stime e alle previsioni.
Strumenti di rilevamento delle frodi pubblicitarie, driver di mercato e opportunità
Fattori trainanti del mercato:
- Crescente domanda di protezione contro il traffico pubblicitario fraudolento, con l'espansione a livello globale della pubblicità digitale e degli acquisti programmatici di annunci.
- La crescente adozione della pubblicità su dispositivi mobili e il rapido passaggio al marketing basato su web e app; la crescita della spesa pubblicitaria trainata dai dispositivi mobili alimenta la necessità di individuare le frodi.
- Un numero crescente di PMI e start-up utilizza il marketing digitale, il che ha portato a una più ampia adozione di strumenti di rilevamento delle frodi pubblicitarie per salvaguardare i propri budget pubblicitari.
Opportunità di mercato:
- Espansione nei mercati emergenti, regioni in cui la pubblicità digitale sta crescendo rapidamente (ad esempio, Asia-Pacifico, altre regioni in via di sviluppo), offrendo un elevato potenziale di crescita per gli strumenti di rilevamento delle frodi pubblicitarie, poiché gli inserzionisti cercano di garantire l'efficienza della spesa pubblicitaria.
- Ampliando la base di utenti finali oltre i settori tradizionali: e-commerce, gaming, finanza, viaggi, poiché sempre più settori si affidano alla pubblicità digitale, aumenta la domanda di un efficace rilevamento delle frodi.
- La crescente sofisticazione degli schemi fraudolenti (bot, click farm, frodi di installazione, frodi di impressioni) sta determinando una crescente domanda di strumenti di analisi e rilevamento avanzati e in tempo reale, sfruttando possibilmente l'apprendimento automatico/intelligenza artificiale e l'analisi dei big data per restare un passo avanti ai truffatori.
Analisi della segmentazione del mercato degli strumenti di rilevamento delle frodi pubblicitarie
Per tipo:
- Sito web
- Mobile
Da parte dell'utente finale:
- Commercio elettronico
- Viaggio
- Finanza
- Gioco d'azzardo
Per geografia:
- America del Nord
- Europa
- Asia-Pacifico (APAC)
- America meridionale e centrale (SAM)
- Medio Oriente e Africa (MEA)
Approfondimenti regionali sul mercato degli strumenti di rilevamento delle frodi pubblicitarie
Le tendenze e i fattori regionali che hanno influenzato il mercato degli strumenti di rilevamento delle frodi pubblicitarie durante il periodo di previsione sono stati ampiamente spiegati dagli analisti di The Insight Partners. Questa sezione illustra anche i segmenti e la geografia del mercato degli strumenti di rilevamento delle frodi pubblicitarie in Nord America, Europa, Asia-Pacifico, Medio Oriente e Africa, America Meridionale e Centrale.
Ambito del rapporto di mercato sugli strumenti di rilevamento delle frodi pubblicitarie
| Attributo del report | Dettagli |
|---|---|
| Dimensioni del mercato nel 2025 | 461,27 milioni di dollari USA |
| Dimensioni del mercato entro il 2034 | 1.782,99 milioni di dollari USA |
| CAGR globale (2026 - 2034) | 16,2% |
| Dati storici | 2021-2024 |
| Periodo di previsione | 2026-2034 |
| Segmenti coperti |
Per tipo
|
| Regioni e paesi coperti |
America del Nord
|
| Leader di mercato e profili aziendali chiave |
|
Strumenti di rilevamento delle frodi pubblicitarie, densità degli attori del mercato: comprendere il suo impatto sulle dinamiche aziendali
Il mercato degli strumenti per il rilevamento delle frodi pubblicitarie è in rapida crescita, trainato dalla crescente domanda degli utenti finali, dovuta a fattori quali l'evoluzione delle preferenze dei consumatori, i progressi tecnologici e una maggiore consapevolezza dei vantaggi del prodotto. Con l'aumento della domanda, le aziende stanno ampliando la propria offerta, innovando per soddisfare le esigenze dei consumatori e sfruttando le tendenze emergenti, alimentando ulteriormente la crescita del mercato.
- Ottieni una panoramica dei principali attori del mercato degli strumenti di rilevamento delle frodi pubblicitarie
Analisi della quota geografica del mercato degli strumenti di rilevamento delle frodi pubblicitarie per regione
- Nord America: nel 2021, il Nord America deteneva una quota significativa del mercato globale degli strumenti di rilevamento delle frodi pubblicitarie, beneficiando di un'elevata spesa pubblicitaria digitale, dell'adozione di tecnologie avanzate e di una forte domanda di prevenzione delle frodi.
- Europa: la presenza di mercati pubblicitari digitali maturi e il crescente controllo normativo sulla trasparenza pubblicitaria e sulla prevenzione delle frodi contribuiscono a una domanda costante di strumenti di rilevamento delle frodi pubblicitarie.
- Asia-Pacifico (APAC): la regione rappresenta un'opportunità di forte crescita, trainata dalla rapida espansione della pubblicità digitale, dal crescente numero di PMI e piattaforme di e-commerce e dalla crescente consapevolezza tra gli inserzionisti delle frodi pubblicitarie.
- America Meridionale e Centrale (SAM) e Medio Oriente e Africa (MEA): si tratta di mercati emergenti con una crescente penetrazione digitale e una spesa pubblicitaria in graduale aumento. Con l'espansione della pubblicità digitale in queste regioni, si prevede un aumento della domanda di strumenti per il rilevamento delle frodi pubblicitarie.
Nel complesso, sebbene il Nord America rimanga attualmente la regione dominante, si prevede che la crescita più rapida si verificherà nella regione Asia-Pacifico e in altre regioni emergenti, a causa della crescente adozione della pubblicità digitale e delle crescenti preoccupazioni relative alle frodi pubblicitarie.
Strumenti di rilevamento delle frodi pubblicitarie, densità e concorrenza degli attori del mercato
Questo ambiente competitivo spinge i fornitori a differenziarsi attraverso:
- Funzionalità avanzate di rilevamento delle frodi (mobile + web, monitoraggio multi-dispositivo, analisi in tempo reale)
- Scalabilità per servire sia le PMI che le grandi imprese
- Integrazione con piattaforme pubblicitarie, strumenti di analisi e stack di marketing
- Flessibilità di adattamento ai modelli di frode e ai formati pubblicitari in continua evoluzione (video, dispositivi mobili, programmatici, ecc.)
Restano opportunità per i player emergenti, in particolare per quelli che si concentrano su soluzioni su misura per aree geografiche specifiche (ad esempio APAC, MEA) o settori verticali (giochi, finanza, e-commerce), dove la spesa pubblicitaria digitale sta aumentando rapidamente e il rischio di frode è elevato.
Il mercato globale degli strumenti per il rilevamento delle frodi pubblicitarie comprende diversi fornitori di spicco, tra cui:
- AppsFlyer Ltd.
- Adjust GmbH
- Branch Metrics, Inc.
- Punteggio di frode
- Intercettato (App Samurai Inc.)
- Machine Advertising Limited
- Perform[cb], LLC
- Scalarr Inc.
- Singular Labs, Inc.
Altri attori analizzati nel corso della ricerca sono:
- Scienza pubblicitaria integrale (IAS)
- Doppia verifica
- Fossato
- UMANO (precedentemente White Ops)
- Fraudlogix
- Pixalato
- Forensiq (di Impact)
- CHEQ AI Technologies Ltd. (CHEQ)
Opportunità e mosse strategiche
- Collaborare con piattaforme pubblicitarie digitali, reti pubblicitarie mobili ed editori per integrare il rilevamento delle frodi come parte della distribuzione e dell'analisi degli annunci, garantendo protezione in tempo reale e una migliore integrazione.
- Espandi la tua portata nei mercati in forte crescita (Asia-Pacifico, America Latina, Medio Oriente) offrendo soluzioni convenienti e scalabili, pensate su misura per le PMI e gli inserzionisti emergenti.
- Investire in analisi avanzate, apprendimento automatico/intelligenza artificiale e funzionalità di big data per rilevare frodi sofisticate (bot, click farm, frodi di installazione, frodi cross-device) e adattarsi alle minacce in continua evoluzione.
- Offri soluzioni in bundle che combinano rilevamento delle frodi, analisi delle prestazioni degli annunci e ottimizzazione delle campagne per offrire il massimo valore agli inserzionisti, migliorando il ROI e riducendo al contempo i rischi.
Mercato, notizie e sviluppi recenti degli strumenti di rilevamento delle frodi pubblicitarie
- Il rapido passaggio alla pubblicità mobile e il crescente utilizzo di acquisti pubblicitari programmatici hanno accentuato la domanda di strumenti di rilevamento delle frodi, poiché i dispositivi mobili rappresentano una parte sostanziale della spesa pubblicitaria digitale e le frodi pubblicitarie basate sui dispositivi mobili sono tra le più complesse.
- Le PMI e le start-up stanno adottando sempre più strumenti di rilevamento delle frodi pubblicitarie, poiché sempre più piccole e medie imprese spostano i propri sforzi di marketing online, creando una base di clienti più ampia e in crescita che va oltre le grandi aziende.
- Con il continuo aumento dei budget pubblicitari a livello globale (in settori quali e-commerce, gaming, finanza e altro), l'esigenza di trasparenza, integrità delle campagne e protezione del ROI spinge all'adozione di servizi di rilevamento avanzati. Questa tendenza si è accelerata da quando la pandemia di COVID-19 ha innescato un'impennata nella pubblicità digitale e nelle attività online.
Copertura e risultati del rapporto di mercato sugli strumenti di rilevamento delle frodi pubblicitarie
Il rapporto "Previsioni di mercato degli strumenti di rilevamento delle frodi pubblicitarie (2021-2034) – Impatto del COVID-19 e analisi globale" di The Insight Partners fornisce:
- Dimensioni e previsioni del mercato (globale, per regione) per il periodo 2021-2034
- Tendenze del mercato, fattori trainanti, vincoli e opportunità di crescita chiave
- Segmentazione dettagliata per tipo (sito web, dispositivi mobili), utente finale (e-commerce, viaggi, finanza, giochi, altri) e area geografica
- Approfondimenti regionali su Nord America, Europa, Asia-Pacifico, Sud e Centro America e Medio Oriente e Africa, compresi i principali paesi
- Panorama competitivo che comprende i principali attori e i loro profili, strategie e posizionamento sul mercato

Ankita è una dinamica professionista della ricerca di mercato e della consulenza con oltre 8 anni di esperienza nei settori della tecnologia, dei media, dell'ICT, dell'elettronica e dei semiconduttori. Ha guidato e portato a termine con successo oltre 100 incarichi di consulenza e ricerca per clienti globali come Microsoft, Oracle, NEC Corporation, SAP, KPMG ed Expeditors International. Le sue competenze principali includono la valutazione del mercato, l'analisi dei dati, le previsioni, la formulazione di strategie, l'intelligence competitiva e la redazione di report.
Ankita è esperta nella gestione di cicli di progetto completi, dalla progettazione di proposte pre-vendita e discussioni con i clienti fino alla fornitura di insight fruibili post-vendita. È esperta nella gestione di team interfunzionali, nella strutturazione di moduli di ricerca complessi e nell'allineamento delle soluzioni agli obiettivi aziendali specifici del cliente. Le sue eccellenti capacità di comunicazione, leadership e presentazione le hanno permesso di fornire costantemente risultati orientati al valore in contesti di mercato in rapida evoluzione.
- Analisi completa delle dimensioni e delle previsioni di mercato
- Analisi dettagliata della segmentazione
- Valutazione approfondita delle dinamiche di mercato
- Approfondimenti a livello regionale e nazionale
- Analisi del panorama competitivo e benchmarking aziendale
- Business intelligence strategica
Testimonianze
Il report di mercato sui sistemi SCADA di Insight Partners è completo, con preziosi spunti sulle tendenze attuali e sulle previsioni future. Il team si è dimostrato altamente professionale, reattivo e disponibile in ogni fase del progetto. Siamo molto soddisfatti e consigliamo vivamente i loro servizi.
RAN KEDEM Partner, Reali Technologies LTDsHo richiesto un report su un mercato software molto specifico e il team lo ha prodotto in pochi giorni. Le informazioni erano molto pertinenti e ben presentate. Ho quindi richiesto alcune modifiche e aggiunte al report. Il team è stato ancora una volta molto reattivo e ho ricevuto il report finale in meno di una settimana.
JEAN-HERVE JENN Presidente, Future AnalyticaAbbiamo collaborato con The Insight Partners per un importante studio di mercato e una previsione. Ci hanno fornito informazioni chiare su opportunità e rischi, che ci hanno aiutato a definire i nostri piani. La loro ricerca è stata facile da usare e basata su dati solidi. Ci ha aiutato a prendere decisioni intelligenti e consapevoli. Li consigliamo vivamente.
PIYUSH NAGPAL Vicepresidente senior, Abbaglianti globaliInsight Partners ha fornito ricerche di mercato approfondite e ben strutturate, con una solida competenza nel settore. Il loro team si è dimostrato professionale e reattivo in ogni fase. Il sito web intuitivo ha reso l'accesso ai report di settore semplice e immediato. Li consigliamo vivamente per servizi di ricerca affidabili e di alta qualità.
YUKIHIKO ADACHI Amministratore delegato, Deep Blue, LLC.Questa è la prima volta che acquisto un report di mercato da The Insight Partners. Sebbene inizialmente fossi indeciso, ho visitato il loro sito web e mi sono sentito più a mio agio nell'acquistare un report di mercato. Sono completamente soddisfatto della qualità del report e del servizio clienti. Avevo diverse domande e commenti sul report iniziale, ma dopo un paio di conversazioni via email con il loro analista credo di avere un report che posso utilizzare come input per il nostro processo di pianificazione strategica. Grazie mille per aver dedicato del tempo extra e aver reso questa esperienza positiva. Consiglierò sicuramente il vostro servizio ad altri e sarete la mia prima persona a cui rivolgermi quando avremo bisogno di ulteriori dati di mercato.
GIOVANNI SUZUKI Presidente e Amministratore Delegato, Consigliere di Amministrazione, Tecnologie BKDesidero esprimere la mia gratitudine per il supporto e la professionalità dimostrati nel rispondere alla mia richiesta di informazioni sul mercato dei dispositivi medici in vitro per malattie infettive in Nigeria. Apprezzo la vostra pazienza, la vostra guida e la vostra disponibilità a offrirmi uno sconto, che alla fine ci ha permesso di concludere l'affare. Non vedo l'ora di collaborare con The Insight Partners in futuro, grazie anche all'impressione che mi avete lasciato dopo questo primo incontro.
Dott. Chijioke AMMINISTRATORE DELEGATO DI ONYIA, PineCrest Healthcare Ltd.Motivo dell'acquisto
- Processo decisionale informato
- Comprensione delle dinamiche di mercato
- Analisi competitiva
- Analisi dei clienti
- Previsioni di mercato
- Mitigazione del rischio
- Pianificazione strategica
- Giustificazione degli investimenti
- Identificazione dei mercati emergenti
- Miglioramento delle strategie di marketing
- Aumento dell'efficienza operativa
- Allineamento alle tendenze normative


