Strategie di mercato delle carte carburante per aviazione, principali attori, opportunità di crescita, analisi e previsioni entro il 2030
Dati storici : 2020-2021 | Anno base : | Periodo di previsione :Dimensioni e previsioni del mercato delle carte carburante per l'aviazione (2020-2030), quota globale e regionale, trend e opportunità di crescita. Copertura del rapporto di analisi: per tipo (commerciante, di marca); applicazione (commerciale, privata); e geografia
- Stato : Edito
- Codice del report : TIPRE00031432
- Categoria : Servizi bancari, finanziari e assicurativi
- Numero di pagine : 142
- Formati di report disponibili :


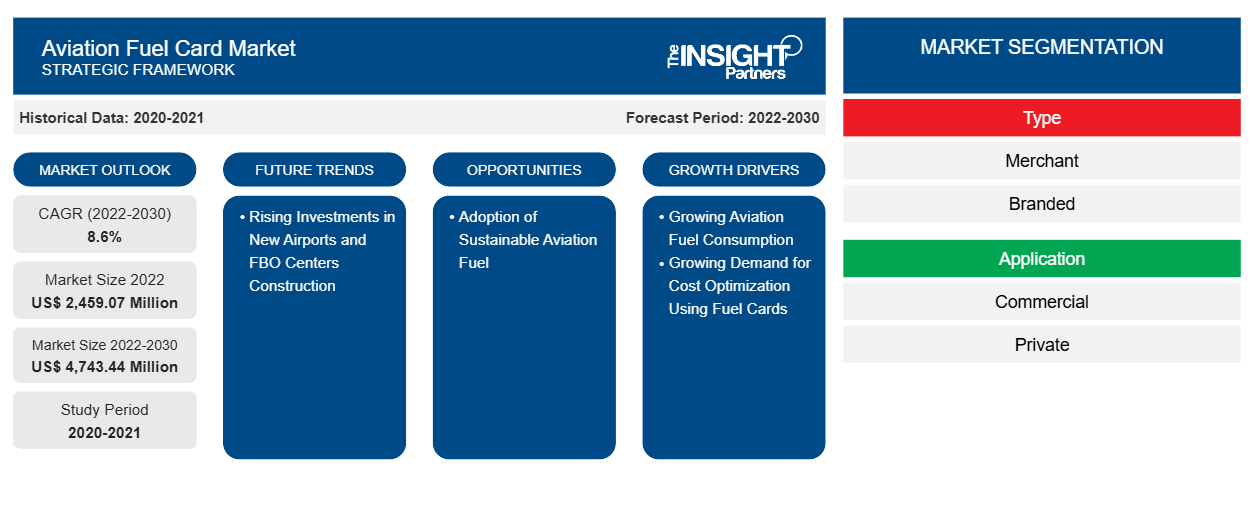
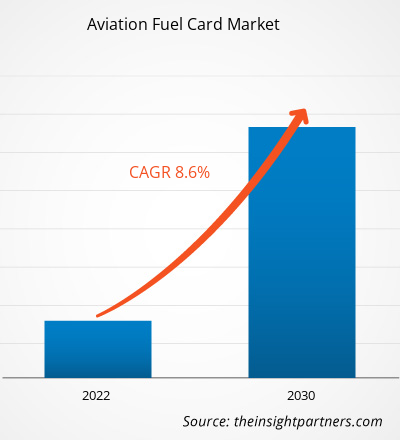
Si prevede che la dimensione del mercato delle carte carburante per l'aviazione raggiungerà i 4.743,44 milioni di dollari entro il 2030, rispetto ai 2.459,07 milioni di dollari del 2022. Si prevede che il mercato registrerà un CAGR dell'8,6% nel 2022-2030.
Tradizionalmente, il settore dell'aviazione ha effettuato i pagamenti per il carburante in vari modi, a seconda delle condizioni economiche e degli accordi in essere del settore del carburante e della compagnia aerea. Le compagnie aeree e altri settori dell'aviazione acquistano spesso carburante sul mercato spot, direttamente dalle compagnie petrolifere o tramite broker di carburante. In tali situazioni, la società di aviazione pagherà molto probabilmente il carburante con un mix di contanti e carta di credito. . In generale, il metodo di pagamento utilizzato dal settore dell'aviazione per acquistare carburante sarà determinato da una serie di criteri, come le dimensioni dell'azienda, la posizione, la strategia di acquisto, le condizioni di mercato e le possibilità disponibili. Le carte aziendali ad alto limite con software di gestione dei costi integrato possono semplificare notevolmente il monitoraggio dei pagamenti del carburante. Le carte ad alto limite consentono alle aziende molta più flessibilità di pagamento, il che significa che possono continuare a operare senza dover affrontare ritardi bancari e commissioni per i prestiti. Inoltre, a differenza delle carte benzina, che sono raramente collegate al software di gestione dei costi , le carte di credito aziendali ad alto limite delle società di gestione delle spese offrono un'esperienza completamente integrata. Le carte di credito aziendali hanno semplificato la centralizzazione delle fatture del carburante e semplificato il processo di gestione delle spese complessivo. Invece di affidarsi a diversi metodi di pagamento o rimborsi, è possibile utilizzare un'unica carta di credito per tutti gli acquisti correlati al carburante, semplificando il monitoraggio e la gestione delle spese. Consolidare le spese di carburante con una carta di credito aziendale può aiutare a sviluppare connessioni più solide con i fornitori di carburante. Le compagnie aeree che utilizzano frequentemente un'unica carta per le transazioni di carburante possono avere un maggiore potere negoziale con i fornitori di carburante in termini di sconti sul volume o condizioni favorevoli. Pertanto, i vantaggi offerti da altri metodi alternativi ostacolano la crescita del mercato delle carte carburante per l'aviazione .
Analisi del mercato delle carte carburante per l'aviazione
Molti produttori di carburante e operatori di compagnie aeree stanno prendendo iniziative per sviluppare e adottare carburante sostenibile per l'aviazione. Nel 2023, al Dubai Airshow, i funzionari di Boeing e Zero Petroleum hanno firmato un accordo per accelerare lo sviluppo di carburante sintetico sostenibile per l'aviazione (SAF). Nel 2023, Neste ha aiutato l'aeroporto di Trollhättan-Vänersborg e la compagnia aerea Västflyg a diventare la prima compagnia aerea al mondo a utilizzare carburante sostenibile per l'aviazione su tutti i voli. Nel 2023, Emirates ha accettato di fornire circa 300.000 galloni di carburante sostenibile per l'aviazione (SAF) miscelato all'hub internazionale della compagnia aerea a Dubai (DXB) attraverso una partnership con Shell Aviation. Si prevede che tali iniziative aumenteranno l'adozione di carburante sostenibile per l'aviazione. I fornitori di carte carburante per l'aviazione possono espandere la propria attività offrendo offerte e sconti interessanti sull'acquisto di carburante sostenibile per l'aviazione. Ciò porterà in ultima analisi a una maggiore adozione e utilizzo di carte carburante per l'aviazione. Inoltre, tramite partnership con operatori fissi, i fornitori di servizi di carte carburante possono espandere la rete per fornire carburante sostenibile per l'aviazione. Pertanto, si prevede che l'aumento delle transazioni di carburante sostenibile per l'aviazione offrirà ampie opportunità di crescita per il mercato delle carte carburante per l'aviazione durante il periodo di previsione.
Panoramica del mercato delle carte carburante per l'aviazione
Il ruolo dei fornitori di carte carburante nell'ecosistema del mercato delle carte carburante per l'aviazione è fondamentale per garantire il funzionamento e l'affidabilità senza interruzioni delle carte carburante. I fornitori di carte carburante per l'aviazione svolgono un ruolo significativo nella fornitura di servizi di carte carburante agli utenti finali, come compagnie aeree commerciali e private. I fornitori di carte carburante assicurano un ruolo sicuro ed efficiente nei processi di pagamento per il carburante per l'aviazione. I principali fornitori di carburante che forniscono servizi di carte carburante sono definiti fornitori di carburante di marca, che includono BP plc, Shell Global, ExxonMobil, Titan Aviation Fuels, Jio-BP, AEGFUELS e TotalEnergies Aviation. Queste entità sono responsabili della fornitura di carburante per l'aviazione e di carte carburante per l'aviazione da sole e quindi garantiscono una catena di fornitura affidabile per le carte carburante per l'aviazione. Terze parti e aziende private che forniscono servizi di carte carburante sono definite fornitori di carburante commerciali, che includono World Fuel Services, CSI global-fleet, Aviation Pros e Avfuel Corporation. I fornitori di carte carburante commerciali sono entità che sono impegnate in partnership o collaborazione con i principali fornitori di carburante per l'aviazione e garantiscono un processo di pagamento senza interruzioni e sicuro. Questa partnership o collaborazione comporta l'integrazione di sistemi per facilitare transazioni efficienti e mantenere una fornitura di carburante affidabile.
Personalizza questo report in base alle tue esigenze
Riceverai la personalizzazione gratuita di qualsiasi report, comprese parti di questo report, o analisi a livello nazionale, pacchetto dati Excel, oltre a usufruire di grandi offerte e sconti per start-up e università
Mercato delle carte carburante per l'aviazione: approfondimenti strategici
-
Scopri le principali tendenze di mercato in questo rapporto.Questo campione GRATUITO includerà analisi di dati che spaziano dalle tendenze di mercato alle stime e alle previsioni.
Driver e opportunità del mercato delle carte carburante per l'aviazione
Aumento del consumo di carburante per l'aviazione
A causa dell'elevata domanda di viaggi aerei, il consumo complessivo di carburante è aumentato. Nel 2022, le compagnie aeree statunitensi hanno trasportato 194 milioni di passeggeri in più rispetto al 2021, con un aumento del 30% su base annua. Da gennaio a dicembre 2022, le compagnie aeree statunitensi hanno gestito 853 milioni di passeggeri, rispetto ai 658 milioni del 2021 e ai 388 milioni del 2020. Nel 2021, l'Unione Europea (UE) ha registrato una significativa ripresa dei viaggi aerei poiché il numero totale di passeggeri ha raggiunto i 373 milioni. Questa cifra riflette un notevole aumento del 34,9% rispetto all'anno precedente, il 2020. L'impennata del numero di passeggeri aerei è stata osservata in Croazia, che ha registrato un notevole aumento dell'84% rispetto al 2021. Inoltre, Cipro e Grecia hanno registrato tassi di crescita sostanziali rispettivamente del 104,8% e dell'85,9%. Questo aumento del numero di passeggeri, in particolare in paesi come Croazia, Cipro e Grecia, evidenzia la crescente domanda di viaggi aerei e la conseguente necessità di carburante.
Crescenti investimenti nella costruzione di nuovi aeroporti e centri operativi fissi
Vari paesi sviluppati e in via di sviluppo in tutto il mondo si stanno concentrando sull'aumento del numero totale di aeroporti. Nel 2023, il governo del Vietnam intende costruire più di 30 aeroporti entro il 2030 per migliorare il turismo e il commercio. Il paese ha istituito 22 aeroporti; tuttavia, il governo si sta concentrando sulla costruzione di nuovi aeroporti per ospitare il crescente numero di aeromobili. Il governo vietnamita ha approvato la costruzione dell'aeroporto internazionale di Long Thanh nel 2021, con completamento previsto per il 2025. L'aeroporto internazionale di Long Thanh sarà l'aeroporto più grande del Vietnam, con una capacità fino a 100 milioni di persone all'anno. Il governo mira ad espandersi a più di 30 aeroporti entro il 2030, il che dimostra l'impegno del paese nello sviluppo del suo settore dell'aviazione. Nel 2023, l'Arabia Saudita ha annunciato l'espansione del suo settore dell'aviazione nazionale, che richiederà un investimento di 100 miliardi di dollari. Nel 2023, l'India ha annunciato investimenti per 12 miliardi di dollari negli aeroporti nei prossimi due anni, compresi ordini per centinaia di nuovi aerei per soddisfare la crescente domanda di viaggi, che sta gravando sulle infrastrutture attuali.
Analisi della segmentazione del rapporto di mercato delle carte carburante per l'aviazione
I segmenti chiave che hanno contribuito alla derivazione dell'analisi di mercato delle carte carburante per l'aviazione sono tipologia, applicazione e geografia.
- In base al tipo, il mercato delle carte carburante per l'aviazione è stato segmentato in merchant e branded. Il segmento merchant ha detenuto una quota di mercato maggiore nel 2022.
- Per applicazione, il mercato delle carte carburante per l'aviazione è stato segmentato in commerciale e privato. Il segmento commerciale ha detenuto la quota maggiore del mercato nel 2022.
Analisi della quota di mercato delle carte carburante per l'aviazione per area geografica
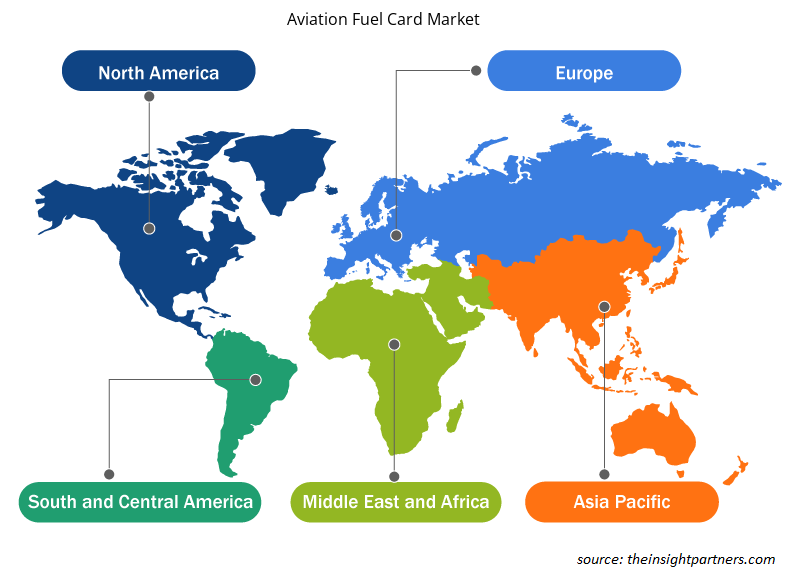
L'ambito geografico del rapporto sul mercato delle carte carburante per l'aviazione è suddiviso principalmente in cinque regioni: Nord America, Europa, Asia Pacifico, Medio Oriente e Africa e Sud America.
Il Nord America ha dominato il mercato delle carte carburante per l'aviazione nel 2022 e si prevede che manterrà il suo predominio anche durante il periodo di previsione. Il settore delle carte carburante per l'aviazione del Nord America è guidato principalmente dalla crescente consapevolezza del concetto di carta carburante. Inoltre, la crescente industria aeronautica in paesi come gli Stati Uniti e il Canada sta ulteriormente guidando il mercato delle carte carburante per l'aviazione. Il settore dell'aviazione è uno dei settori più importanti negli Stati Uniti. Secondo i dati pubblicati da Airlines for America nel 2023, l'aviazione commerciale ha rappresentato il 5% del PIL degli Stati Uniti e 1,25 trilioni di dollari nel 2022. Inoltre, un'ampia rete di aeroporti e operatori di base fissi negli Stati Uniti ha supportato il crescente utilizzo delle carte carburante per l'aviazione. Nel 2022, gli Stati Uniti gestivano oltre 5.100 aeroporti pubblici e 14.850 aeroporti privati. Il settore del trasporto aereo contribuisce in modo significativo all'economia canadese. Secondo l'International Air Transport Association (IATA), il settore ha contribuito con 37 miliardi di dollari al PIL canadese nel 2018. L'aumento del consumo di carburante per l'aviazione e l'aumento dei prezzi dell'aviazione stanno guidando il mercato delle carte carburante per l'aviazione in Messico. A giugno 2022, i prezzi all'ingrosso del carburante per aerei della Pemex di proprietà statale sono aumentati drasticamente. Gli Stati Uniti hanno detenuto la quota maggiore nel mercato delle carte carburante per l'aviazione del Nord America nel 2022.
Approfondimenti regionali sul mercato delle carte carburante per l'aviazione
Le tendenze regionali e i fattori che influenzano il mercato delle carte carburante per l'aviazione durante il periodo di previsione sono stati ampiamente spiegati dagli analisti di Insight Partners. Questa sezione discute anche i segmenti e la geografia del mercato delle carte carburante per l'aviazione in Nord America, Europa, Asia Pacifico, Medio Oriente e Africa e Sud e Centro America.
- Ottieni i dati specifici regionali per il mercato delle carte carburante per l'aviazione
Ambito del rapporto sul mercato delle carte carburante per l'aviazione
| Attributo del report | Dettagli |
|---|---|
| Dimensioni del mercato nel 2022 | 2.459,07 milioni di dollari USA |
| Dimensioni del mercato entro il 2030 | 4.743,44 milioni di dollari USA |
| CAGR globale (2022-2030) | 8,6% |
| Dati storici | 2020-2021 |
| Periodo di previsione | 2022-2030 |
| Segmenti coperti |
Per tipo
|
| Regioni e Paesi coperti |
America del Nord
|
| Leader di mercato e profili aziendali chiave |
|
Densità dei player del mercato delle carte carburante per l'aviazione: comprendere il suo impatto sulle dinamiche aziendali
Il mercato delle carte carburante per l'aviazione sta crescendo rapidamente, spinto dalla crescente domanda degli utenti finali dovuta a fattori quali l'evoluzione delle preferenze dei consumatori, i progressi tecnologici e una maggiore consapevolezza dei vantaggi del prodotto. Con l'aumento della domanda, le aziende stanno ampliando le loro offerte, innovando per soddisfare le esigenze dei consumatori e capitalizzando sulle tendenze emergenti, il che alimenta ulteriormente la crescita del mercato.
La densità degli operatori di mercato si riferisce alla distribuzione di aziende o società che operano in un particolare mercato o settore. Indica quanti concorrenti (operatori di mercato) sono presenti in un dato spazio di mercato in relazione alle sue dimensioni o al valore di mercato totale.
Le principali aziende che operano nel mercato delle carte carburante per l'aviazione sono:
- Società per azioni Shell
- Società per azioni BP
- Gruppo energetico associato LLC
- Viva Energy Group Ltd
- Carburanti per l'aviazione TITAN Inc.
Disclaimer : le aziende elencate sopra non sono classificate secondo un ordine particolare.
- Ottieni una panoramica dei principali attori del mercato delle carte carburante per l'aviazione
Notizie e sviluppi recenti sul mercato delle carte carburante per l'aviazione
Il mercato delle carte carburante per l'aviazione viene valutato raccogliendo dati qualitativi e quantitativi dopo la ricerca primaria e secondaria, che include importanti pubblicazioni aziendali, dati associativi e database. Di seguito è riportato un elenco degli sviluppi nel mercato delle carte carburante per l'aviazione e delle strategie:
- Nel settembre 2023, Air bp, fornitore internazionale di prodotti e servizi per carburanti per l'aviazione, ha lanciato l'offerta di carburante Jet-A1 presso il terminal per l'aviazione generale (GA) dell'aeroporto di Berlino-Brandeburgo (BER) nell'ambito di una nuova collaborazione con ExecuJet. (Fonte: Air BP, comunicato stampa/sito Web aziendale/newsletter)
- Nell'ottobre 2022, TreviPay, la rete globale di pagamenti e fatturazione B2B, ha lanciato TreviPay Aviation Network, con tecnologia KHI, per offrire una soluzione di carte a circuito chiuso e co-branded, su misura per le esigenze degli FBO (operatori a base fissa) e delle organizzazioni di servizi di supporto al volo che forniscono servizi ai settori dell'aviazione generale e della difesa, nonché ai loro clienti. (Fonte: TreviPay, comunicato stampa/sito Web aziendale/newsletter)
Copertura e risultati del rapporto sul mercato delle carte carburante per l'aviazione
Il rapporto "Dimensioni e previsioni del mercato delle carte carburante per l'aviazione (2020-2030)" fornisce un'analisi dettagliata del mercato che copre le seguenti aree:
- Dimensioni e previsioni del mercato a livello globale, regionale e nazionale per tutti i segmenti di mercato chiave coperti dall'ambito
- Dinamiche di mercato come fattori trainanti, vincoli e opportunità chiave
- Principali tendenze future
- Analisi dettagliata delle cinque forze di Porter
- Analisi di mercato globale e regionale che copre le principali tendenze di mercato, i principali attori, le normative e gli sviluppi recenti del mercato
- Analisi del panorama industriale e della concorrenza che copre la concentrazione del mercato, l'analisi della mappa di calore, i principali attori e gli sviluppi recenti
- Profili aziendali dettagliati con analisi SWOT

Ankita è una dinamica professionista della ricerca di mercato e della consulenza con oltre 8 anni di esperienza nei settori della tecnologia, dei media, dell'ICT, dell'elettronica e dei semiconduttori. Ha guidato e portato a termine con successo oltre 100 incarichi di consulenza e ricerca per clienti globali come Microsoft, Oracle, NEC Corporation, SAP, KPMG ed Expeditors International. Le sue competenze principali includono la valutazione del mercato, l'analisi dei dati, le previsioni, la formulazione di strategie, l'intelligence competitiva e la redazione di report.
Ankita è esperta nella gestione di cicli di progetto completi, dalla progettazione di proposte pre-vendita e discussioni con i clienti fino alla fornitura di insight fruibili post-vendita. È esperta nella gestione di team interfunzionali, nella strutturazione di moduli di ricerca complessi e nell'allineamento delle soluzioni agli obiettivi aziendali specifici del cliente. Le sue eccellenti capacità di comunicazione, leadership e presentazione le hanno permesso di fornire costantemente risultati orientati al valore in contesti di mercato in rapida evoluzione.
- Analisi storica (2 anni), anno base, previsione (7 anni) con CAGR
- Analisi PEST e SWOT
- Valore/volume delle dimensioni del mercato - Globale, Regionale, Nazionale
- Industria e panorama competitivo
- Set di dati Excel
Testimonianze
Il report di mercato sui sistemi SCADA di Insight Partners è completo, con preziosi spunti sulle tendenze attuali e sulle previsioni future. Il team si è dimostrato altamente professionale, reattivo e disponibile in ogni fase del progetto. Siamo molto soddisfatti e consigliamo vivamente i loro servizi.
RAN KEDEM Partner, Reali Technologies LTDsHo richiesto un report su un mercato software molto specifico e il team lo ha prodotto in pochi giorni. Le informazioni erano molto pertinenti e ben presentate. Ho quindi richiesto alcune modifiche e aggiunte al report. Il team è stato ancora una volta molto reattivo e ho ricevuto il report finale in meno di una settimana.
JEAN-HERVE JENN Presidente, Future AnalyticaAbbiamo collaborato con The Insight Partners per un importante studio di mercato e una previsione. Ci hanno fornito informazioni chiare su opportunità e rischi, che ci hanno aiutato a definire i nostri piani. La loro ricerca è stata facile da usare e basata su dati solidi. Ci ha aiutato a prendere decisioni intelligenti e consapevoli. Li consigliamo vivamente.
PIYUSH NAGPAL Vicepresidente senior, Abbaglianti globaliInsight Partners ha fornito ricerche di mercato approfondite e ben strutturate, con una solida competenza nel settore. Il loro team si è dimostrato professionale e reattivo in ogni fase. Il sito web intuitivo ha reso l'accesso ai report di settore semplice e immediato. Li consigliamo vivamente per servizi di ricerca affidabili e di alta qualità.
YUKIHIKO ADACHI Amministratore delegato, Deep Blue, LLC.Questa è la prima volta che acquisto un report di mercato da The Insight Partners. Sebbene inizialmente fossi indeciso, ho visitato il loro sito web e mi sono sentito più a mio agio nell'acquistare un report di mercato. Sono completamente soddisfatto della qualità del report e del servizio clienti. Avevo diverse domande e commenti sul report iniziale, ma dopo un paio di conversazioni via email con il loro analista credo di avere un report che posso utilizzare come input per il nostro processo di pianificazione strategica. Grazie mille per aver dedicato del tempo extra e aver reso questa esperienza positiva. Consiglierò sicuramente il vostro servizio ad altri e sarete la mia prima persona a cui rivolgermi quando avremo bisogno di ulteriori dati di mercato.
GIOVANNI SUZUKI Presidente e Amministratore Delegato, Consigliere di Amministrazione, Tecnologie BKDesidero esprimere la mia gratitudine per il supporto e la professionalità dimostrati nel rispondere alla mia richiesta di informazioni sul mercato dei dispositivi medici in vitro per malattie infettive in Nigeria. Apprezzo la vostra pazienza, la vostra guida e la vostra disponibilità a offrirmi uno sconto, che alla fine ci ha permesso di concludere l'affare. Non vedo l'ora di collaborare con The Insight Partners in futuro, grazie anche all'impressione che mi avete lasciato dopo questo primo incontro.
Dott. Chijioke AMMINISTRATORE DELEGATO DI ONYIA, PineCrest Healthcare Ltd.Motivo dell'acquisto
- Processo decisionale informato
- Comprensione delle dinamiche di mercato
- Analisi competitiva
- Analisi dei clienti
- Previsioni di mercato
- Mitigazione del rischio
- Pianificazione strategica
- Giustificazione degli investimenti
- Identificazione dei mercati emergenti
- Miglioramento delle strategie di marketing
- Aumento dell'efficienza operativa
- Allineamento alle tendenze normative


Sblocca sconti esclusivi sui report
Richiedi ora


 Ottieni un campione gratuito per - Mercato delle carte carburante per l'aviazione