
Rapporto sull’analisi delle dimensioni del mercato e delle quote del software di progettazione di coperte | Previsioni 2031
Dimensioni e previsioni del mercato del software per la progettazione di ponti (2021-2031), quota globale e regionale, trend e opportunità di crescita. Copertura del rapporto di analisi: per distribuzione (cloud e on-premise), utente finale (singolo e progettista) e applicazione (residenziale e commerciale) e geografia.
- Stato : Dati rilasciati
- Codice del report : TIPRE00016147
- Categoria : Tecnologia, media e telecomunicazioni
- Numero di pagine : 150
- Formati di report disponibili :


- Data dell'ultimo aggiornamento : May 20, 2024

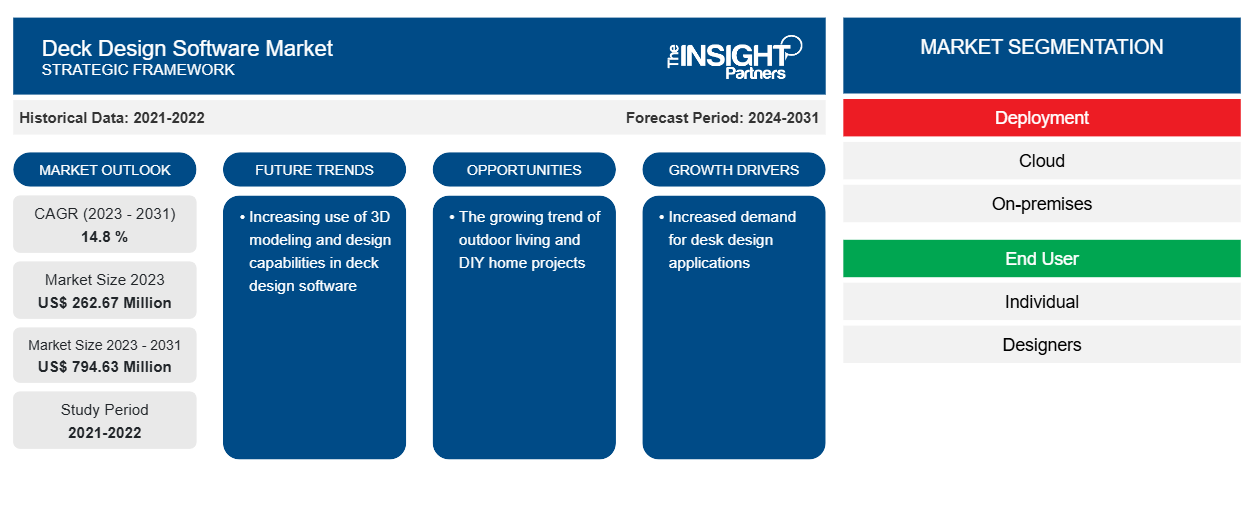
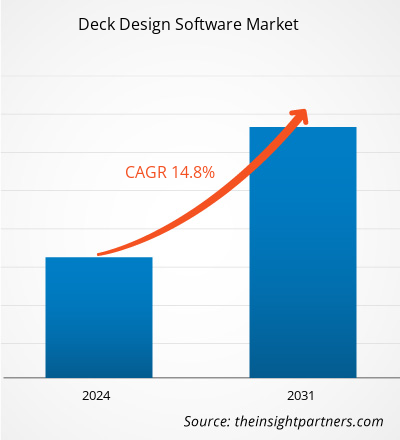
Si prevede che la dimensione del mercato del software di progettazione di ponti raggiungerà i 794,63 milioni di dollari entro il 2031, rispetto ai 262,67 milioni di dollari del 2023. Si prevede che il mercato registrerà un CAGR del 14,8% nel 2023-2031. È probabile che l'uso crescente di capacità di progettazione e modellazione 3D nel software di progettazione di ponti rimanga una tendenza chiave del mercato del software di progettazione di ponti.
Analisi di mercato del software di progettazione di ponti
Si prevede che l'uso crescente di questi strumenti nei settori dell'edilizia e della ristrutturazione di case determinerà una crescita significativa nel mercato globale dei software di progettazione di ponti. Sempre più persone stanno tentando di rinnovare le proprie aree abitative all'aperto. Si prevede che il mercato crescerà a seguito della crescente popolarità dei ponti esterni e dell'accessibilità di strumenti per ponti ad alta tecnologia. Inoltre, si prevede che le crescenti preoccupazioni sulla sicurezza a seguito di calamità naturali possano aumentare la domanda di software di progettazione di ponti. Il software di progettazione di ponti sta crescendo in popolarità mentre il settore si dirige verso un futuro più meccanizzato e digitalizzato. I professionisti lo utilizzano frequentemente per le sue numerose funzionalità, che includono visualizzazione 3D , stesura automatica e gestione efficace dei progetti.
Panoramica del mercato del software di progettazione di ponti
Uno strumento elettronico per la pianificazione, la progettazione e la visualizzazione di ponti esterni è il software di progettazione ponti. Con l'aiuto di questo tipo di software, puoi realizzare, modificare e progettare ponti in una varietà di dimensioni e forme. Puoi anche scattare foto del progetto 3D e inviarle a clienti o colleghi. Per garantire che le strutture dei ponti soddisfino gli standard del settore e le normative di sicurezza, il software di progettazione ponti è stato utilizzato anche nel processo di ingegneria.
Personalizza questo report in base alle tue esigenze
Riceverai la personalizzazione gratuita di qualsiasi report, comprese parti di questo report, o analisi a livello nazionale, pacchetto dati Excel, oltre a usufruire di grandi offerte e sconti per start-up e università
Mercato del software di progettazione di ponti: approfondimenti strategici
-
Scopri le principali tendenze di mercato in questo rapporto.Questo campione GRATUITO includerà analisi di dati che spaziano dalle tendenze di mercato alle stime e alle previsioni.
Driver e opportunità del mercato del software di progettazione di ponti
Aumento della domanda di applicazioni di progettazione di scrivanie
La necessità di applicazioni di progettazione di ponti sta crescendo poiché sempre più proprietari di case e appaltatori vogliono essere in grado di pianificare e immaginare i loro ponti prima di iniziare a costruirli. Con il software di progettazione di ponti, gli utenti possono modificare rapidamente e facilmente le dimensioni o la forma del ponte, sperimentare numerose possibilità di progettazione e vedere il prodotto finito in tre dimensioni. Ciò facilita il processo di pianificazione e costruzione di ponti e riduce la necessità di costose discussioni di persona con gli appaltatori.
La tendenza crescente della vita all'aria aperta e dei progetti fai da te per la casa
Il software di progettazione di ponti sta diventando sempre più popolare a seguito delle tendenze in espansione della vita all'aria aperta e dei miglioramenti fai-da-te per la casa. Un numero crescente di proprietari di case sta realizzando progetti fai-da-te, come la costruzione di ponti e cucine all'aperto , per migliorare le proprie aree abitative all'aperto. Con l'uso del software di progettazione di ponti, i proprietari di case possono pianificare e visualizzare più facilmente e precisamente il proprio ponte prima di iniziare la costruzione, risparmiando potenzialmente denaro e tempo sul progetto. Pertanto, si prevede che la crescente adozione dell'IoT presenterà nuove opportunità per gli operatori del mercato del software di progettazione di ponti durante il periodo di previsione.IoT is anticipated to present new opportunities for the deck design software market players during the forecast period.
Analisi della segmentazione del rapporto di mercato del software di progettazione del ponte
I segmenti chiave che hanno contribuito alla derivazione dell'analisi di mercato del software di progettazione di ponti sono l'implementazione, l'utente finale e l'applicazione.
- In base all'implementazione, il mercato del software di progettazione di deck è segmentato in cloud e on-premise. Il segmento cloud ha detenuto una quota di mercato maggiore nel 2023.
In base all'utente finale, il mercato è segmentato in privati e designer.
- In base all'applicazione, il mercato è segmentato in residenziale e commerciale.
Analisi della quota di mercato del software di progettazione di ponti per area geografica
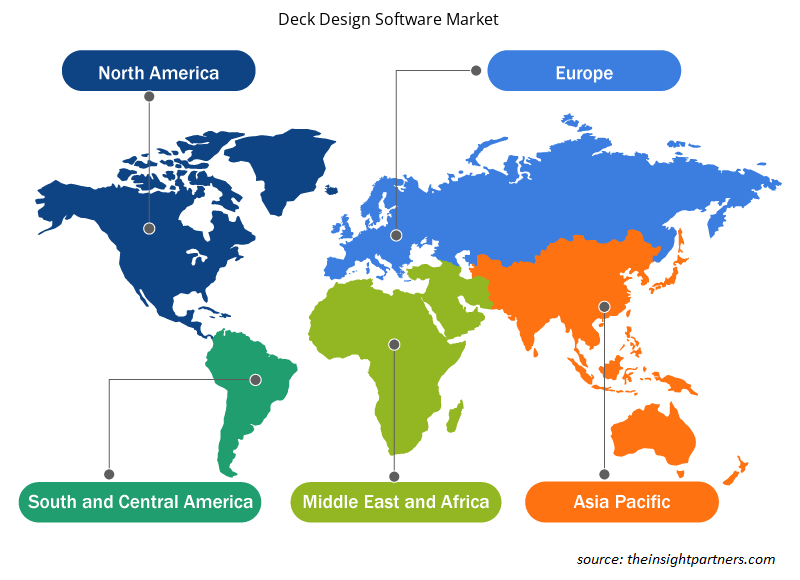
L'ambito geografico del rapporto di mercato sul software di progettazione di ponti è principalmente suddiviso in cinque regioni: Nord America, Asia Pacifico, Europa, Medio Oriente e Africa e Sud America/Sud e Centro America. In termini di fatturato, il Nord America ha rappresentato la quota di mercato più grande del software di progettazione di ponti. Oggigiorno, molte aziende forniscono software specificamente progettati per il mercato nordamericano, il che semplifica per i clienti la ricerca dell'articolo ideale per le loro esigenze. Inoltre, la crescente accessibilità delle risorse online sta spingendo il mercato. Per aiutarli a ottenere il massimo dal loro investimento, i consumatori possono ora accedere a una varietà di video, consigli e suggerimenti sull'utilizzo del software di progettazione di ponti.
Approfondimenti regionali sul mercato del software di progettazione di ponti
Le tendenze regionali e i fattori che influenzano il mercato del software di progettazione di ponti durante il periodo di previsione sono stati ampiamente spiegati dagli analisti di Insight Partners. Questa sezione discute anche i segmenti e la geografia del mercato del software di progettazione di ponti in Nord America, Europa, Asia Pacifico, Medio Oriente e Africa e America meridionale e centrale.
- Ottieni i dati specifici regionali per il mercato del software di progettazione del ponte
Ambito del rapporto di mercato sul software di progettazione del ponte
| Attributo del report | Dettagli |
|---|---|
| Dimensioni del mercato nel 2023 | 262,67 milioni di dollari USA |
| Dimensioni del mercato entro il 2031 | 794,63 milioni di dollari USA |
| CAGR globale (2023-2031) | 14,8% |
| Dati storici | 2021-2022 |
| Periodo di previsione | 2024-2031 |
| Segmenti coperti |
Per distribuzione
|
| Regioni e Paesi coperti |
America del Nord
|
| Leader di mercato e profili aziendali chiave |
|
Densità dei player del mercato del software di progettazione di ponti: comprendere il suo impatto sulle dinamiche aziendali
Il mercato del software di progettazione di ponti sta crescendo rapidamente, spinto dalla crescente domanda degli utenti finali dovuta a fattori quali l'evoluzione delle preferenze dei consumatori, i progressi tecnologici e una maggiore consapevolezza dei vantaggi del prodotto. Con l'aumento della domanda, le aziende stanno ampliando le loro offerte, innovando per soddisfare le esigenze dei consumatori e capitalizzando sulle tendenze emergenti, il che alimenta ulteriormente la crescita del mercato.
La densità degli operatori di mercato si riferisce alla distribuzione di aziende o società che operano in un particolare mercato o settore. Indica quanti concorrenti (operatori di mercato) sono presenti in un dato spazio di mercato in relazione alle sue dimensioni o al valore di mercato totale.
Le principali aziende che operano nel mercato del software per la progettazione di ponti sono:
- Prodotti edili AZEK (Tecnologia del legno)
- Architetto capo Inc.
- Delta Software International LLC (Professionista CAD)
- Fibra
- Spettro delle idee, Inc.
- Strumenti software Luxwood
Disclaimer : le aziende elencate sopra non sono classificate secondo un ordine particolare.
- Ottieni la panoramica dei principali attori del mercato dei software di progettazione di ponti
Notizie di mercato e sviluppi recenti del software di progettazione di ponti
Il mercato del software di progettazione di deck viene valutato raccogliendo dati qualitativi e quantitativi dopo la ricerca primaria e secondaria, che include importanti pubblicazioni aziendali, dati di associazioni e database. Di seguito è riportato un elenco degli sviluppi nel mercato dei disturbi e delle strategie del linguaggio e della parola:
- Nel 2021, la TimberTech Pro Reserve Collection è una nuova gamma di materiali compositi per decking introdotta dall'azienda. La serie ha una migliore resistenza all'umidità e alle macchie, una garanzia di 30 anni e un aspetto e una sensazione realistici del legno. Grazie alla varietà di colori e motivi della collezione, i consumatori possono sviluppare layout di deck personalizzati e distintivi. (Fonte: TimberTech, comunicato stampa)
- Nell'ottobre 2021, Fiberon ha annunciato il lancio di Deck Designer, la più recente aggiunta alla suite Discovery Deck Design Tools di risorse digitali interattive per proprietari di case e professionisti del settore. Deck Designer è uno strumento di progettazione 3D che facilita la progettazione di uno spazio abitativo all'aperto utilizzando l'intera offerta di prodotti per ringhiere, decking Fiberon e rivestimenti. (Fonte: Fiberon, comunicato stampa)
Copertura e risultati del rapporto di mercato sul software di progettazione di ponti
Il rapporto "Dimensioni e previsioni del mercato del software di progettazione del ponte (2021-2031)" fornisce un'analisi dettagliata del mercato che copre le seguenti aree:
- Dimensioni e previsioni del mercato a livello globale, regionale e nazionale per tutti i segmenti di mercato chiave coperti dall'ambito
- Dinamiche di mercato come fattori trainanti, vincoli e opportunità chiave
- Principali tendenze future
- Analisi dettagliata delle cinque forze PEST/Porter e SWOT
- Analisi di mercato globale e regionale che copre le principali tendenze di mercato, i principali attori, le normative e gli sviluppi recenti del mercato
- Analisi del panorama industriale e della concorrenza che copre la concentrazione del mercato, l'analisi della mappa di calore, i principali attori e gli sviluppi recenti
- Profili aziendali dettagliati

Ankita è una dinamica professionista della ricerca di mercato e della consulenza con oltre 8 anni di esperienza nei settori della tecnologia, dei media, dell'ICT, dell'elettronica e dei semiconduttori. Ha guidato e portato a termine con successo oltre 100 incarichi di consulenza e ricerca per clienti globali come Microsoft, Oracle, NEC Corporation, SAP, KPMG ed Expeditors International. Le sue competenze principali includono la valutazione del mercato, l'analisi dei dati, le previsioni, la formulazione di strategie, l'intelligence competitiva e la redazione di report.
Ankita è esperta nella gestione di cicli di progetto completi, dalla progettazione di proposte pre-vendita e discussioni con i clienti fino alla fornitura di insight fruibili post-vendita. È esperta nella gestione di team interfunzionali, nella strutturazione di moduli di ricerca complessi e nell'allineamento delle soluzioni agli obiettivi aziendali specifici del cliente. Le sue eccellenti capacità di comunicazione, leadership e presentazione le hanno permesso di fornire costantemente risultati orientati al valore in contesti di mercato in rapida evoluzione.
- Analisi completa delle dimensioni e delle previsioni di mercato
- Analisi dettagliata della segmentazione
- Valutazione approfondita delle dinamiche di mercato
- Approfondimenti a livello regionale e nazionale
- Analisi del panorama competitivo e benchmarking aziendale
- Business intelligence strategica
Testimonianze
Il report di mercato sui sistemi SCADA di Insight Partners è completo, con preziosi spunti sulle tendenze attuali e sulle previsioni future. Il team si è dimostrato altamente professionale, reattivo e disponibile in ogni fase del progetto. Siamo molto soddisfatti e consigliamo vivamente i loro servizi.
RAN KEDEM Partner, Reali Technologies LTDsHo richiesto un report su un mercato software molto specifico e il team lo ha prodotto in pochi giorni. Le informazioni erano molto pertinenti e ben presentate. Ho quindi richiesto alcune modifiche e aggiunte al report. Il team è stato ancora una volta molto reattivo e ho ricevuto il report finale in meno di una settimana.
JEAN-HERVE JENN Presidente, Future AnalyticaAbbiamo collaborato con The Insight Partners per un importante studio di mercato e una previsione. Ci hanno fornito informazioni chiare su opportunità e rischi, che ci hanno aiutato a definire i nostri piani. La loro ricerca è stata facile da usare e basata su dati solidi. Ci ha aiutato a prendere decisioni intelligenti e consapevoli. Li consigliamo vivamente.
PIYUSH NAGPAL Vicepresidente senior, Abbaglianti globaliInsight Partners ha fornito ricerche di mercato approfondite e ben strutturate, con una solida competenza nel settore. Il loro team si è dimostrato professionale e reattivo in ogni fase. Il sito web intuitivo ha reso l'accesso ai report di settore semplice e immediato. Li consigliamo vivamente per servizi di ricerca affidabili e di alta qualità.
YUKIHIKO ADACHI Amministratore delegato, Deep Blue, LLC.Questa è la prima volta che acquisto un report di mercato da The Insight Partners. Sebbene inizialmente fossi indeciso, ho visitato il loro sito web e mi sono sentito più a mio agio nell'acquistare un report di mercato. Sono completamente soddisfatto della qualità del report e del servizio clienti. Avevo diverse domande e commenti sul report iniziale, ma dopo un paio di conversazioni via email con il loro analista credo di avere un report che posso utilizzare come input per il nostro processo di pianificazione strategica. Grazie mille per aver dedicato del tempo extra e aver reso questa esperienza positiva. Consiglierò sicuramente il vostro servizio ad altri e sarete la mia prima persona a cui rivolgermi quando avremo bisogno di ulteriori dati di mercato.
GIOVANNI SUZUKI Presidente e Amministratore Delegato, Consigliere di Amministrazione, Tecnologie BKDesidero esprimere la mia gratitudine per il supporto e la professionalità dimostrati nel rispondere alla mia richiesta di informazioni sul mercato dei dispositivi medici in vitro per malattie infettive in Nigeria. Apprezzo la vostra pazienza, la vostra guida e la vostra disponibilità a offrirmi uno sconto, che alla fine ci ha permesso di concludere l'affare. Non vedo l'ora di collaborare con The Insight Partners in futuro, grazie anche all'impressione che mi avete lasciato dopo questo primo incontro.
Dott. Chijioke AMMINISTRATORE DELEGATO DI ONYIA, PineCrest Healthcare Ltd.Motivo dell'acquisto
- Processo decisionale informato
- Comprensione delle dinamiche di mercato
- Analisi competitiva
- Analisi dei clienti
- Previsioni di mercato
- Mitigazione del rischio
- Pianificazione strategica
- Giustificazione degli investimenti
- Identificazione dei mercati emergenti
- Miglioramento delle strategie di marketing
- Aumento dell'efficienza operativa
- Allineamento alle tendenze normative


