Tendenze del mercato e opportunità chiave del software di etichettatura aziendale 2031
Dati storici : 2021-2023 | Anno base : 2024 | Periodo di previsione : 2025-2031Dimensioni e previsioni del mercato del software di etichettatura aziendale (2021-2031), quota globale e regionale, trend e opportunità di crescita. Copertura del rapporto di analisi: per offerta (software e servizi), distribuzione (cloud e on-premise), utente finale (FMCG, vendita al dettaglio, sanità, magazzinaggio e logistica, automotive, produzione e altri), dimensioni aziendali (piccole e medie imprese (PMI) e grandi imprese) e geografia.
- Stato : Edito
- Codice del report : TIPRE00007375
- Categoria : Tecnologia, media e telecomunicazioni
- Numero di pagine : 285
- Formati di report disponibili :


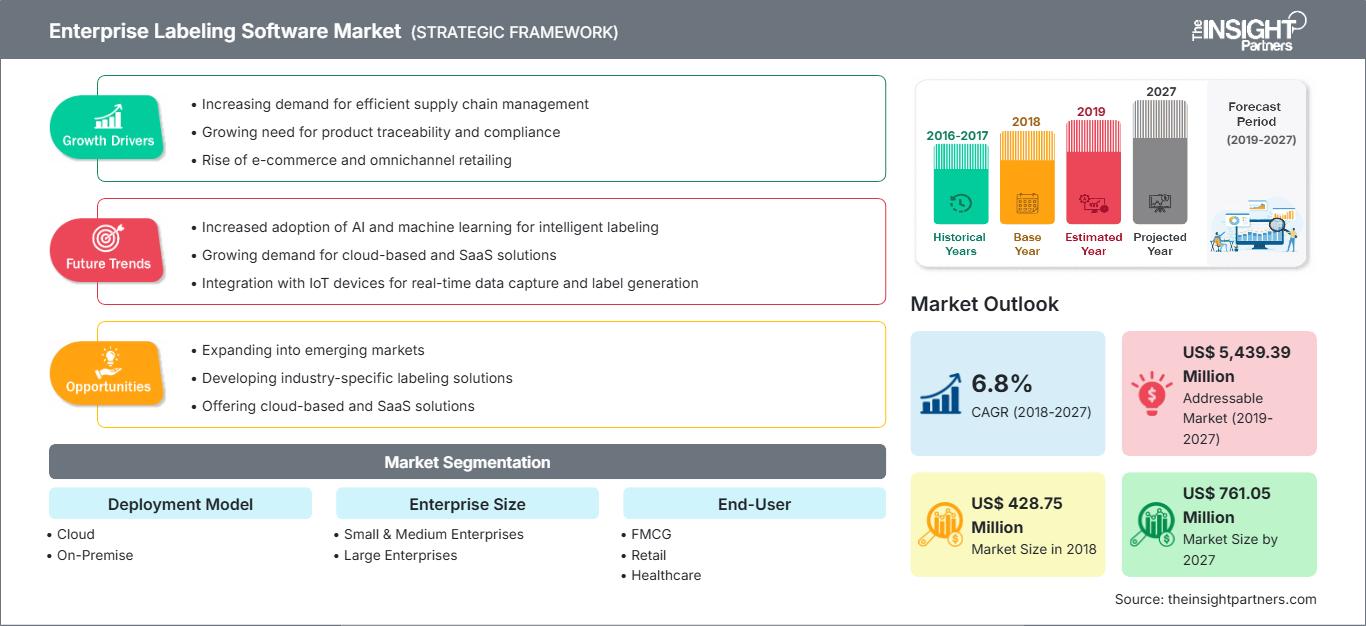
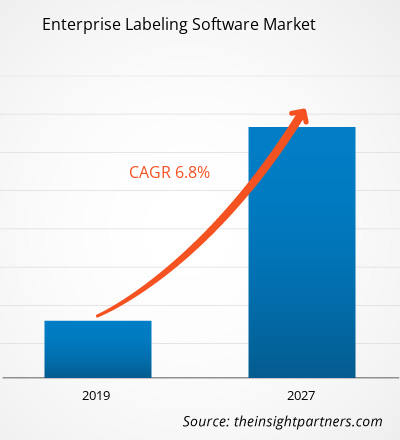
Il mercato è stato valutato a 482,31 milioni di dollari nel 2024 e si prevede che raggiungerà i 799,95 milioni di dollari entro il 2031; si stima che registrerà un CAGR del 7,8% nel periodo 2025-2031.
Analisi di mercato del software di etichettatura aziendale
Diversi fattori influenzano in modo dinamico il mercato dei software per l'etichettatura aziendale. La crescente complessità delle supply chain, unita ai rigorosi requisiti normativi, spinge le aziende ad adottare soluzioni di etichettatura automatizzate. Personalizzazione, funzionalità di integrazione e interfacce intuitive sono i principali fattori di differenziazione per i fornitori in un mercato competitivo. Le principali sfide da affrontare sono come soddisfare i diversi requisiti specifici del settore e gestire la compatibilità dei sistemi legacy. Inoltre, l'adozione del cloud ha un impatto sul mercato in quanto consente l'accesso remoto e implementazioni scalabili; tuttavia, le decisioni relative agli acquisti sono fortemente influenzate dalle preoccupazioni relative alla sicurezza dei dati. Le partnership tra fornitori di software per l'etichettatura e produttori di hardware generano offerte in bundle che aumentano l'attrattiva delle proposte di valore. L'innovazione continua è guidata dalle esigenze dei clienti in termini di analisi dei dati in tempo reale e tracciabilità delle etichette.
Panoramica del mercato del software di etichettatura aziendale
Il mercato dei software di etichettatura aziendale offre soluzioni altamente scalabili e automatizzate che semplificano i processi in diversi settori, tra cui logistica, sanità, commercio al dettaglio e produzione. Questi tipi di software sono il pilastro dell'impresa moderna, consentendo all'azienda di mantenere precisione, conformità e produttività attraverso la creazione, la stampa e la gestione digitale delle etichette. Il mercato dei software di etichettatura aziendale offre soluzioni scalabili e automatizzate per allineare i processi in diversi settori, tra cui produzione, logistica, commercio al dettaglio e sanità. Queste soluzioni software contribuiscono a mantenere accuratezza, conformità ed efficienza consentendo alle aziende di creare, stampare e gestire le etichette in modo digitale. Le aziende utilizzano sempre più software di etichettatura per ridurre gli errori umani e migliorare i flussi di lavoro operativi, spinte dalla crescente domanda di tracciabilità, conformità normativa ed efficace gestione delle informazioni sui prodotti. L'integrazione con i sistemi ERP e di gestione della supply chain ne sta favorendo l'adozione.
Riceverai la personalizzazione gratuita di qualsiasi report, incluse parti di questo report, analisi a livello nazionale, pacchetto dati Excel e potrai usufruire di fantastiche offerte e sconti per start-up e università.
Mercato del software di etichettatura aziendale: approfondimenti strategici
-
Scopri le principali tendenze di mercato di questo rapporto.Questo campione GRATUITO includerà analisi dei dati, che spaziano dalle tendenze di mercato alle stime e alle previsioni.
Driver e opportunità del mercato del software di etichettatura aziendale
Fattori trainanti del mercato:
- Conformità normativa: le normative rigorose richiedono un'etichettatura accurata e standardizzata per garantire la sicurezza e la tracciabilità del prodotto.
- Complessità della catena di fornitura: le catene di fornitura globali in crescita richiedono una gestione efficiente delle etichette per mantenere la visibilità e ridurre gli errori.
- Trasformazione digitale: le aziende stanno adottando soluzioni automatizzate per sostituire l'etichettatura manuale e migliorare l'efficienza operativa.
Opportunità di mercato:
- Integrazione di intelligenza artificiale e apprendimento automatico: l'integrazione dell'intelligenza artificiale può migliorare la precisione delle etichette e automatizzare il rilevamento degli errori nei processi di etichettatura.
- Espansione nei mercati emergenti: la crescente industrializzazione nelle economie emergenti offre nuove basi di clienti per le soluzioni di etichettatura.
- Connettività IoT: la connessione del software di etichettatura con i dispositivi IoT consente il monitoraggio in tempo reale e una gestione più intelligente della supply chain.
Analisi della segmentazione del rapporto di mercato del software di etichettatura aziendale
Il mercato dei software per l'etichettatura aziendale è segmentato come segue:
Offrendo:
- Software: la crescente necessità di precisione e automazione delle procedure di etichettatura determina la richiesta di soluzioni software più avanzate che facilitino la progettazione, la gestione e la stampa delle etichette.
- Servizi: quando vogliono distribuire e integrare il software in modo complesso, le aziende si rivolgono ora a fornitori di servizi professionali in grado di personalizzarli, implementarli e supportarli per ottenere il massimo valore dal software.
Per distribuzione:
- Cloud: uno dei motivi principali della crescita del software di etichettatura basato su cloud è che offre alle aziende l'opportunità di utilizzare una soluzione scalabile, accessibile da remoto e con costi iniziali inferiori.
- On-premise: le aziende con rigorose esigenze di sicurezza e conformità dei dati tendono ancora a preferire l'approccio on-premise. Ciò consente loro di mantenere il controllo assoluto sui propri sistemi di etichettatura e su altre informazioni riservate.
Da parte dell'utente finale:
- Beni di largo consumo
- Vedere al dettaglio
- Assistenza sanitaria
- Magazzinaggio e logistica
- Automobilistico
- Produzione
- Altri
Per dimensione aziendale:
- Piccole e medie imprese (PMI)
- Grande impresa
Per geografia:
- America del Nord
- Europa
- Asia Pacifico
- America Latina
- Medio Oriente e Africa
L'area Asia-Pacifico è la principale area azionaria del mercato globale dei software per l'etichettatura aziendale, grazie alla drastica trasformazione digitale e all'evoluzione della catena di fornitura.
Approfondimenti regionali sul mercato del software di etichettatura aziendale
Le tendenze e i fattori regionali che hanno influenzato il mercato del software per l'etichettatura aziendale durante il periodo di previsione sono stati ampiamente spiegati dagli analisti di The Insight Partners. Questa sezione illustra anche i segmenti e la distribuzione geografica del mercato del software per l'etichettatura aziendale in Nord America, Europa, Asia-Pacifico, Medio Oriente e Africa, America Meridionale e Centrale.
Ambito del rapporto di mercato del software di etichettatura aziendale
| Attributo del report | Dettagli |
|---|---|
| Dimensioni del mercato nel 2024 | 482,41 milioni di dollari USA |
| Dimensioni del mercato entro il 2031 | 799,95 milioni di dollari USA |
| CAGR globale (2025 - 2031) | 7,8% |
| Dati storici | 2021-2023 |
| Periodo di previsione | 2025-2031 |
| Segmenti coperti |
Offrendo
|
| Regioni e paesi coperti |
America del Nord
|
| Leader di mercato e profili aziendali chiave |
|
Densità degli operatori del mercato del software di etichettatura aziendale: comprendere il suo impatto sulle dinamiche aziendali
Il mercato dei software per l'etichettatura aziendale è in rapida crescita, trainato dalla crescente domanda degli utenti finali, dovuta a fattori quali l'evoluzione delle preferenze dei consumatori, i progressi tecnologici e una maggiore consapevolezza dei vantaggi del prodotto. Con l'aumento della domanda, le aziende stanno ampliando la propria offerta, innovando per soddisfare le esigenze dei consumatori e sfruttando le tendenze emergenti, alimentando ulteriormente la crescita del mercato.
- Ottieni una panoramica dei principali attori del mercato dei software di etichettatura aziendale
Analisi della quota di mercato del software di etichettatura aziendale per area geografica
Si prevede che la crescita più rapida nei prossimi anni interesserà la regione Asia-Pacifico. Anche i mercati emergenti di America Latina, Medio Oriente e Africa offrono numerose opportunità di espansione inesplorate per i fornitori di software per l'etichettatura aziendale.
Il mercato dei software per l'etichettatura aziendale cresce a ritmi diversi in ogni regione. Di seguito è riportato un riepilogo delle quote di mercato e delle tendenze per regione:
1. Nord America
- Quota di mercato: leader grazie all'adozione precoce della tecnologia e alla presenza di grandi aziende
-
Fattori chiave:
- Elevata richiesta di conformità normativa e tracciabilità
- Iniziative avanzate di trasformazione digitale
- Forte adozione di soluzioni basate sul cloud
- Tendenze: crescente integrazione con IoT e intelligenza artificiale per sistemi di etichettatura più intelligenti
2. Europa
- Quota di mercato: significativa, guidata da rigidi contesti normativi e dalla diversità industriale
-
Fattori chiave:
- Conformità alle severe normative in materia di etichettatura (ad esempio, REACH, GDPR)
- Crescente attenzione alla sostenibilità e all'etichettatura ecologica
- Elevata richiesta di etichette multilingue e personalizzate
- Tendenze: passaggio a soluzioni on-premise per una maggiore sicurezza dei dati e conformità locale
3. Asia Pacifico
- Quota di mercato: in rapida crescita con l'espansione dei settori manifatturiero e della vendita al dettaglio
-
Fattori chiave:
- L’industrializzazione e l’urbanizzazione stanno accelerando la domanda
- Crescente adozione di soluzioni di etichettatura cloud e mobile
- Crescente necessità di visibilità della catena di fornitura nelle esportazioni globali
- Tendenze: Espansione del software di etichettatura nei mercati emergenti e nelle PMI
4. America meridionale e centrale
- Quota di mercato: mercato in via di sviluppo con crescente interesse da parte dei settori della vendita al dettaglio e della logistica
-
Fattori chiave:
- Necessità di migliorare la tracciabilità e la conformità della catena di fornitura
- Adozione di soluzioni cloud scalabili per supportare le aziende in espansione
- Concentrarsi su soluzioni di etichettatura convenienti nei mercati sensibili ai prezzi
- Tendenze: Crescenti partnership tra fornitori locali e fornitori di software globali
5. Medio Oriente e Africa
- Quota di mercato: mercato emergente con potenziale di crescita grazie allo sviluppo delle infrastrutture
-
Fattori chiave:
- Settori della logistica e della produzione in crescita
- Richiesta di soluzioni automatizzate per ridurre le inefficienze operative
- Aumentare le iniziative governative per la trasformazione digitale
- Tendenze: adozione graduale di implementazioni basate su cloud per l'efficienza dei costi
Densità degli operatori del mercato del software di etichettatura aziendale: comprendere il suo impatto sulle dinamiche aziendali
Elevata densità di mercato e concorrenza
La concorrenza nel mercato dei software per l'etichettatura aziendale è intensa, con affermati player globali come Loftware Inc; Seagull Software, LLC. e Zebra Technologies Corp. leader del settore. Anche diversi produttori regionali e di nicchia stanno espandendo la loro presenza, intensificando la concorrenza in diverse aree geografiche.
Questo elevato livello di concorrenza spinge le aziende a distinguersi offrendo:
- Soluzioni di etichettatura altamente personalizzabili e specifiche per il settore
- Capacità di integrazione senza soluzione di continuità
- Solida offerta di supporto e servizi
Opportunità e mosse strategiche
- Il crescente utilizzo del cloud computing e delle attività di trasformazione digitale in vari settori ha il potenziale per incrementare il mercato dei software di etichettatura aziendale.
- La combinazione di soluzioni di etichettatura con IoT, intelligenza artificiale e analisi avanzata consente una gestione più intelligente della supply chain e il monitoraggio della conformità in modo predittivo.
- La crescita in nuove aree, in particolare nell'area Asia-Pacifico e in Medio Oriente, sta determinando la necessità di soluzioni di etichettatura adattabili e facilmente scalabili.
- Lo sviluppo di software su misura per le esigenze specifiche di settori quali quello farmaceutico, alimentare e delle bevande e della logistica soddisfa requisiti in continua evoluzione e sblocca segmenti di mercato su misura.
Le principali aziende che operano nel mercato del software per l'etichettatura aziendale sono:
- TEKLYNX CORPORATION SAS
- Eurosoft Plus
- Innovatum. Inc.
- Loftware Inc.
- Zebra Technologies Corp
- Esko-Graphics BV
- Kallik Ltd.
- Seagull Software, LLC.
- AstroNova Inc.
- Cartago Software GmbH
Nota: le aziende elencate sopra non sono classificate in un ordine particolare.
Altre aziende analizzate nel corso della ricerca:
- Aulux Corp. Ltd.
- Cristallight Software
- CYBRA Corp.
- Sistemi di dati internazionali (DSI)
- DDi
- Esko Graphics BV
- Servizi software Freyr
- Linn Systems Ltd.
- OPAL Associates Holding AG
- PSI Systems Inc
- RF INTELLIGENTE
- TEC IT Datenverarbeitung
- Tharo Systems Inc.
- Wasp Barcode Technologies
- Software Amtech
Notizie di mercato e sviluppi recenti del software di etichettatura aziendale
- BarTender e Mojix annunciano una partnership strategica per rivoluzionare la tracciabilità. A settembre 2024, BarTender e Mojix hanno annunciato una partnership strategica volta a rivoluzionare la tracciabilità. Le aziende si concentreranno su soluzioni end-to-end per la supply chain che forniranno una trasparenza senza pari per processi decisionali più intelligenti e miglioramenti nell'efficienza operativa.
- CYBRA, leader nelle soluzioni di codici a barre e tracciamento RFID, ha annunciato una partnership strategica con Acumatica. A gennaio 2025, CYBRA, leader nelle soluzioni di codici a barre e tracciamento RFID, ha annunciato una partnership strategica con Acumatica, un fornitore leader di software ERP basato su cloud progettato per semplificare le operazioni aziendali delle piccole e medie imprese. Questa collaborazione offrirà agli utenti di Acumatica una nuova e potente opzione per la stampa precisa delle etichette e il tracciamento RFID in tempo reale, aiutando le aziende a ottimizzare le operazioni ed eliminare le inefficienze.
Copertura e risultati del rapporto sul mercato del software di etichettatura aziendale
Il rapporto "Enterprise Labelling Software Market Size and Forecast (2021–2031)" fornisce un'analisi dettagliata del mercato che copre le seguenti aree:
- Dimensioni e previsioni del mercato del software di etichettatura aziendale a livello globale, regionale e nazionale per tutti i segmenti di mercato chiave coperti dall'ambito
- Tendenze del mercato del software di etichettatura aziendale, nonché dinamiche di mercato quali fattori trainanti, vincoli e opportunità chiave
- Analisi PEST e SWOT dettagliate
- Analisi di mercato del software di etichettatura aziendale che copre le principali tendenze del mercato, il quadro globale e regionale, i principali attori, le normative e i recenti sviluppi del mercato
- Analisi del panorama industriale e della concorrenza che copre la concentrazione del mercato, l'analisi della mappa termica, i principali attori e gli sviluppi recenti per il mercato del software di etichettatura aziendale
- Profili aziendali dettagliati

Ankita è una dinamica professionista della ricerca di mercato e della consulenza con oltre 8 anni di esperienza nei settori della tecnologia, dei media, dell'ICT, dell'elettronica e dei semiconduttori. Ha guidato e portato a termine con successo oltre 100 incarichi di consulenza e ricerca per clienti globali come Microsoft, Oracle, NEC Corporation, SAP, KPMG ed Expeditors International. Le sue competenze principali includono la valutazione del mercato, l'analisi dei dati, le previsioni, la formulazione di strategie, l'intelligence competitiva e la redazione di report.
Ankita è esperta nella gestione di cicli di progetto completi, dalla progettazione di proposte pre-vendita e discussioni con i clienti fino alla fornitura di insight fruibili post-vendita. È esperta nella gestione di team interfunzionali, nella strutturazione di moduli di ricerca complessi e nell'allineamento delle soluzioni agli obiettivi aziendali specifici del cliente. Le sue eccellenti capacità di comunicazione, leadership e presentazione le hanno permesso di fornire costantemente risultati orientati al valore in contesti di mercato in rapida evoluzione.
- Analisi storica (2 anni), anno base, previsione (7 anni) con CAGR
- Analisi PEST e SWOT
- Valore/volume delle dimensioni del mercato - Globale, Regionale, Nazionale
- Industria e panorama competitivo
- Set di dati Excel
Testimonianze
Il report di mercato sui sistemi SCADA di Insight Partners è completo, con preziosi spunti sulle tendenze attuali e sulle previsioni future. Il team si è dimostrato altamente professionale, reattivo e disponibile in ogni fase del progetto. Siamo molto soddisfatti e consigliamo vivamente i loro servizi.
RAN KEDEM Partner, Reali Technologies LTDsHo richiesto un report su un mercato software molto specifico e il team lo ha prodotto in pochi giorni. Le informazioni erano molto pertinenti e ben presentate. Ho quindi richiesto alcune modifiche e aggiunte al report. Il team è stato ancora una volta molto reattivo e ho ricevuto il report finale in meno di una settimana.
JEAN-HERVE JENN Presidente, Future AnalyticaAbbiamo collaborato con The Insight Partners per un importante studio di mercato e una previsione. Ci hanno fornito informazioni chiare su opportunità e rischi, che ci hanno aiutato a definire i nostri piani. La loro ricerca è stata facile da usare e basata su dati solidi. Ci ha aiutato a prendere decisioni intelligenti e consapevoli. Li consigliamo vivamente.
PIYUSH NAGPAL Vicepresidente senior, Abbaglianti globaliInsight Partners ha fornito ricerche di mercato approfondite e ben strutturate, con una solida competenza nel settore. Il loro team si è dimostrato professionale e reattivo in ogni fase. Il sito web intuitivo ha reso l'accesso ai report di settore semplice e immediato. Li consigliamo vivamente per servizi di ricerca affidabili e di alta qualità.
YUKIHIKO ADACHI Amministratore delegato, Deep Blue, LLC.Questa è la prima volta che acquisto un report di mercato da The Insight Partners. Sebbene inizialmente fossi indeciso, ho visitato il loro sito web e mi sono sentito più a mio agio nell'acquistare un report di mercato. Sono completamente soddisfatto della qualità del report e del servizio clienti. Avevo diverse domande e commenti sul report iniziale, ma dopo un paio di conversazioni via email con il loro analista credo di avere un report che posso utilizzare come input per il nostro processo di pianificazione strategica. Grazie mille per aver dedicato del tempo extra e aver reso questa esperienza positiva. Consiglierò sicuramente il vostro servizio ad altri e sarete la mia prima persona a cui rivolgermi quando avremo bisogno di ulteriori dati di mercato.
GIOVANNI SUZUKI Presidente e Amministratore Delegato, Consigliere di Amministrazione, Tecnologie BKDesidero esprimere la mia gratitudine per il supporto e la professionalità dimostrati nel rispondere alla mia richiesta di informazioni sul mercato dei dispositivi medici in vitro per malattie infettive in Nigeria. Apprezzo la vostra pazienza, la vostra guida e la vostra disponibilità a offrirmi uno sconto, che alla fine ci ha permesso di concludere l'affare. Non vedo l'ora di collaborare con The Insight Partners in futuro, grazie anche all'impressione che mi avete lasciato dopo questo primo incontro.
Dott. Chijioke AMMINISTRATORE DELEGATO DI ONYIA, PineCrest Healthcare Ltd.Motivo dell'acquisto
- Processo decisionale informato
- Comprensione delle dinamiche di mercato
- Analisi competitiva
- Analisi dei clienti
- Previsioni di mercato
- Mitigazione del rischio
- Pianificazione strategica
- Giustificazione degli investimenti
- Identificazione dei mercati emergenti
- Miglioramento delle strategie di marketing
- Aumento dell'efficienza operativa
- Allineamento alle tendenze normative


Sblocca sconti esclusivi sui report
Richiedi ora


 Ottieni un campione gratuito per - Mercato del software di etichettatura aziendale