Tendencias y oportunidades clave del mercado de software de etiquetado empresarial 2031
Datos históricos : 2021-2023 | Año base : 2024 | Período de pronóstico : 2025-2031Tamaño y pronóstico del mercado de software de etiquetado empresarial (2021-2031): análisis del informe sobre la cuota de mercado global y regional, las tendencias y las oportunidades de crecimiento. Cobertura del informe: por oferta (software y servicio), implementación (nube y local), usuario final (bienes de consumo, comercio minorista, sanidad, almacenamiento y logística, automoción, fabricación y otros), tamaño de la empresa (pequeñas y medianas empresas (pymes) y grandes empresas) y geografía.
- Estado : Publicada
- Código de informe : TIPRE00007375
- Categoría : Tecnología, medios y telecomunicaciones
- Número de páginas : 285
- Formatos de informe disponibles :


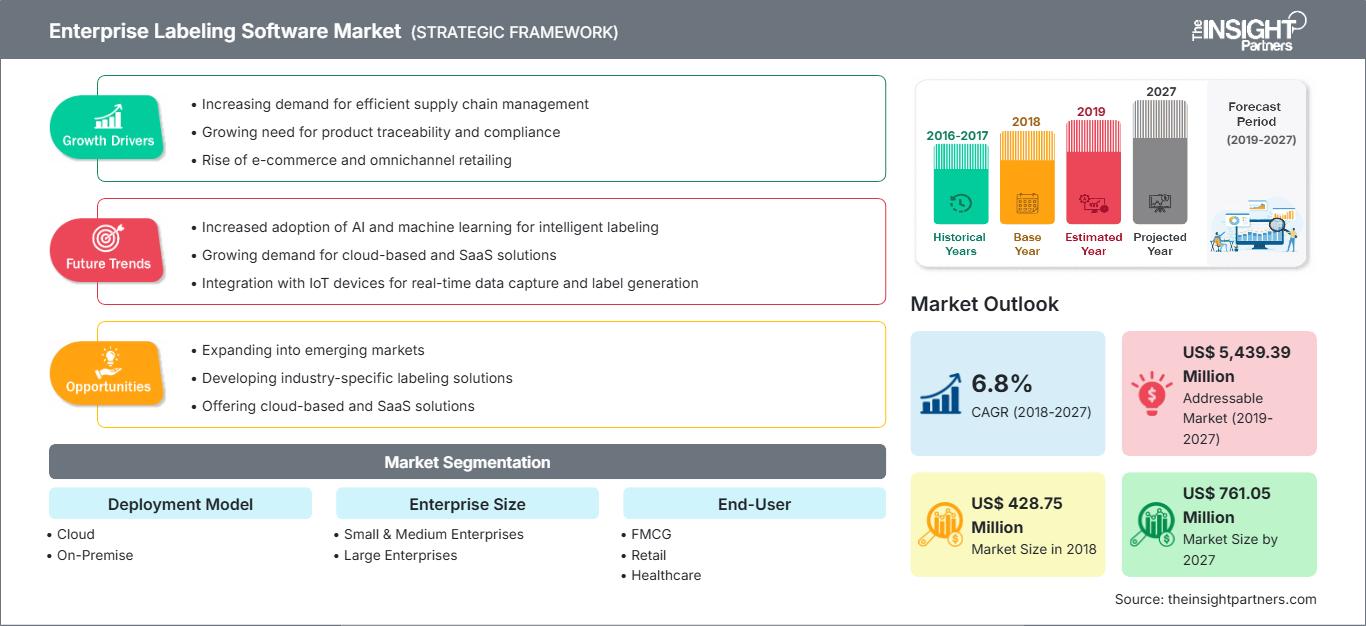
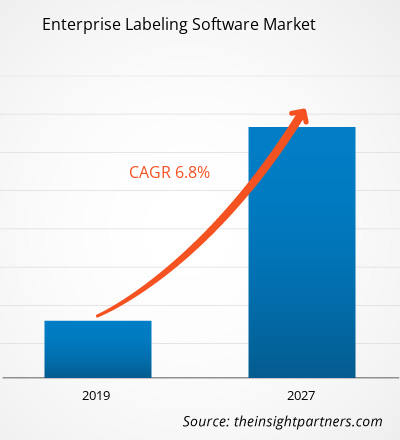
El mercado se valoró en 482,31 millones de dólares estadounidenses en 2024 y se prevé que alcance los 799,95 millones de dólares estadounidenses en 2031; se estima que registrará una tasa de crecimiento anual compuesto (TCAC) del 7,8 % durante el período 2025-2031.
Análisis del mercado de software de etiquetado empresarial
Diversos factores configuran dinámicamente el mercado del software de etiquetado empresarial. La creciente complejidad de las cadenas de suministro, junto con las estrictas exigencias regulatorias, impulsa a las empresas a adoptar soluciones de etiquetado automatizadas. La personalización, las funciones de integración y las interfaces intuitivas son los principales diferenciadores para los proveedores en un mercado competitivo. Los retos principales a abordar son cómo satisfacer los diversos requisitos específicos de cada sector y gestionar la compatibilidad con los sistemas heredados. Además, la adopción de la nube tiene un impacto en el mercado, ya que permite el acceso remoto y las implementaciones escalables; sin embargo, las decisiones de compra están fuertemente influenciadas por las preocupaciones sobre la seguridad de los datos. Las alianzas entre proveedores de software de etiquetado y fabricantes de hardware generan ofertas combinadas que mejoran el atractivo de las propuestas de valor. La innovación continua está impulsada por las necesidades de los clientes de análisis de datos en tiempo real y trazabilidad de etiquetas.
Panorama del mercado de software de etiquetado empresarial
El mercado de software de etiquetado empresarial ofrece soluciones altamente escalables y automatizadas que optimizan los procesos en diversos sectores, como logística, salud, comercio minorista y manufactura. Este tipo de software es fundamental para la empresa moderna, ya que permite mantener la precisión, la conformidad y la productividad mediante la creación, impresión y gestión digital de etiquetas. El mercado de software de etiquetado empresarial ofrece soluciones escalables y automatizadas para alinear los procesos en diversos sectores, como manufactura, logística, comercio minorista y salud. Estas soluciones de software ayudan a mantener la precisión, el cumplimiento normativo y la eficiencia al permitir a las empresas crear, imprimir y gestionar etiquetas digitalmente. Las empresas utilizan cada vez más software de etiquetado para reducir los errores humanos y mejorar los flujos de trabajo operativos, impulsadas por la creciente demanda de trazabilidad, cumplimiento normativo y una gestión eficaz de la información de los productos. La integración con los sistemas ERP y de gestión de la cadena de suministro está impulsando su adopción.
Obtendrá personalización gratuita de cualquier informe, incluyendo partes de este informe, análisis a nivel de país y paquetes de datos de Excel. Además, podrá aprovechar excelentes ofertas y descuentos para empresas emergentes y universidades.
Mercado de software de etiquetado empresarial: Perspectivas estratégicas
-
Obtenga las principales tendencias clave del mercado que se describen en este informe.Esta muestra GRATUITA incluirá análisis de datos, que abarcarán desde tendencias de mercado hasta estimaciones y pronósticos.
Enterprise Labelling Software Market Drivers and Opportunities
Market Drivers:
- Regulatory Compliance: Strict regulations require accurate and standardized labeling to ensure product safety and traceability.
- Supply Chain Complexity: Growing global supply chains demand efficient label management to maintain visibility and reduce errors.
- Digital Transformation: Enterprises are adopting automated solutions to replace manual labeling and improve operational efficiency.
Market Opportunities:
- AI and Machine Learning Integration: Incorporating AI can enhance label accuracy and automate error detection in labeling processes.
- Expansion into Emerging Markets: Growing industrialization in emerging economies presents new customer bases for labeling solutions.
- IoT Connectivity: Connecting labeling software with IoT devices enables real-time monitoring and smarter supply chain management.
Enterprise Labelling Software Market Report Segmentation Analysis
The enterprise labelling software market is segmented into the following:
By Offering:
- Software: The growth of the need for precision and the automation of labeling procedures drives the demand for higher software solutions that easily use the design, management, and printing of labels.
- Services: To the extent of their wanting to deploy and integrate the software in a complex way, companies are now turning to professional service providers who can customize, implement and support them to get the maximum value of the software.
By Deployment:
- Cloud: One of the primary reasons for the growth of cloud-based labeling software is that it offers businesses the opportunity to use a solution that is scalable, remotely accessible, and has lower initial costs.
- On-Premise: Establishments with rigorous data security and compliance needs still tend to lean towards the on-premise approach. This allows them to retain absolute control over their labeling systems and over other confidential information.
By End User:
- FMCG
- Retail
- Healthcare
- Warehousing and Logistics
- Automotive
- Manufacturing
- Others
By Enterprise Size:
- Small and Medium Enterprises (SMEs)
- Large Enterprise
By Geography:
- North America
- Europe
- Asia Pacific
- Latin America
- Middle East & Africa
Asia Pacific is the major shareholding region of the global enterprise labelling software market, due to the drastic digital transformation and evolved supply chain.
Enterprise Labelling Software Market Regional Insights
The regional trends and factors influencing the Enterprise Labelling Software Market throughout the forecast period have been thoroughly explained by the analysts at The Insight Partners. This section also discusses Enterprise Labelling Software Market segments and geography across North America, Europe, Asia Pacific, Middle East and Africa, and South and Central America.
Enterprise Labelling Software Market Report Scope
| Report Attribute | Details |
|---|---|
| Market size in 2024 | US$ 482.41 Million |
| Market Size by 2031 | US$ 799.95 Million |
| Global CAGR (2025 - 2031) | 7.8% |
| Historical Data | 2021-2023 |
| Forecast period | 2025-2031 |
| Segments Covered |
By Offering
|
| Regions and Countries Covered |
North America
|
| Market leaders and key company profiles |
|
Enterprise Labelling Software Market Players Density: Understanding Its Impact on Business Dynamics
The Enterprise Labelling Software Market is growing rapidly, driven by increasing end-user demand due to factors such as evolving consumer preferences, technological advancements, and greater awareness of the product's benefits. As demand rises, businesses are expanding their offerings, innovating to meet consumer needs, and capitalizing on emerging trends, which further fuels market growth.
- Get the Enterprise Labelling Software Market top key players overview
Enterprise Labelling Software Market Share Analysis by Geography
Asia Pacific is expected to grow the fastest in the next few years. Emerging markets in Latin America, the Middle East, and Africa also present numerous untapped opportunities for enterprise labeling software providers to expand.
The enterprise labeling software market grows at varying rates in each region. Below is a summary of market share and trends by region:
1. North America
- Market Share: Leading due to early technology adoption and the presence of major enterprises
- Key Drivers:
- High demand for regulatory compliance and traceability
- Advanced digital transformation initiatives
- Strong adoption of cloud-based solutions
- Trends: Increasing integration with IoT and AI for smarter labeling systems
2. Europe
- Market Share: Significant, driven by strict regulatory environments and industrial diversity
- Key Drivers:
- Compliance with stringent labeling regulations (e.g., REACH, GDPR)
- Growing focus on sustainability and eco-friendly labelling
- High demand for multi-language and customized labelling
- Trends: Shift toward on-premise solutions for enhanced data security and local compliance
3. Asia Pacific
- Market Share: Rapidly growing with expanding manufacturing and retail sectors
- Key Drivers:
- Industrialization and urbanization are accelerating demand
- Increasing adoption of cloud and mobile labeling solutions
- Rising need for supply chain visibility in global exports
- Trends: Expansion of labeling software into emerging markets and SMEs
4. South and Central America
- Market Share: Developing market with increasing interest from retail and logistics industries
- Key Drivers:
- Need for improved supply chain traceability and compliance
- Adoption of scalable cloud solutions to support expanding businesses
- Focus on cost-effective labeling solutions in price-sensitive markets
- Trends: Growing partnerships between local vendors and global software providers
5. Middle East and Africa
- Market Share: Emerging market with growth potential due to infrastructure development
- Key Drivers:
- Growing logistics and manufacturing sectors
- Demand for automated solutions to reduce operational inefficiencies
- Increasing government initiatives for digital transformation
- Trends: Gradual adoption of cloud-based deployments for cost efficiency
Enterprise Labelling Software Market Players Density: Understanding Its Impact on Business Dynamics
High Market Density and Competition
Competition in the Enterprise Labelling Software market is intense, with established global players such as Loftware Inc; Seagull Software, LLC.; and Zebra Technologies Corp leading the space. Several regional and niche manufacturers are also expanding their presence, intensifying competition across various geographies.
This high level of competition urges companies to stand out by offering:
- Highly customizable and industry-specific labeling solutions
- Seamless integration capabilities
- Robust support and service offerings
Opportunities and Strategic Moves
- Growing use of cloud computing and digital transformation activities in various sectors has the potential to increase the enterprise labeling software market.
- The combination of labeling solutions with IoT, AI, and advanced analytics allows for more intelligent supply chain management as well as for the monitoring of compliance in a predictive manner.
- Growth in new areas, notably in the Asia Pacific and Middle East, is driving the need for labeling solutions that are adaptable and can be easily scaled.
- The development of software tailored to the specific needs of industries such as pharmaceuticals, food and beverage, and logistics meets changing requirements and unlocks tailored market segments.
Major companies operating in the Enterprise Labelling Software market are:
- TEKLYNX CORPORATION SAS
- Eurosoft Plus
- Innovatum. Inc.
- Loftware Inc.
- Zebra Technologies Corp
- Esko-Graphics BV
- Kallik Ltd.
- Seagull Software, LLC.
- AstroNova Inc.
- Cartago Software GmbH
Note: The companies listed above are not ranked in any particular order.
Other companies analyzed during the course of research:
- Aulux Corp. Ltd.
- Cristallight Software
- CYBRA Corp.
- Data Systems International (DSI)
- DDi
- Esko Graphics BV
- Freyr Software Services
- Linn Systems Ltd.
- OPAL Associates Holding AG
- PSI Systems Inc
- RF SMART
- TEC IT Datenverarbeitung
- Tharo Systems Inc.
- Wasp Barcode Technologies
- Amtech Software
Enterprise Labelling Software Market News and Recent Developments
- BarTender y Mojix anuncian una alianza estratégica para revolucionar la trazabilidad. En septiembre de 2024, BarTender y Mojix anunciaron una alianza estratégica con el objetivo de revolucionar la trazabilidad. Las empresas se centrarán en soluciones integrales para la cadena de suministro que proporcionarán una transparencia sin precedentes para una toma de decisiones más inteligente y mejoras en la eficiencia operativa.
- CYBRA, líder en soluciones de códigos de barras y seguimiento RFID, anunció en enero de 2025 una alianza estratégica con Acumatica, proveedor líder de software ERP en la nube diseñado para optimizar las operaciones de pequeñas y medianas empresas. Esta colaboración brindará a los usuarios de Acumatica una nueva y potente opción para la impresión precisa de etiquetas y el seguimiento RFID en tiempo real, lo que ayudará a las empresas a optimizar sus operaciones y eliminar ineficiencias.
Cobertura y resultados del informe de mercado de software de etiquetado empresarial
El informe "Tamaño y pronóstico del mercado de software de etiquetado empresarial (2021-2031)" proporciona un análisis detallado del mercado que abarca las siguientes áreas:
- Tamaño y pronóstico del mercado de software de etiquetado empresarial a nivel mundial, regional y nacional para todos los segmentos clave del mercado cubiertos por el alcance.
- Tendencias del mercado de software de etiquetado empresarial, así como la dinámica del mercado, como los impulsores, las restricciones y las oportunidades clave.
- Análisis detallado de PEST y SWOT
- Análisis del mercado de software de etiquetado empresarial que abarca las principales tendencias del mercado, el marco global y regional, los principales actores, las regulaciones y los desarrollos recientes del mercado.
- Análisis del panorama industrial y la competencia, incluyendo la concentración del mercado, el análisis de mapas de calor, los actores destacados y los desarrollos recientes del mercado de software de etiquetado empresarial.
- Perfiles detallados de las empresas

Ankita es una profesional dinámica en investigación de mercados y consultoría con más de 8 años de experiencia en los sectores de tecnología, medios de comunicación, TIC, electrónica y semiconductores. Ha liderado y ejecutado con éxito más de 100 proyectos de consultoría e investigación para clientes globales como Microsoft, Oracle, NEC Corporation, SAP, KPMG y Expeditors International. Sus principales competencias incluyen la evaluación de mercado, el análisis de datos, la previsión, la formulación de estrategias, la inteligencia competitiva y la redacción de informes.
Ankita es experta en la gestión de ciclos completos de proyecto, desde el diseño de propuestas de preventa y las conversaciones con los clientes hasta la entrega de información práctica posventa. Es experta en la gestión de equipos multifuncionales, la estructuración de módulos de investigación complejos y la alineación de soluciones con los objetivos de negocio específicos del cliente. Sus excelentes habilidades de comunicación, liderazgo y presentación le han permitido obtener constantemente resultados orientados al valor en entornos de mercado dinámicos y en constante evolución.
- Análisis histórico (2 años), año base, pronóstico (7 años) con CAGR
- Análisis PEST y FODA
- Tamaño del mercado, valor/volumen: global, regional y nacional
- Industria y panorama competitivo
- Conjunto de datos de Excel
Testimonios
El informe de mercado de sistemas SCADA de Insight Partners es completo y ofrece información valiosa sobre las tendencias actuales y las previsiones futuras. El equipo fue altamente profesional, receptivo y me brindó un gran apoyo en todo momento. Estamos muy satisfechos y recomendamos ampliamente sus servicios.
RAN KEDEM Socio, Reali Technologies LTDsSolicité un informe sobre un mercado de software muy específico y el equipo lo elaboró en pocos días. La información era muy relevante y estaba bien presentada. Posteriormente, solicité algunos cambios y adiciones al informe. El equipo fue muy receptivo y recibí el informe final en menos de una semana.
JEAN-HERVE JENN Presidente, Future AnalyticaTrabajamos con The Insight Partners para un importante estudio y pronóstico de mercado. Nos brindaron una visión clara de las oportunidades y los riesgos, lo que nos ayudó a definir nuestros planes. Su investigación fue fácil de usar y se basó en datos sólidos. Nos ayudó a tomar decisiones inteligentes y seguras. Los recomendamos ampliamente.
PIYUSH NAGPAL Vicepresidente Sénior, , High Beam GlobalThe Insight Partners realizó una investigación de mercado profunda y bien estructurada con una sólida experiencia en el sector. Su equipo fue profesional y receptivo en todo momento. El sitio web, fácil de usar, facilitó el acceso a los informes del sector. Los recomendamos ampliamente por sus servicios de investigación confiables y de alta calidad.
YUKIHIKO ADACHI Director Ejecutivo, , Deep Blue, LLCEsta es la primera vez que compro un informe de mercado de The Insight Partners. Aunque al principio tenía dudas, visité su sitio web y me sentí más cómodo al arriesgarme y comprarlo. Estoy completamente satisfecho con la calidad del informe y el servicio al cliente. Tenía varias preguntas y comentarios sobre el informe inicial, pero después de un par de conversaciones por correo electrónico con su analista, creo que tengo un informe que puedo usar como base para nuestro proceso de planificación estratégica. Muchas gracias por tomarse el tiempo y hacer de esta una experiencia positiva. Sin duda, recomendaré sus servicios y serán mi primera opción cuando necesitemos más datos de mercado.
JOHN SUZUKI Presidente y Director Ejecutivo, Director de la Junta Directiva, BK TechnologiesAgradezco su apoyo y la profesionalidad que demostraron al atender mi solicitud de información sobre el mercado de diagnóstico in vitro (IVD) para enfermedades infecciosas en Nigeria. Agradezco su paciencia, su orientación y su disposición a ofrecerme un descuento, lo que finalmente nos permitió cerrar un trato. Espero poder colaborar con The Insight Partners en el futuro, gracias a la impresión que me causó este primer encuentro.
DRA. CHIJIOKE ONYIA, DIRECTORA GENERAL, PineCrest Healthcare Ltd.Razón para comprar
- Toma de decisiones informada
- Comprensión de la dinámica del mercado
- Análisis competitivo
- Información sobre clientes
- Pronósticos del mercado
- Mitigación de riesgos
- Planificación estratégica
- Justificación de la inversión
- Identificación de mercados emergentes
- Mejora de las estrategias de marketing
- Impulso de la eficiencia operativa
- Alineación con las tendencias regulatorias


Desbloquea descuentos exclusivos en informes
Consultar ahora


 Obtenga una muestra gratuita para - Mercado de software de etiquetado empresarial