Rapporto sul mercato dei dispositivi per l’imaging retinico 2028 per segmenti, geografia, dinamiche, sviluppi recenti e approfondimenti strategici
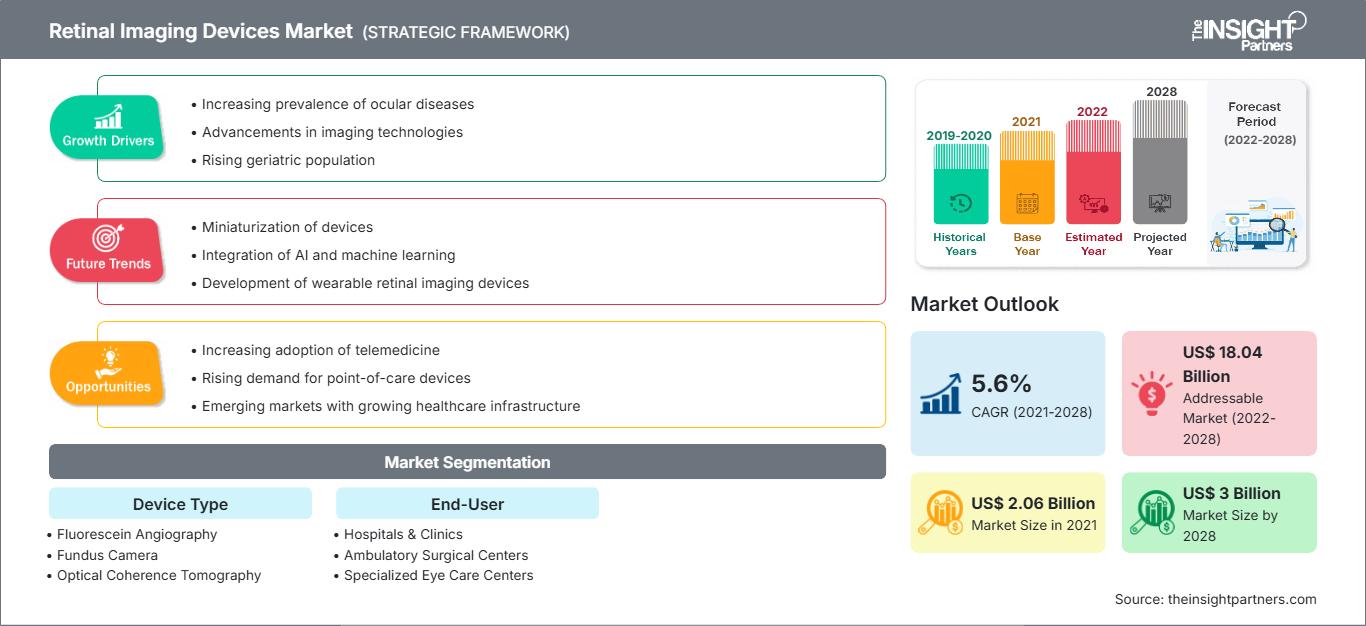
Dati storici : 2019-2020 | Anno base : 2021 | Periodo di previsione : 2022-2028Previsioni di mercato dei dispositivi di imaging retinico fino al 2028 - Impatto del COVID-19 e analisi globale per tipo di dispositivo (angiografia con fluoresceina, fundus camera e tomografia a coerenza ottica) e utente finale (ospedali e cliniche, centri chirurgici ambulatoriali, centri oculistici specializzati e altri utenti finali)
- Stato : Edito
- Codice del report : TIPRE00008683
- Categoria : Scienze della vita
- Numero di pagine : 148
- Formati di report disponibili :


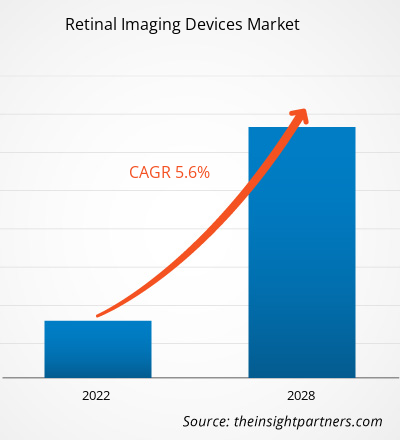
Si prevede che il mercato dei dispositivi di imaging retinico raggiungerà i 3,00 miliardi di dollari entro il 2028, rispetto ai 2,06 miliardi di dollari del 2021; si stima una crescita a un CAGR del 5,6% nel periodo 2021-2028.
L'imaging retinico è una tecnica utilizzata per analizzare e diagnosticare le condizioni della retina di un paziente. I dispositivi di imaging retinico (RID) utilizzano sistemi di imaging ad alta risoluzione per acquisire immagini interne dell'occhio. L'immagine acquisita aiuta i medici della rete Virtual Private Network (VSP) a valutare lo stato di salute della retina, contribuendo all'individuazione e alla gestione di patologie oculari e di salute come diabete, glaucoma e degenerazione maculare, tra le altre.
Personalizza questo rapporto in base alle tue esigenze
Potrai personalizzare gratuitamente qualsiasi rapporto, comprese parti di questo rapporto, o analisi a livello di paese, pacchetto dati Excel, oltre a usufruire di grandi offerte e sconti per start-up e università
Mercato dei dispositivi di imaging retinico: Approfondimenti strategici
-
Ottieni le principali tendenze chiave del mercato di questo rapporto.Questo campione GRATUITO includerà l'analisi dei dati, che vanno dalle tendenze di mercato alle stime e alle previsioni.
La crescita del mercato dei dispositivi di imaging retinico è attribuita al migliore accesso degli oculisti alla retina, alle crescenti iniziative globali per la cecità e ai progressi tecnologici. Tuttavia, l'elevato costo dei dispositivi OCT ostacola la crescita del mercato.
Approfondimenti di mercato: Aumento della prevalenza delle malattie oculari
I dispositivi di imaging retinico sono ampiamente utilizzati per diagnosticare e trattare diverse patologie oculari, come la retinopatia diabetica, la degenerazione maculare legata all'età, il glaucoma, il melanoma oculare e lievi problemi di vista. Inoltre, in tutto il mondo, la preoccupazione per la cecità o i problemi di vista sta crescendo in modo significativo. Secondo i dati pubblicati dall'Organizzazione Mondiale della Sanità (OMS) nell'ottobre 2021, quasi 2,2 miliardi di persone convivono con un deficit visivo o cecità. Di questi, circa un miliardo di casi di deficit visivo può essere prevenuto con una diagnosi e un trattamento adeguati. Questo miliardo di persone presenta diversi problemi oculari correlati a un deficit visivo da lontano moderato o grave o alla cecità. Le tecnologie diagnostiche basate sulle immagini hanno iniziato a offrire una crescita senza precedenti nelle patologie oculari basate su set di dati morfologici. Si prevede che tale fattore contribuirà al mercato dei dispositivi di imaging retinico nel periodo di previsione.
Approfondimenti basati sul tipo di dispositivo
In base al tipo di dispositivo, il mercato globale dei dispositivi di imaging retinico è stato segmentato in angiografia con fluoresceina, fundus camera e tomografia a coerenza ottica. Il segmento delle fundus camera ha detenuto la quota di mercato maggiore nel 2021. La fotografia del fondo oculare si è evoluta dai flash elettronici alle fotocamere basate su smartphone, fino al più recente kit portatile per l'esame oculistico (PEEK). PEEK è un'applicazione basata su smartphone per un esame oculistico completo. Il vantaggio di queste fotocamere è che anche un non oculista può scattare foto e, con un po' di formazione, valutarle. Tuttavia, si prevede che il segmento della tomografia a coerenza ottica registrerà il CAGR più elevato del mercato, pari all'8,1%, durante il periodo di previsione. La tomografia a coerenza ottica consente la valutazione di diversi livelli di ischemia maculare non diagnosticati con l'imaging primario. La tecnica è utilizzata come standard per le modalità di imaging oculistico.
Approfondimenti basati sull'utente finale
In base all'utente finale, il mercato globale dei dispositivi di imaging retinico è segmentato in ospedali e cliniche, cliniche specialistiche, centri di assistenza ambulatoriale e altri. Il segmento ospedali e cliniche ha detenuto la quota maggiore del mercato nel 2021 e si prevede che i centri oculistici specializzati registreranno il CAGR più elevato del mercato, pari al 6,6%, durante il periodo di previsione.
Mercato dei dispositivi di imaging retinicoLe tendenze regionali e i fattori che influenzano il mercato dei dispositivi di imaging retinico durante il periodo di previsione sono stati ampiamente spiegati dagli analisti di The Insight Partners. Questa sezione illustra anche i segmenti e la geografia del mercato dei dispositivi di imaging retinico in Nord America, Europa, Asia-Pacifico, Medio Oriente e Africa, America Meridionale e Centrale.
Ambito del rapporto di mercato sui dispositivi di imaging retinico
| Attributo del rapporto | Dettagli |
|---|---|
| Dimensioni del mercato in 2021 | US$ 2.06 Billion |
| Dimensioni del mercato per 2028 | US$ 3 Billion |
| CAGR globale (2021 - 2028) | 5.6% |
| Dati storici | 2019-2020 |
| Periodo di previsione | 2022-2028 |
| Segmenti coperti |
By Tipo di dispositivo
|
| Regioni e paesi coperti |
Nord America
|
| Leader di mercato e profili aziendali chiave |
|
Densità degli operatori del mercato dei dispositivi di imaging retinico: comprendere il suo impatto sulle dinamiche aziendali
Il mercato dei dispositivi di imaging retinico è in rapida crescita, trainato dalla crescente domanda degli utenti finali, dovuta a fattori quali l'evoluzione delle preferenze dei consumatori, i progressi tecnologici e una maggiore consapevolezza dei benefici del prodotto. Con l'aumento della domanda, le aziende stanno ampliando la propria offerta, innovando per soddisfare le esigenze dei consumatori e sfruttando le tendenze emergenti, alimentando ulteriormente la crescita del mercato.
- Ottieni il Mercato dei dispositivi di imaging retinico Panoramica dei principali attori chiave
Approfondimenti regionali
In base alle regioni, il Nord America ha rappresentato la quota maggiore nel 2021 e si prevede che seguirà un trend simile nel periodo di previsione. Si prevede che la regione Asia-Pacifico registrerà il tasso di crescita più elevato nel periodo di previsione. L'applicazione dell'intelligenza artificiale (IA) e del sistema di apprendimento profondo (DLS) per migliorare la copertura dello screening a Singapore dovrebbe sostenere la crescita regionale nei prossimi sette anni.
Il lancio e l'approvazione dei prodotti sono strategie comunemente adottate dalle aziende per espandere la propria presenza globale e il proprio portafoglio prodotti. Inoltre, gli operatori del mercato dei dispositivi di imaging retinico si concentrano sulla strategia di partnership per espandere la propria clientela, il che, a sua volta, consente loro di mantenere il proprio marchio in tutto il mondo.
In base alla tipologia di dispositivo, il mercato dei dispositivi di imaging retinico è suddiviso in angiografia con fluoresceina, fundus camera e tomografia a coerenza ottica. In base all'utente finale, il mercato è segmentato in ospedali e cliniche, centri chirurgici ambulatoriali, centri oculistici specializzati e altri utenti finali. In base all'area geografica, il mercato dei dispositivi di imaging retinico è segmentato in Nord America (Stati Uniti, Canada e Messico), Europa (Regno Unito, Germania, Francia, Italia, Spagna e resto d'Europa), Asia-Pacifico (Cina, Giappone, India, Australia, Corea del Sud e resto dell'Asia-Pacifico), Medio Oriente e Africa (Emirati Arabi Uniti, Arabia Saudita, Sudafrica e resto del Medio Oriente e Africa) e Sud e Centro America (Brasile, Argentina e resto del Sud e Centro America).
Alcuni dei profili aziendali elencati nel nostro ambito di ricerca includono, tra gli altri, Carl Zeiss Meditec, Revenio Group Oyj, Nikon Corporation, Optomed, Topcon Corporation, Imagine Eyes, Epipole Ltd, Forus Health Pvt Ltd, Eyenuk Inc e Phoenix Technology Group LLC.
Mrinal è un'analista di ricerca esperta con oltre 8 anni di esperienza nella consulenza e nell'intelligence di mercato nel settore delle scienze biologiche. Grazie a una mentalità strategica e a un costante impegno verso l'eccellenza, ha maturato una profonda competenza nelle previsioni farmaceutiche, nella valutazione delle opportunità di mercato e nello sviluppo di benchmark di settore. Il suo lavoro è incentrato sulla fornitura di insight fruibili che consentono ai clienti di prendere decisioni strategiche consapevoli.
Il punto di forza di Mrinal risiede nella capacità di tradurre complessi set di dati quantitativi in business intelligence significative. Il suo acume analitico è fondamentale per definire strategie di go-to-market (GTM) e individuare opportunità di crescita nei settori farmaceutico e dei dispositivi medici. In qualità di consulente di fiducia, si concentra costantemente sulla semplificazione dei processi di flusso di lavoro e sulla definizione di best practice, promuovendo così l'innovazione e l'efficienza operativa per i suoi clienti.
- Analisi storica (2 anni), anno base, previsione (7 anni) con CAGR
- Analisi PEST e SWOT
- Valore/volume delle dimensioni del mercato - Globale, Regionale, Nazionale
- Industria e panorama competitivo
- Set di dati Excel
Report recenti
Testimonianze
Il report di mercato sui sistemi SCADA di Insight Partners è completo, con preziosi spunti sulle tendenze attuali e sulle previsioni future. Il team si è dimostrato altamente professionale, reattivo e disponibile in ogni fase del progetto. Siamo molto soddisfatti e consigliamo vivamente i loro servizi.
RAN KEDEM Partner, Reali Technologies LTDsHo richiesto un report su un mercato software molto specifico e il team lo ha prodotto in pochi giorni. Le informazioni erano molto pertinenti e ben presentate. Ho quindi richiesto alcune modifiche e aggiunte al report. Il team è stato ancora una volta molto reattivo e ho ricevuto il report finale in meno di una settimana.
JEAN-HERVE JENN Presidente, Future AnalyticaAbbiamo collaborato con The Insight Partners per un importante studio di mercato e una previsione. Ci hanno fornito informazioni chiare su opportunità e rischi, che ci hanno aiutato a definire i nostri piani. La loro ricerca è stata facile da usare e basata su dati solidi. Ci ha aiutato a prendere decisioni intelligenti e consapevoli. Li consigliamo vivamente.
PIYUSH NAGPAL Vicepresidente senior, Abbaglianti globaliInsight Partners ha fornito ricerche di mercato approfondite e ben strutturate, con una solida competenza nel settore. Il loro team si è dimostrato professionale e reattivo in ogni fase. Il sito web intuitivo ha reso l'accesso ai report di settore semplice e immediato. Li consigliamo vivamente per servizi di ricerca affidabili e di alta qualità.
YUKIHIKO ADACHI Amministratore delegato, Deep Blue, LLC.Questa è la prima volta che acquisto un report di mercato da The Insight Partners. Sebbene inizialmente fossi indeciso, ho visitato il loro sito web e mi sono sentito più a mio agio nell'acquistare un report di mercato. Sono completamente soddisfatto della qualità del report e del servizio clienti. Avevo diverse domande e commenti sul report iniziale, ma dopo un paio di conversazioni via email con il loro analista credo di avere un report che posso utilizzare come input per il nostro processo di pianificazione strategica. Grazie mille per aver dedicato del tempo extra e aver reso questa esperienza positiva. Consiglierò sicuramente il vostro servizio ad altri e sarete la mia prima persona a cui rivolgermi quando avremo bisogno di ulteriori dati di mercato.
GIOVANNI SUZUKI Presidente e Amministratore Delegato, Consigliere di Amministrazione, Tecnologie BKDesidero esprimere la mia gratitudine per il supporto e la professionalità dimostrati nel rispondere alla mia richiesta di informazioni sul mercato dei dispositivi medici in vitro per malattie infettive in Nigeria. Apprezzo la vostra pazienza, la vostra guida e la vostra disponibilità a offrirmi uno sconto, che alla fine ci ha permesso di concludere l'affare. Non vedo l'ora di collaborare con The Insight Partners in futuro, grazie anche all'impressione che mi avete lasciato dopo questo primo incontro.
Dott. Chijioke AMMINISTRATORE DELEGATO DI ONYIA, PineCrest Healthcare Ltd.Motivo dell'acquisto
- Processo decisionale informato
- Comprensione delle dinamiche di mercato
- Analisi competitiva
- Analisi dei clienti
- Previsioni di mercato
- Mitigazione del rischio
- Pianificazione strategica
- Giustificazione degli investimenti
- Identificazione dei mercati emergenti
- Miglioramento delle strategie di marketing
- Aumento dell'efficienza operativa
- Allineamento alle tendenze normative


 Ottieni un campione gratuito per - Mercato dei dispositivi di imaging retinico