
Taille, demande et croissance du marché des dispositifs d'imagerie rétinienne d'ici 2034
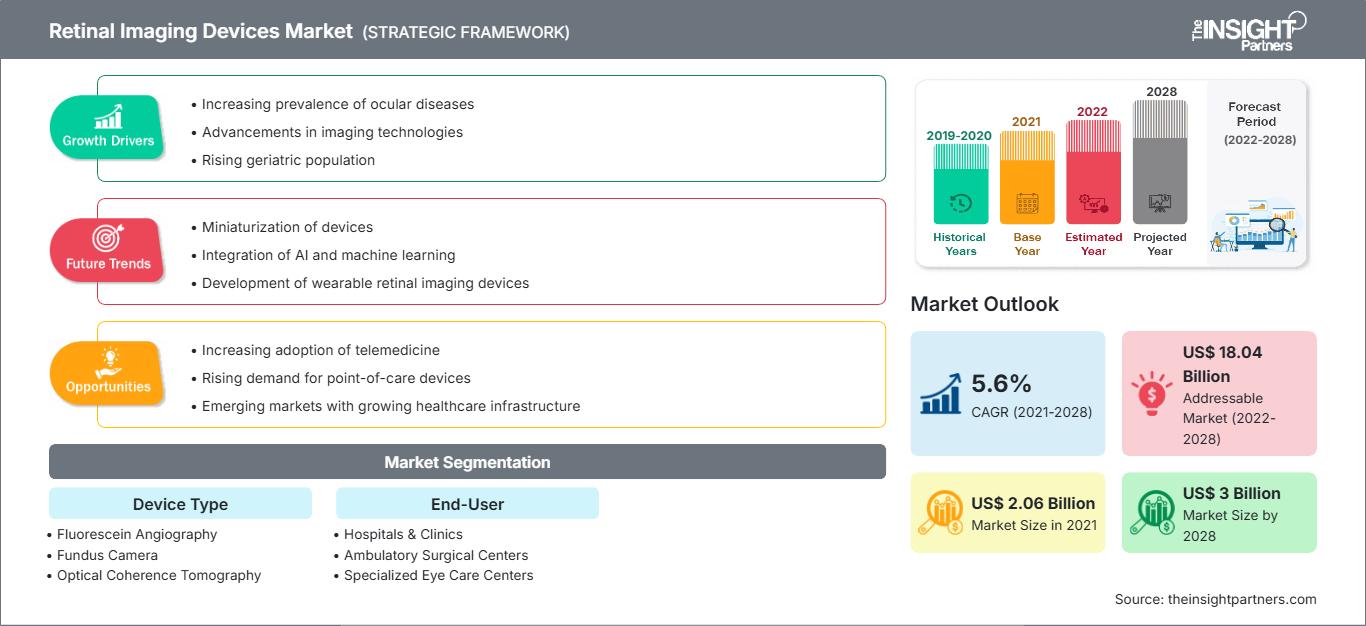
Taille et prévisions du marché des dispositifs d'imagerie rétinienne (2021-2034), part de marché mondiale et régionale, tendances et analyse des opportunités de croissance : Couverture du rapport : Par type de dispositif (angiographie à la fluorescéine, caméra de fond d'œil et tomographie par cohérence optique), par utilisateur final (hôpitaux et cliniques, centres de chirurgie ambulatoire, centres de soins oculaires spécialisés et autres utilisateurs finaux) et par zone géographique (Amérique du Nord, Europe, Asie-Pacifique et Amérique du Sud et centrale)
- Statut : Données publiées
- Code du rapport : TIPRE00008683
- Catégorie : Sciences de la vie
- Nombre de pages : 150
- Formats de rapport disponibles :


- Date de dernière mise à jour : June 26, 2026

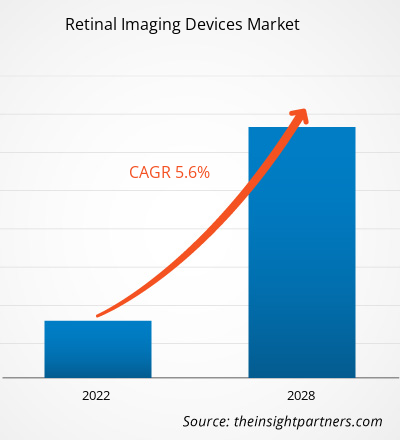
Le marché mondial des dispositifs d'imagerie rétinienne devrait atteindre 8,81 milliards de dollars américains d'ici 2034, contre 4,29 milliards de dollars américains en 2025. Ce marché devrait enregistrer un TCAC de 8,33 % au cours de la période de prévision 2026-2034.
Les principaux facteurs de croissance du marché incluent l'augmentation de la prévalence mondiale des déficiences visuelles, qui touchent plus de 2,2 milliards de personnes, et un intérêt clinique accru pour les outils de diagnostic précoce de la cécité évitable. Par ailleurs, le marché devrait bénéficier de l'intégration de l'intelligence artificielle (IA) dans le dépistage, du développement rapide de la téléophtalmologie et de la prévalence croissante de la dégénérescence maculaire liée à l'âge (DMLA) et de la rétinopathie diabétique au sein de la population mondiale vieillissante.
Analyse du marché des dispositifs d'imagerie rétinienne
L'analyse du marché des dispositifs d'imagerie rétinienne révèle une évolution vers des solutions de diagnostic non invasives et à haute résolution, les cliniciens privilégiant l'intervention précoce. Les tendances du marché indiquent une transition des systèmes analogiques traditionnels vers des plateformes numériques avancées, notamment la tomographie par cohérence optique (OCT). Des opportunités stratégiques émergent avec les dispositifs d'imagerie portables et de poche, dont la capacité d'évaluation au chevet du patient offre un avantage concurrentiel indéniable pour atteindre les populations mal desservies. L'expansion du marché repose sur l'intégration de l'apprentissage profond pour automatiser la détection des maladies et améliorer l'efficacité des flux de travail. La différenciation concurrentielle se manifeste désormais par les systèmes hybrides tout-en-un qui combinent l'imagerie ultra-grand champ et l'OCT intégrée, permettant aux cliniques ophtalmologiques spécialisées de réaliser des bilans plus complets tout en optimisant le temps passé au fauteuil.
Aperçu du marché des dispositifs d'imagerie rétinienne
Les outils de diagnostic ophtalmique ont évolué, passant d'appareils encombrants à des plateformes numériques agiles, dotées d'intelligence artificielle. Le marché comprend des systèmes ultra-grand champ, des OCT à balayage de source et des caméras de fond d'œil portables conçues pour le dépistage à distance. Les géants établis des technologies médicales et les jeunes pousses de la santé numérique se disputent ce marché, utilisant l'imagerie laser avancée et la gestion des données dans le cloud. La demande croissante d'examens ophtalmologiques de routine chez les personnes diabétiques en Amérique du Nord et en Europe a accru la popularité du dépistage automatisé comme solution de bien-être mobile. L'Amérique du Nord domine le marché en termes de revenus grâce à son cadre réglementaire structuré, tandis que la région Asie-Pacifique progresse grâce à des initiatives gouvernementales de dépistage à grande échelle et à un développement rapide des infrastructures. Le marché américain est le plus mature, porté par un écosystème réglementaire structuré et l'intégration rapide du dépistage assisté par l'intelligence artificielle. Des politiques de remboursement favorables aux diagnostics avancés et un réseau croissant de centres ophtalmologiques spécialisés accélèrent encore la croissance, positionnant la région comme un pôle majeur d'innovation technologique.
Personnalisez ce rapport selon vos besoins.
Bénéficiez d'une PERSONNALISATION GRATUITEMarché des dispositifs d'imagerie rétinienne : Perspectives stratégiques
-
Découvrez les principales tendances du marché présentées dans ce rapport.Cet échantillon GRATUIT comprendra une analyse de données, allant des tendances du marché aux estimations et prévisions.
Facteurs de croissance et opportunités du marché des dispositifs d'imagerie rétinienne
Facteurs de marché :
- Prévalence croissante de la rétinopathie diabétique et du glaucome : l’incidence mondiale croissante des troubles oculaires chroniques métaboliques et liés à l’âge est le principal facteur de la demande en imagerie rétinienne, ce qui nécessite une surveillance diagnostique fréquente et précise.
- Intégration technologique de l'IA et de l'apprentissage automatique : les logiciels basés sur l'IA peuvent désormais identifier les signes précoces de pathologies rétiniennes avec une grande sensibilité, réduisant ainsi la charge de travail des spécialistes et permettant des filières d'orientation plus rapides.
- Évolution vers l'imagerie non mydriatique et à grand champ : le confort du patient favorise l'adoption d'appareils qui ne nécessitent pas de dilatation de la pupille et qui peuvent capturer jusqu'à 200° de la rétine en une seule prise, améliorant ainsi la rapidité et l'efficacité des dépistages.
Opportunités de marché :
- Développement de la téléophtalmologie et des soins à distance : les dispositifs d’imagerie portables et connectés au cloud offrent des opportunités importantes pour étendre les soins oculaires spécialisés aux zones rurales et aux établissements de soins primaires.
- Croissance dans les corridors émergents d'Asie-Pacifique et d'Amérique latine : des partenariats stratégiques entre des fabricants mondiaux et des distributeurs régionaux en Chine, en Inde et au Brésil facilitent l'accès à des segments à forte marge où la modernisation des soins de santé s'accélère.
- Solutions de surveillance à domicile : Il existe une opportunité croissante de développer des outils d’imagerie rétinienne de qualité médicale, utilisés par le patient, pour la surveillance continue d’affections chroniques comme la DMLA humide entre les consultations cliniques.
Analyse de segmentation du rapport sur le marché des dispositifs d'imagerie rétinienne
La part de marché des dispositifs d'imagerie rétinienne est analysée selon différents segments afin de mieux comprendre sa structure, son potentiel de croissance et les tendances émergentes. Voici l'approche de segmentation standard utilisée dans la plupart des rapports sectoriels :
Par type d'appareil :
- Tomographie par cohérence optique (OCT) : Le segment technologique dominant, apprécié pour ses capacités d'imagerie en coupe à haute résolution essentielles au diagnostic de la DMLA et du glaucome.
- Caméra de fond d'œil : un segment en forte croissance, notamment pour les modèles non mydriatiques et portables utilisés dans le dépistage de la rétinopathie diabétique et les examens ophtalmologiques généraux.
- Angiographie à la fluorescéine : technique d’imagerie spécialisée utilisée principalement pour l’évaluation vasculaire, qui continue de connaître une demande stable dans les centres chirurgicaux à fort volume d’activité et les hôpitaux de recherche.
Par l'utilisateur final :
- Hôpitaux et cliniques : représentent le plus grand segment d’utilisateurs finaux, en raison du volume élevé de patients et de la capacité financière d’investir dans des salles d’imagerie multimodales haut de gamme.
- Centres de soins oculaires spécialisés : un segment en pleine expansion, les cabinets privés spécialisés adoptant des outils de dépistage portables et intégrant l’IA pour différencier leurs services.
- Centres de chirurgie ambulatoire (ASC) : Adoption croissante de l'imagerie pour l'évaluation préopératoire et le suivi postopératoire dans les interventions rétiniennes ambulatoires.
Par géographie :
- Amérique du Nord
- Europe
- Asie-Pacifique
- Amérique du Sud et centrale
- Moyen-Orient et Afrique
Portée du rapport sur le marché des dispositifs d'imagerie rétinienne
| Attribut du rapport | Détails |
|---|---|
| Taille du marché en 2025 | 4,29 milliards de dollars américains |
| Taille du marché d'ici 2034 | 8,81 milliards de dollars américains |
| TCAC mondial (2026 - 2034) | 8,33% |
| Données historiques | 2021-2024 |
| Période de prévision | 2026-2034 |
| Segments couverts |
Par type d'appareil
|
| Régions et pays couverts |
Amérique du Nord
|
| Leaders du marché et profils d'entreprises clés |
|
Densité des acteurs du marché des dispositifs d'imagerie rétinienne : comprendre son impact sur la dynamique commerciale
Le marché des dispositifs d'imagerie rétinienne connaît une croissance rapide, portée par une demande croissante des utilisateurs finaux. Cette demande est alimentée par l'évolution des préférences des consommateurs, les progrès technologiques et une meilleure connaissance des avantages du produit. Face à cette demande grandissante, les entreprises diversifient leur offre, innovent pour répondre aux besoins des consommateurs et tirent parti des tendances émergentes, ce qui contribue à stimuler la croissance du marché.
Analyse des parts de marché des dispositifs d'imagerie rétinienne par zone géographique
La région Asie-Pacifique devrait connaître la croissance la plus rapide au cours de la période de prévision. Les marchés émergents d'Amérique du Sud et centrale ainsi que de la région MENA présentent également des opportunités inexploitées, la vision gouvernementale de toutes les initiatives stimulant l'acquisition d'équipements de diagnostic.
Le marché des dispositifs d'imagerie rétinienne connaît une transformation majeure, passant d'un outil clinique statique à un écosystème de diagnostic numérique à haute vitesse. Cette croissance est alimentée par la prévalence croissante de maladies chroniques telles que la rétinopathie diabétique, la forte demande de dépistage non invasif et l'expansion du secteur des centres ophtalmologiques haut de gamme. Vous trouverez ci-dessous un résumé des parts de marché et des tendances par région :
1. Amérique du Nord
- Part de marché : Détient la plus grande part de marché au niveau mondial, grâce à un système de santé bien établi et à des taux d'adoption élevés de l'imagerie avancée.
-
Facteurs clés :
- Préférence croissante des consommateurs pour le dépistage intégrant l'IA et les profils OCT haute résolution
- Intégration des soins ophtalmologiques spécialisés dans les établissements de soins ambulatoires haut de gamme et les programmes de bien-être en entreprise
- Utilisation accrue de l'imagerie ultra-grand champ parallèlement aux protocoles établis de photographie du fond d'œil
- Tendances : Déploiement à grande échelle du dépistage autonome basé sur l'IA dans les soins primaires et adoption réussie d'appareils portables pour séduire les populations mobiles adeptes des soins de santé.
2. Europe
- Part de marché : Détient une part importante, soutenue par des systèmes de santé universels robustes mettant l'accent sur l'ophtalmologie préventive en Allemagne, au Royaume-Uni et en France.
-
Facteurs clés :
- Utilisation domestique importante des systèmes OCT avancés pour la prise en charge de la dégénérescence maculaire liée à l'âge
- Infrastructure de traitement établie et cadres réglementaires stricts pour les données d'imagerie médicale
- Un soutien gouvernemental solide aux initiatives de dépistage en santé publique et aux soins de la vue en milieu rural
- Tendances : Un changement stratégique s’opère, privilégiant l’interopérabilité numérique et l’intégration des résultats d’imagerie dans les dossiers médicaux électroniques. On observe également un intérêt croissant pour les dispositifs médicaux économes en énergie et durables, afin de répondre aux politiques de santé environnementale.
3. Asie-Pacifique
- Part de marché : La région à la croissance la plus rapide, portée par les populations de patients massives en Chine et en Inde.
-
Facteurs clés :
- Vaste clientèle à la recherche d'une nutrition diagnostique non invasive et de qualité supérieure pour les yeux vieillissants
- Initiatives de santé rurale soutenues par le gouvernement et axées sur une infrastructure médicale intelligente
- L'urbanisation rapide et l'augmentation des revenus disponibles entraînent une préférence pour les soins oculaires de luxe occidentalisés.
- Tendances : Forte dépendance aux plateformes de commerce électronique pour les achats B2B et adoption rapide des caméras IA dans les hôpitaux communautaires pour identifier les maladies causant la cécité.
4. Amérique du Sud et centrale
- Part de marché : Marché émergent avec une croissance des cliniques privées dans des pays comme le Brésil et le Chili.
-
Facteurs clés :
- La prise de conscience croissante de la supériorité clinique de l'imagerie rétinienne précoce pour la prise en charge de l'hypertension et du diabète
- Modernisation des petites cliniques ophtalmologiques en centres de diagnostic commerciaux pour approvisionner les pôles urbains
- Intérêt croissant pour le tourisme médical de haute technologie parmi les segments à revenus moyens et élevés
- Tendances : Croissance des marques de soins oculaires spécialisées et introduction d'unités de dépistage mobiles pour se différencier du marché traditionnel des hôpitaux publics.
5. Moyen-Orient et Afrique
- Part de marché : Marché en développement, profondément enraciné dans les soins communautaires, en transition vers des systèmes de santé commerciaux formalisés.
-
Facteurs clés :
- La présence traditionnelle des soins de la vue dans les priorités de santé régionales s'explique par les taux élevés de cataractes et d'erreurs de réfraction.
- Forte demande de produits d'imagerie portables, stables et durables, dans les climats arides ou isolés.
- Investissements stratégiques dans les soins de santé intelligents pour améliorer la sécurité des diagnostics locaux et réduire la dépendance aux consultations à l'étranger
- Tendances : Mise en œuvre de la photographie numérique moderne du fond d'œil pour formaliser le marché du dépistage informel, associée à un intérêt accru pour la tomographie par cohérence optique (OCT) haute résolution dans le segment pédiatrique.
Forte densité de marché et concurrence
La concurrence s'intensifie en raison de la présence de leaders établis tels que Carl Zeiss Meditec AG, Topcon Corporation et NIDEK Co., Ltd. Des experts régionaux en diagnostic et des acteurs de niche comme Optos plc (Nikon) et Heidelberg Engineering, ainsi que des innovateurs spécialisés tels qu'Optomed et Eyenuk Inc., contribuent également à un paysage de marché diversifié et en expansion rapide.
Ce contexte concurrentiel pousse les fournisseurs à se différencier par :
- Premiumisation et image de marque fonctionnelle : positionner l’imagerie rétinienne comme une alternative diagnostique supérieure à l’ophtalmoscopie traditionnelle en mettant l’accent sur une résolution plus élevée, des capacités non mydriatiques et une analyse prédictive basée sur l’IA.
- Gamme de produits diversifiée : L’offre en imagerie rétinienne ne se limite plus aux OCT de bureau. Les entreprises proposent des systèmes ultra-grand champ, des logiciels d’analyse de données de pointe et des caméras portables haut de gamme.
- Intégration verticale : les producteurs gèrent l’intégralité de la chaîne de valeur, du développement de capteurs et de lentilles optiques propriétaires à la fourniture de services de stockage de données dans le cloud et de rapports de diagnostic par IA.
- Technologies de traitement avancées : De nouvelles techniques d’imagerie, comme la tomographie par cohérence optique à balayage de source et l’intégration multimodale, contribuent à la création de cartes rétiniennes de haute qualité utilisées dans la pratique clinique et l’industrie de la recherche pharmaceutique dans le monde entier.
Opportunités et initiatives stratégiques
- Associez-vous aux circuits de distribution de produits de santé haut de gamme et aux plateformes de télémédecine pour tirer parti de la demande croissante de services de diagnostic accessibles et adaptés aux patients sur les marchés Asie-Pacifique et Amérique du Nord.
- Intégrer des capacités d'automatisation et de surveillance à distance basées sur l'IA pour séduire les professionnels de santé et les systèmes de santé férus de technologie qui cherchent à améliorer leur efficacité opérationnelle et le débit de patients.
Les principales entreprises opérant sur le marché des dispositifs d'imagerie rétinienne sont :
- Carl Zeiss Meditec
- Revenio Group Oyj
- Société Nikon
- Optomed
- Société Topcon
- Imaginez les yeux
- Epipole Ltd
- Forus Health Pvt Ltd
- Eyenuk Inc
- Phoenix Technology Group LLC
Avertissement : Les entreprises mentionnées ci-dessus ne sont classées dans aucun ordre particulier.
Actualités et développements récents du marché des dispositifs d'imagerie rétinienne
- En juillet 2025, Optomed USA a annoncé le lancement de sa dernière innovation : Optomed Lumo®, une caméra de fond d’œil portable de nouvelle génération conçue pour rendre l’imagerie rétinienne de haute qualité accessible aux soins primaires et au-delà. Optomed Lumo est une caméra de fond d’œil non mydriatique, homologuée par la FDA sous le code produit PJZ, destinée à capturer et à stocker des images de l’œil. Grâce à son intégration DICOM sans fil, ses flux de travail programmables et son interface utilisateur intuitive, Optomed Lumo est conçue pour une utilisation flexible et simple dans divers contextes de soins.
- En juillet 2025, Topcon Healthcare, Inc., leader mondial des solutions de santé numérique et de données oculaires, a annoncé l'acquisition d'Intelligent Retinal Imaging Systems (IRIS), entreprise américaine pionnière dans le domaine des technologies de dépistage rétinien par analyse de données en nuage. Cette acquisition stratégique représente une étape majeure pour Topcon Healthcare dans le renforcement de sa présence en soins primaires et témoigne de son engagement en faveur du dépistage précoce des maladies grâce à une prise en charge connectée et fondée sur les données.
Rapport sur le marché des dispositifs d'imagerie rétinienne : contenu et livrables
Le rapport « Taille et prévisions du marché des dispositifs d’imagerie rétinienne (2021-2034) » fournit une analyse détaillée du marché couvrant les domaines suivants :
- Taille et prévisions du marché des dispositifs d'imagerie rétinienne aux niveaux mondial, régional et national pour tous les segments de marché clés couverts par le présent document.
- Tendances du marché des dispositifs d'imagerie rétinienne, ainsi que dynamique du marché, notamment les moteurs, les freins et les principales opportunités
- Analyse PEST et SWOT détaillée
- Analyse du marché des dispositifs d'imagerie rétinienne couvrant les principales tendances du marché, le cadre mondial et régional, les principaux acteurs, la réglementation et les développements récents du marché
- Analyse du paysage industriel et de la concurrence, incluant la concentration du marché, l'analyse par carte thermique, les principaux acteurs et les développements récents sur le marché des dispositifs d'imagerie rétinienne.
- Profils d'entreprise détaillés

Analyste de recherche chevronnée, Mme Mrinal cumule plus de 8 ans d'expérience en veille stratégique et conseil dans le secteur des sciences de la vie. Dotée d'un esprit stratégique et d'un engagement indéfectible envers l'excellence, elle a acquis une expertise approfondie en prévision pharmaceutique, en évaluation des opportunités de marché et en élaboration de benchmarks sectoriels. Son travail consiste à fournir des informations exploitables permettant à ses clients de prendre des décisions stratégiques éclairées.
La principale force de Mme Mrinal réside dans sa capacité à traduire des données quantitatives complexes en données décisionnelles pertinentes. Son sens de l'analyse est essentiel à l'élaboration de stratégies de mise sur le marché (GTM) et à la découverte d'opportunités de croissance dans les secteurs pharmaceutique et des dispositifs médicaux. Consultante de confiance, elle s'attache constamment à rationaliser les processus et à établir les meilleures pratiques, favorisant ainsi l'innovation et l'efficacité opérationnelle de ses clients.
- Analyse complète de la taille du marché et prévisions
- Analyse détaillée de la segmentation
- Évaluation approfondie de la dynamique du marché
- Aperçus par région et par pays
- Paysage concurrentiel et analyse comparative des entreprises
- Intelligence économique stratégique
Témoignages
Le rapport sur le marché des systèmes SCADA d'Insight Partners est complet et fournit des informations précieuses sur les tendances actuelles et les prévisions. L'équipe a fait preuve d'un grand professionnalisme, d'une grande réactivité et d'un grand soutien tout au long du projet. Nous sommes très satisfaits et recommandons vivement leurs services.
RAN KEDEM Partenaire, Reali Technologies LTDJ'ai demandé un rapport sur un marché logiciel très spécifique et l'équipe l'a produit en quelques jours. Les informations étaient très pertinentes et bien présentées. J'ai ensuite demandé des modifications et des ajouts au rapport. L'équipe a de nouveau été très réactive et j'ai reçu le rapport final en moins d'une semaine.
JEAN-HERVÉ JENN Président, Future AnalyticaNous avons collaboré avec The Insight Partners pour une importante étude de marché et des prévisions. Ils nous ont fourni une vision claire des opportunités et des risques, ce qui nous a aidés à élaborer nos plans. Leurs recherches étaient faciles à utiliser et basées sur des données solides. Elles nous ont permis de prendre des décisions éclairées et en toute confiance. Nous les recommandons vivement.
PIYUSH NAGPAL Vice-président principal, Feux de route mondiauxInsight Partners a réalisé une étude de marché pertinente et bien structurée, avec une solide expertise du domaine. Son équipe a fait preuve de professionnalisme et de réactivité tout au long du projet. Son site web convivial a facilité l'accès aux rapports sectoriels. Nous recommandons vivement ses services d'études fiables et de haute qualité.
YUKIHIKO ADACHI PDG, Bleu profond, LLC.C'est la première fois que j'achète une étude de marché auprès de The Insight Partners. J'étais un peu hésitant au début, mais j'ai consulté leur site web et me suis senti plus à l'aise pour prendre le risque d'acheter une étude de marché. Je suis entièrement satisfait de la qualité du rapport et du service client. J'avais plusieurs questions et commentaires concernant le rapport initial, mais après quelques échanges par e-mail avec leur analyste, je pense avoir obtenu un rapport qui pourra alimenter notre processus de planification stratégique. Merci beaucoup pour votre temps et pour avoir rendu cette expérience positive. Je recommanderai sans hésiter vos services et vous serez mon premier contact lorsque nous aurons besoin de données de marché supplémentaires.
JOHN SUZUKI Président-directeur général, administrateur du conseil d'administration, BK TechnologiesJe tiens à vous remercier pour votre soutien et le professionnalisme dont vous avez fait preuve lors du traitement de ma demande d'informations concernant le marché des dispositifs de diagnostic in vitro (DIV) pour les maladies infectieuses au Nigéria. J'apprécie votre patience, vos conseils et votre volonté d'offrir une réduction, ce qui nous a finalement permis de conclure un accord. Je me réjouis de collaborer à nouveau avec The Insight Partners, grâce à l'impression que vous m'avez laissée suite à cette première rencontre.
DR CHIJIOKE DIRECTEUR GÉNÉRAL D'ONYIA, PineCrest Healthcare Ltd.Raison d'acheter
- Prise de décision éclairée
- Compréhension de la dynamique du marché
- Analyse concurrentielle
- Connaissances clients
- Prévisions de marché
- Atténuation des risques
- Planification stratégique
- Justification des investissements
- Identification des marchés émergents
- Amélioration des stratégies marketing
- Amélioration de l'efficacité opérationnelle
- Alignement sur les tendances réglementaires


