
3Dスキャナー市場の動向、需要、成長予測(2034年まで)
3Dスキャナ市場規模と予測(2021年~2034年)、世界および地域別シェア、トレンド、成長機会分析レポートの対象範囲:製品タイプ別(3Dレーザースキャナ、構造化光スキャナ)、範囲別(短距離、中距離、長距離)、技術別(レーザー三角測量、パターンフリンジ三角測量、レーザーパルスベース、レーザー位相シフトベース)、スキャナタイプ別(三脚マウント、固定式、ポータブル、デスクトップ)、エンドユーザー産業別(自動車、航空宇宙・防衛、ヘルスケア、建築・建設、エネルギー・電力、その他)
- ステータス : 公開されたデータ
- レポートコード : TIPTE100000301
- カテゴリー : エレクトロニクスおよび半導体
- ページ数 : 150
- 利用可能なレポート形式 :


- 最終更新日 : July 14, 2026

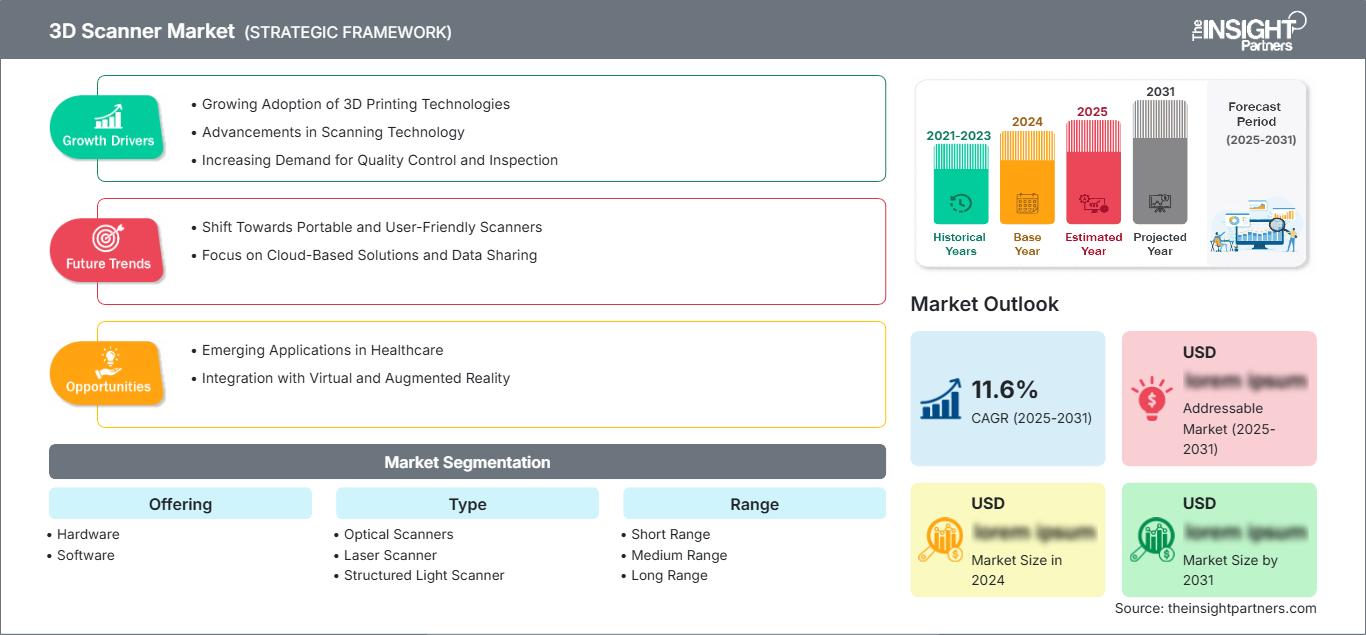
2025年の市場規模
49億5000 万米ドル
基準年値
2034年の予測
112億1000 万米ドル
2034年までに予測される
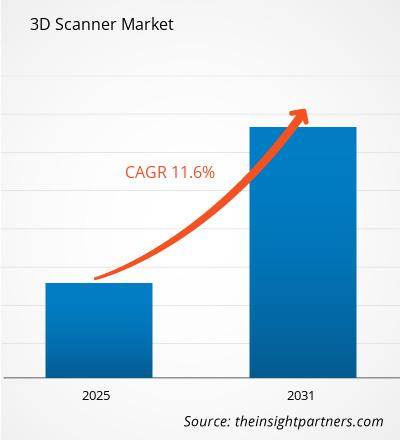
2026年~2034年の年平均成長率(CAGR)
9.51 %
成長率
対象市場
721億1000 万米ドル
(2026年~2034年)
3Dスキャナー市場は、2025年の49億5,000万米ドルから2034年には112億1,000万米ドルに拡大すると予測されており、2026年から2034年までの年平均成長率(CAGR)は9.51%となる見込みです。この成長は、製造業、ヘルスケア画像処理、インフラモデリングなど、高精度デジタル計測技術の導入拡大によって牽引されています。自動化された生産環境やリバースエンジニアリングのワークフローにおけるスキャンシステムの統合が進むにつれ、先進国と新興国の両方、特に工業化された生産エコシステムにおいて、需要が引き続き高まっています。
北米の3Dスキャナー市場は、2026年から2034年にかけて年平均成長率(CAGR)9.2~9.8%と予測され、引き続き力強い成長が見込まれます。この成長を支えているのは、先進的な航空宇宙製造、自動車研究開発への投資、そしてデジタルツイン技術の普及拡大です。さらに、企業におけるデジタル化推進の取り組みや、品質管理システムにおける計測ソリューションの普及も、地域需要を押し上げています。
3Dスキャナー市場の評価と洞察
- 北米:北米は2025年時点で市場シェア34~38%を占め、2026~2034年にかけて年平均成長率(CAGR)9.2~9.8%で拡大する見込みです。成長の原動力は、産業オートメーション、航空宇宙工学における精密加工ニーズ、そして製造業クラスター全体における高度な計測ソリューションの導入です。
- 米国:2025年には、北米の3Dスキャナー市場シェアの82~86%を米国が占め、年平均成長率(CAGR)は9.3~9.9%で成長すると予測されています。防衛産業、自動車のプロトタイプ開発、デジタルエンジニアリングのエコシステムからの強い需要が、持続的な拡大を支えています。
- 欧州:欧州は2025年に25~29%のシェアを占め、年平均成長率(CAGR)は8.8~9.3%となる見込みです。ドイツ、フランス、英国、イタリア、スペインは、強力な自動車工学技術、工業デザインの革新、そして航空宇宙部品製造の増加を背景に、導入をリードしています。
- アジア太平洋地域:アジア太平洋地域は、2025年には3Dスキャナー市場全体の28~32%を占め、年平均成長率(CAGR)は10.2~10.8%で拡大すると予測されています。中国、日本、韓国、インド、オーストラリアは、産業オートメーション、電子機器製造、インフラ近代化を通じて需要を牽引しています。
- 最大のセグメント – ハードウェア:ハードウェアは2025年に62~66%のシェアを占め、年平均成長率(CAGR)9.2~9.6%で成長すると予測されており、これは産業用途における携帯型高精度スキャン装置への高い需要に支えられている。
- 高成長分野 – 構造化光スキャナ:構造化光スキャナは、医療、設計、リバースエンジニアリングなどの用途における高精度イメージングのニーズに牽引され、2025年には20~24%のシェアを占め、年平均成長率(CAGR)10.5~11.5%で成長すると予測されています。
- 詳細に分析された主要企業:3D Digital Corporation、3D Systems Corporation、Autodesk, Inc.、Creaform, Inc.、FARO Technologies, Inc.、GOM GmbH、Hexagon AB、Nikon Metrology NV、Trimble Navigation Ltd.、Topcon Corporation。
出典: The Insight Partnersによる独自の調査、政府刊行物、企業の年次報告書、投資家向けプレゼンテーション、業界データベース、専門家へのインタビューに基づく分析。
3Dスキャナ市場は、基本的な手動デジタル化ツールから、リアルタイムの空間データ取得が可能な高度に自動化されたAI統合型計測システムへと進化を遂げました。初期の導入は産業検査に集中していましたが、構造化光、レーザー三角測量、光学スキャン技術の進歩により、ヘルスケア画像処理や建設モデリングなど、幅広い用途に活用されるようになりました。CAD/CAMエコシステムやクラウドベースのシミュレーションプラットフォームとの統合も、導入をさらに加速させています。ポータブル型やハンドヘルド型スキャナへの移行により、アクセス性が向上し、自動車のプロトタイプ製作やインフラマッピングといった現場での応用が可能になりました。
今後の市場成長は、デジタルツインの導入、インダストリー4.0の実装、スマート製造エコシステムへの投資によって促進されると予想されます。アジア太平洋地域とラテンアメリカの新興市場は、デジタル化インフラプロジェクトを通じて需要を支えるでしょう。航空宇宙およびヘルスケア分野における品質保証規制も、導入をさらに後押しします。さらに、人工知能ベースのスキャン分析とクラウドベースのコラボレーションシステムの導入は、エンジニアリングおよび設計プロセス全体にわたる業務に革命をもたらすでしょう。
3Dスキャナー市場レポートの範囲
| レポート属性 | 詳細 |
|---|---|
| 2025年の市場規模 | 49億5000万米ドル |
| 2034年までの市場規模 | 112億1000万米ドル |
| 世界の年間平均成長率(2026年~2034年) | 9.51% |
| 履歴データ | 2021年~2024年 |
| 予測期間 | 2026年~2034年 |
3Dスキャナー市場分析
3Dスキャナー市場レポートによると、精密製造、産業検査の自動化、デジタルモデリング技術への依存度の高まりを背景に、強い需要が見込まれています。スマートファクトリーやロボット統合型生産ラインの拡大により、高精度な空間計測ツールの必要性が大幅に増加しています。このエコシステムには、ハードウェアメーカー、ソフトウェア開発者、そしてスキャン出力をCADやシミュレーション環境に統合するサービスプロバイダーが含まれます。
供給側の動向は、レーザーおよび光学スキャンシステムの技術進歩によって影響を受けており、精度向上と処理時間短縮につながっています。センサーの小型化の進展とAI駆動型分析プラットフォームとの統合により、使いやすさがさらに向上しています。医療画像処理や建設モデリングからの需要増加は、アプリケーションの適用範囲を拡大し、業界全体にわたる市場規模を強化しています。
イノベーションとエコシステム統合への注力により、競争は依然として激しい。Autodesk, Inc.はソフトウェアの改良に投資し、Hexagon ABとFARO Technologies, Inc.は産業計測ソリューションに注力している。Creaform, Inc.と3D Systems Corporationはポータブルスキャンシステムを専門とし、Nikon Metrology NVとGOM GmbHは光学高精度技術を開発している。投資動向は、引き続き提携、合併、買収によって特徴づけられている。
人工知能、スキャン分析、クラウドベースプラットフォーム開発におけるイノベーションが、主要な投資分野になりつつある。Trimble Navigation Ltd.とTopcon Corporationは建設デジタル化市場に参入し、スタートアップ企業はモバイルアプリケーション向けの革新的な光スキャン機器で市場に参入している。ハードウェアとソフトウェアのエコシステムの発展に伴い、競争上の位置づけも変化している。
● レポートのカスタマイズ
貴社の具体的なビジネス要件に合わせて、このレポートをカスタマイズしてください。
本レポートは、お客様の事業目標、事業範囲、ターゲット市場に合わせてカスタマイズ可能です。カスタマイズオプションには、顧客セグメントの絞り込み、地域別分析、競合分析、戦略的洞察などがあり、情報に基づいた意思決定を支援します。
このレポートをカスタマイズする →調整可能な項目
- ● セグメンテーション
- ● 地理
- ● 競合分析
- ● 言語設定
3Dスキャナー市場:戦略的洞察
地域別分析
北米3Dスキャナー市場
北米は、強力な産業オートメーションと高度な製造エコシステムに支えられ、2025年には世界の3Dスキャナー市場において34~38%のシェアを占め、市場を牽引すると予測されています。特に米国とカナダでは、航空宇宙および自動車工学技術の普及が進んでおり、この地域はこうした恩恵を受けています。さらに、産業オペレーションや建設モデリングにおけるデジタルツインフレームワークの統合が進んでいることも、需要を押し上げる要因となっています。
精密工学とスマートファクトリー開発への投資増加により、この地域は2026年から2034年にかけて年平均成長率(CAGR)9.2%~9.8%を達成すると予測されています。FARO Technologies, Inc.や3D Systems Corporationといった大手企業の存在は、業界のイノベーションを促進しています。防衛産業や医療画像処理分野における計測システムの応用拡大は、市場の継続的な成長を確実なものにしています。
米国3Dスキャナー市場
2025年には、米国が北米市場の82~86%を占め、国別では最大の貢献国となる見込みだ。この成長は主に、航空宇宙工学、自動車のプロトタイプ開発、AIを活用した製造システムにおけるイノベーションによって牽引されている。
2026年から2034年にかけての米国市場の成長率は、年平均成長率(CAGR)9.3%~9.9%と予測されています。Autodesk, Inc.やHexagon ABといった企業の参画は、デジタル設計および計測におけるイノベーションに大きく貢献しています。防衛産業や医療分野における高精度スキャンへの需要の高まりは、依然として大きなトレンドとなっています。
欧州3Dスキャナー市場
欧州は、優れた自動車工学および工業デザイン産業のおかげで、2025年までに25~29%のシェアを占めると予想されている。欧州は8.8~9.3%の成長が見込まれ、ドイツ、フランス、英国、イタリア、スペインが成長を牽引する。ドイツは、その製造能力と自動車イノベーションセンターのおかげで、引き続き優位な地位を維持している。
英国では建設や文化遺産のモデリングにこの技術が広く活用されている一方、ドイツでは自動車のプロトタイプ製作や産業計測に広く利用されている。フランスとイタリアは航空宇宙産業と高級品製造に力を注いでいる。スペインはインフラ整備やスマートシティ構想の推進にこの技術を活用し、地域全体の需要を高めている。
アジア太平洋地域の3Dスキャナー市場
アジア太平洋地域は2025年までに市場全体の28~32%を占め、年平均成長率(CAGR)は10.2~10.8%と、最も急速に成長する地域となる見込みだ。中国は大規模な製造業を背景に市場をリードしており、それに続くのが、電子機器およびロボット産業が高度に発達している日本と韓国である。
インドとオーストラリアの両国において、インフラ開発と鉱業の分野でこの技術の利用が拡大している。産業オートメーションとデジタル変革に関する多くの政府政策が、これらの技術の導入を後押ししている。製造業と輸出生産モデルは、地域における優位性をさらに強化している。
中東・アフリカの3Dスキャナー市場
中東・アフリカ地域は2025年には5~7%のシェアを占め、年平均成長率(CAGR)は8.5~9.0%となる見込みです。サウジアラビアとアラブ首長国連邦は、スマートシティ開発とインフラ近代化プログラムにより、この分野を牽引しています。南アフリカでは、鉱業および産業検査において、徐々に導入が進んでいます。
中東・アフリカ地域のその他の地域は、建設およびエネルギー分野のデジタル化に支えられ、着実な成長を遂げています。石油・ガスインフラのモデリングや都市開発プロジェクトへの投資増加が、長期的な導入を促進しています。サウジアラビアは、大規模なビジョン主導の変革プロジェクトにより、この地域における主導的な地位を維持しています。
セグメンテーション分析
提供
提供製品セグメントは、物理デバイスと分析プラットフォームを組み合わせた統合スキャンエコシステムへの需要に牽引され、市場の基盤となる柱となっています。ハードウェアは産業検査やリバースエンジニアリングにおける幅広い利用により主流を占めていますが、ソフトウェアはクラウドベースの処理ツールやシミュレーションツールを通じて急速に普及が進んでいます。スキャンデバイスとAI駆動型分析の融合が進むにつれ、製造業やヘルスケア分野における業務効率が向上しています。
- ハードウェア:高精度な空間データ取得を必要とする精密工学、計測学、自動車プロトタイプ製作などの分野で広く採用されており、産業用途において圧倒的なシェアを誇っています。
- ソフトウェア:クラウドベースの処理、CAD統合、AIを活用した可視化ツールの需要により、ワークフローの効率化とコラボレーションの向上を目指し、急速に拡大している。
タイプ
タイプ別セグメンテーションは、スキャンシステムにおける技術的多様性を反映しており、コスト効率と汎用性の高さから光学スキャナーが主流となっています。レーザースキャナーは、高精度かつ長距離測定が求められる産業環境で広く使用されています。構造化光スキャナーは、優れた表面ディテールの取得と精度向上により、医療や設計分野で注目を集めています。
- 光学スキャナー:手頃な価格と多様なスキャン環境への適応性の高さから、産業および商業用途で幅広く使用されています。
- レーザースキャナー:長距離測定と高い構造精度が求められる高精度な産業用途で好まれる。
- 構造化光スキャナ:高解像度の表面マッピング機能により、医療、設計、リバースエンジニアリングの分野で採用が拡大している。
範囲
範囲ベースのセグメンテーションは、様々な業界におけるアプリケーションの適合性を判断する上で重要な役割を果たします。短距離スキャナーは、制御された環境下での精度の高さから主流となっていますが、中距離システムは多様な産業用途に対応しています。一方、長距離スキャナーは、地理空間モデリングの要件拡大に伴い、建設およびインフラマッピングの分野で勢いを増しています。
- 短距離:実験室、医療、製品設計などの用途で、近距離での極めて高い精度が求められる場合によく使用されます。
- 中距離:適度な距離でのスキャン柔軟性を必要とする産業検査および製造環境において、バランスよく使用されます。
- 長距離:大規模な空間データ収集が不可欠な建設およびインフラストラクチャのモデリングで使用されます。
エンドユーザー
エンドユーザー別の分析では、製造業における強力な導入に支えられた産業界の優位性が際立っています。自動車および航空宇宙分野は、精密工学の要求により、引き続き主要な貢献分野となっています。ヘルスケア分野は、画像処理技術の革新に牽引され、高成長分野として台頭しており、建築および建設分野は、BIM統合とデジタルツインの導入を通じて拡大を続けています。
- 産業分野:製造エコシステム全体にわたる自動化、品質管理、リバースエンジニアリングの応用によって、最大の貢献分野となっている。
- 航空宇宙・防衛分野:部品製造および構造検査における厳格な精度要件のため、高い採用率を誇る。
- 自動車分野:プロトタイピング、設計検証、生産最適化プロセスにおいて幅広く活用されています。
- 建築・建設分野:BIM統合とインフラのデジタル化による導入促進。
- 医療分野:医用画像処理、義肢設計、手術計画などの用途で急速に拡大している。
- その他:教育、研究、および専門的な工学応用を含む。
機会の概要
|
セグメント名 |
収益貢献 |
トレンドタグ |
導入段階 |
|
工業 |
高い |
スマートファクトリー |
成熟した |
|
航空宇宙・防衛 |
中くらい |
精密工学 |
スケーリング |
|
自動車 |
中くらい |
デジタルプロトタイピング |
成熟した |
|
建築・建設 |
中くらい |
BIM統合 |
スケーリング |
|
健康管理 |
高い |
医用画像処理 |
新興 |
|
その他 |
低い |
研究開発部門の拡大 |
新興 |
3Dスキャナー市場の成長要因と影響分析
精密製造自動化に対する需要の高まり
様々な産業における自動化の普及拡大は、3Dスキャナー市場の成長を牽引する大きな要因となっています。自動車、航空宇宙、重機などの産業では、欠陥を減らすために高精度な検査システムが求められています。3Dスキャナーの活用は品質管理に役立ち、手動測定システムへの依存度を低減します。ロボットや人工知能(AI)ベースの検査機器との併用は、生産ラインの効率向上にも貢献します。インテリジェントファクトリーへの移行に伴い、北米、ヨーロッパ、アジア太平洋地域全体で高度なスキャンシステムへの需要が高まることが予想されます。
デジタルツインとシミュレーションのエコシステムの拡大
デジタルツイン技術の産業分野における活用拡大に伴い、3Dスキャナー技術の導入も加速しています。これらの技術は、実物のリアルタイムレプリカを作成するために、正確な空間情報を必要とします。建設、エネルギー、運輸など、さまざまな産業で、予測保全や設計最適化の向上を目的として、スキャン技術の採用が進んでいます。CADやシミュレーションとの統合により、ライフサイクル全体を通して可視性が向上し、コスト削減につながります。3Dスキャナー市場の動向は、特にスマートシティの構築や工業化が進む新興国で顕著に見られます。
医療画像処理および生物医学工学分野の成長
医療分野における3Dスキャン技術の利用は、補綴・矯正歯科設計や手術計画における活用拡大に伴い、著しい成長傾向を示しています。高解像度イメージングの活用は、個別化医療の実現に貢献するとともに、診断プロセスの改善にもつながります。構造化光スキャナーや光学スキャナーは、非侵襲的なイメージングのために病院や研究機関で採用されています。生物医学工学や医療機器への投資拡大が、3Dスキャン技術の普及を後押ししています。精密診断や患者個々のニーズに合わせたソリューションに対する規制当局の注目も需要をさらに高め、医療分野は世界で最も急速に成長しているアプリケーション分野の一つとなっています。
3Dスキャナー市場の将来動向
AI統合型リアルタイムスキャンシステム
3Dスキャンシステムに人工知能(AI)が組み込まれることで、データ収集と処理方法が変化しています。AIを搭載したスキャナーは、歪みを補正し、解像度を高め、最適化された3Dモデルをリアルタイムで作成できます。これにより、後処理時間が短縮され、業界全体のワークフロー効率が向上します。現在、企業はスキャナーに機械学習技術を導入し、欠陥を自動的に分析して結果を予測しています。これは、精度とスピードが極めて重要な自動車産業や航空宇宙産業における品質管理プロセスを根本的に変革するでしょう。
スキャン装置の小型化と携帯性
新たなトレンドの一つとして、小型で持ち運び可能なハンドヘルド型3Dスキャニングデバイスへの移行が挙げられます。この動きにより、建設、考古学、インフラ検査といった分野での応用が可能になります。軽量で無線およびクラウド機能を備えたスキャニングマシンの登場により、業界の枠を超えて利用範囲を拡大することが容易になりました。さらに、モビリティへのニーズの高まりに伴い、バッテリー性能とセンサーサイズの改良が不可欠となっています。現場作業のデジタル化が進むにつれ、ポータブルスキャニング技術は新興市場において大きな変革をもたらす可能性を秘めています。
3Dスキャナー市場の機会
新興インフラ市場における事業拡大
新興国における急速な都市化とインフラ開発は、3Dスキャナー市場にとって大きなビジネスチャンスとなっています。アジア太平洋地域、ラテンアメリカ、中東諸国は、スマートシティ、交通網、工業地帯への投資を積極的に行っています。3Dスキャン技術は、建設計画、構造モニタリング、地理空間マッピングにおいてますます活用されるようになっています。これにより、コスト効率が高く拡張性の高いスキャンソリューションへの強い需要が生まれています。クラウドプラットフォームと統合されたポータブルで高精度なデバイスを提供する企業は、急速に拡大する3Dスキャナー市場の成長を捉える上で有利な立場にあります。
産業用IoTおよびクラウドエコシステムとの統合
3Dスキャン技術の登場は、産業用IoTやクラウドコンピューティングと相まって、リアルタイムデータ分析とリモートコラボレーションに新たな可能性をもたらします。ネットワーク接続されたスキャンデバイスは、エンジニアリングチーム間のスムーズなデータ交換を促進し、設計精度と効率性を向上させます。さらに、クラウド技術は、膨大な空間データセットの一元的な保存と処理を容易にします。この組み合わせは、分散したチーム間の連携が求められる複雑なグローバル製造施設において特に有効です。
最近の動向
- 2026年5月:FARO CREAFORMは、同社のハンディ型3Dスキャナー「HandySCAN 3D EVOシリーズ」がレッドドット・デザイン賞を受賞したことを発表しました。これは、リアルタイムの視覚化とオペレーターの効率向上を実現した、人間工学に基づいた現場ですぐに使用できる計測ツールの重要性を改めて示すものです。
- 2025年10月:ヘキサゴンの製造インテリジェンス部門は、プロ仕様のスキャンをエントリーレベルのユーザーでも利用できるように設計された軽量ハンドヘルド3Dレーザースキャナー「ATLASCAN Pro」を発表しました。このスキャナーは、ワイヤレス操作、スキャンからCADへのワークフローサポート、および検査機能を備えています。
- 2025年7月:AMETEKはFARO Technologiesの買収を完了し、FAROをCreaformおよびVirtekとともにAMETEKの超精密技術部門に統合することで、携帯型および自動化された3D計測、レーザー投影、デジタルリアリティソリューションを強化しました。
よくある質問

Naveenは、カスタム、シンジケート、コンサルティングの各プロジェクトにおいて9年以上の実績を持つ、経験豊富な市場調査およびコンサルティングのプロフェッショナルです。現在はアソシエイトバイスプレジデントを務め、プロジェクトバリューチェーン全体にわたるステークホルダー管理を成功させ、100件以上の調査レポートと30件以上のコンサルティング案件を執筆しています。産業および政府機関のプロジェクトに幅広く携わり、クライアントの成功とデータに基づく意思決定に大きく貢献しています。
Naveenは、カルナータカ州VTUで電子通信工学の学位を取得し、マニパル大学でマーケティング&オペレーションズのMBAを取得しています。IEEEの会員として9年間活動し、会議や技術シンポジウムへの参加、セクションレベルおよび地域レベルでのボランティア活動に積極的に取り組んでいます。現職以前は、IndustryARCでアソシエイト戦略コンサルタント、Hewlett Packard(HP Global)で産業用サーバーコンサルタントを務めていました。
- 包括的な市場規模および予測分析
- 詳細なセグメンテーション分析
- 市場動向(ダイナミクス)の徹底的な評価
- 地域および国別のインサイト
- 競争環境および企業ベンチマーク
- 戦略的ビジネスインテリジェンス
お客様の声
Insight PartnersのSCADAシステム市場レポートは包括的で、現在のトレンドと将来の予測に関する貴重な洞察が含まれています。チームは終始、非常にプロフェッショナルで、対応が早く、サポートも充実していました。私たちは彼らのサービスに非常に満足しており、強くお勧めします。
ラン・ケデム パートナー, レアリテクノロジーズ株式会社非常に特殊なソフトウェア市場に関するレポートを依頼したところ、チームは数日でレポートを作成してくれました。情報は非常に関連性が高く、分かりやすくまとめられていました。その後、レポートにいくつか修正と追加を依頼しましたが、チームは非常に迅速に対応し、1週間も経たないうちに最終レポートを受け取ることができました。
ジャン=エルヴェ・ジェン 会長, フューチャー・アナリティカ重要な市場調査と予測のために、The Insight Partnersと協力しました。彼らは機会とリスクに関する明確な洞察を提供し、私たちの計画策定に役立ちました。彼らの調査は使いやすく、確かなデータに基づいており、賢明で自信に満ちた意思決定に役立ちました。彼らを強くお勧めします。
ピユーシュ・ナグパル 上級副社長, ハイビームグローバルInsight Partnersは、深い専門知識に基づき、洞察力に富み、構造化された市場調査を提供しました。チームは終始プロフェッショナルで、対応力も抜群でした。ユーザーフレンドリーなウェブサイトにより、業界レポートへのアクセスもスムーズでした。信頼性の高い高品質な調査サービスをお探しなら、Insight Partnersを強くお勧めします。
安達幸彦 最高経営責任者(CEO), ディープブルーLLC。The Insight Partnersから市場レポートを購入するのは今回が初めてです。最初は不安でしたが、ウェブサイトを見て、リスクを負ってでも購入してみようという気持ちになりました。レポートの品質とカスタマーサービスには大変満足しています。最初のレポートにはいくつか質問やコメントがありましたが、アナリストとメールで何度かやり取りした結果、戦略策定プロセスへのインプットとして活用できるレポートが完成しました。貴重なお時間を割いていただき、貴重な体験をさせていただき、誠にありがとうございました。他の方にもぜひお勧めしたいですし、今後さらに市場データが必要になった際には、まずThe Insight Partnersにご連絡させていただきます。
ジョン・スズキ 社長兼最高経営責任者、取締役, BKテクノロジーズナイジェリアの感染症IVD市場に関する情報提供依頼に対し、ご対応いただいた際、ご尽力とプロフェッショナルな姿勢に深く感謝申し上げます。忍耐強く、的確なアドバイスをいただき、また、最終的に取引成立に至った割引のご提供にも深く感謝申し上げます。今回の最初の出会いで得た強い印象のおかげで、今後もThe Insight Partnersとの連携を心待ちにしております。
チジオケ博士 オニア マネージングディレクター, パインクレストヘルスケア株式会社購入理由
- 情報に基づいた意思決定
- 市場動向の理解
- 競合分析
- 顧客インサイト
- 市場予測
- リスク軽減
- 戦略計画
- 投資の正当性
- 新興市場の特定
- マーケティング戦略の強化
- 業務効率の向上
- 規制動向への対応


