
エネルギーおよびユーティリティ分析市場レポート 2025 - セグメント、地域、動向、最近の動向、戦略的洞察別
2027年までのエネルギーおよび公益事業分析市場予測 - COVID-19の影響とタイプ別(ソフトウェアおよびサービス)、導入モデル別(オンプレミス、クラウドおよびハイブリッド)、アプリケーション別(負荷予測、顧客分析、グリッド分析、資産管理、スマートメーター分析、その他)、業種別(石油・ガス、再生可能エネルギー、原子力、電力、水道、その他)のグローバル分析
- ステータス : 出版
- レポートコード : TIPTE100000310
- カテゴリー : テクノロジー、メディア、通信
- ページ数 : 224
- 利用可能なレポート形式 :


- 最終更新日 : June 12, 2024

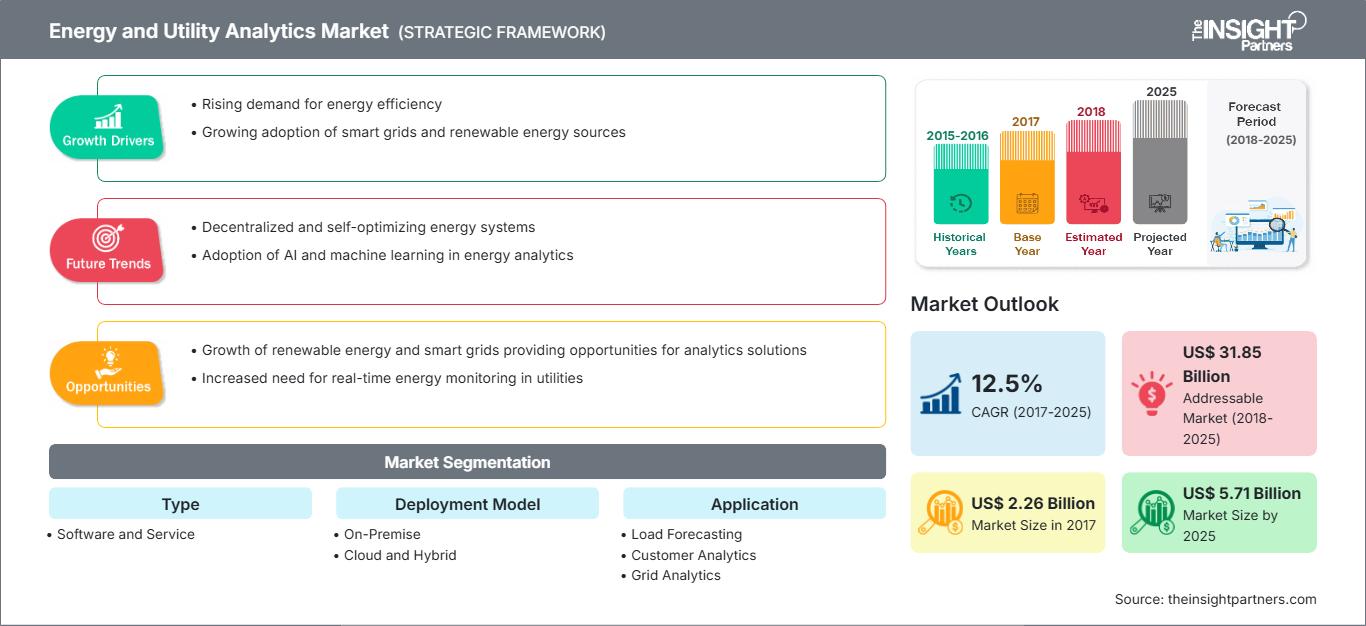
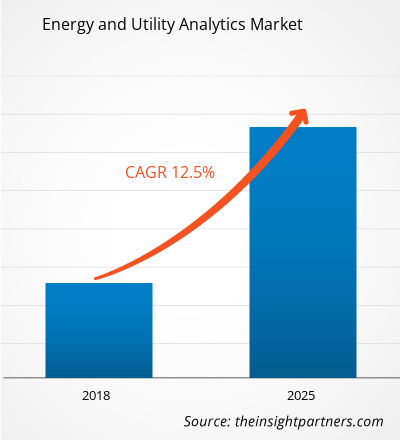
エネルギーおよび公益事業分析市場は、2017年に22億6,000万米ドルに達し、2017年から2025年の予測期間中に年平均成長率(CAGR)12.5%で成長し、2025年には57億1,330万米ドルに達すると予想されています。
スマートメーター、スマートセンサー、IoTベースの技術の急速な普及により、エネルギーおよび公益事業業界は、特にデータ生成の面で大きな変革を経験しました。この変革により、公益事業グリッド、油井、発電所、エネルギー生産部門で生成されるデータに対する分析ソリューションの実装がさらに促進されました。これらの分析ソリューションの助けにより、分散型電源は、運用上の意思決定に使用できる有意義な洞察を導き出す能力を獲得しました。さらに、エネルギーおよび公益事業業界におけるアナリティクスは、リアルタイムの需要と供給のギャップ、資産の活用状況、ダウンタイムに関するこれまでにない知識を提供します。
アナリティクスにより、エネルギーおよび公益事業業界はインテリジェントネットワークの潜在能力を最大限に引き出し、設備投資の全体的なROIを向上させることができるため、スマートデバイスの広範な採用と実装が、世界中のエネルギーおよび公益事業業界におけるアナリティクスの需要を促進すると予想されています。
さらに、アナリティクスは、メーター、センサー、SCADAなどの情報資産からの膨大な量のデータを実用的な洞察に変換する上で重要な役割を果たし、特にサービス品質、停止管理、予防保守活動の分析において、重要な意思決定の予測と指示を容易にします。したがって、アナリティクスによって提供される無数の利点は、今後数年間、エネルギーおよび公益事業アナリティクス市場を飛躍的に成長させると予想されます。
市場インサイト
要件に合わせてレポートをカスタマイズ
レポートの一部、国レベルの分析、Excelデータパックなどを含め、スタートアップ&大学向けに特別オファーや割引もご利用いただけます(無償)
エネルギーおよびユーティリティ分析市場: 戦略的洞察
-
このレポートの主要な市場動向を入手してください。この無料サンプルには、市場動向から見積もりや予測に至るまでのデータ分析が含まれます。
これまで、エネルギーおよび公益事業セクターの主要産業におけるセキュリティ上の脅威が根強く、企業はデータ共有に消極的でした。特に石油・ガス業界は、運用データの損失が競争上の優位性を損なう可能性があり、将来の成長を阻害する可能性があるため、データ共有に対して最も制限的でした。
しかし、テクノロジー企業がセキュリティリスクを軽減するための基準を引き上げるにつれて、エネルギーおよび公益事業組織はデータ共有がもたらす無数のメリットを実現すると予測されています。これらのメリットの一部には、機器プロバイダーが監視機能を獲得することが含まれており、これにより機器プロバイダーはメンテナンスの問題をリアルタイムで評価できるようになります。さらに、データ共有は、エネルギー・公益事業業界が機器の購入からリース投資へと転換することを可能にする、機器をサービスとして提供するというトレンドの基盤としても機能するでしょう。
データ共有の出現は、堅牢な需要応答ネットワーク、サプライチェーンの最適化、その他スマートシティの成長に大きく貢献するプログラムといった分析ソリューションの導入機会も生み出すでしょう。データ共有は現在、世界の一部の先進国に限定されていますが、近い将来、このトレンドは加速すると予想されています。この情報の自由な流れは、より効率的な意思決定のための分析機能への需要をさらに加速させるでしょう。
Type Market Insights
スマート革命は、世界中のエネルギー・公益事業企業の業務の複雑さを増大させています。さらに、データの量、多様性、そして複雑さは飛躍的に増加しています。競争の激化と規制の厳しい環境の中、エネルギー・公益事業業界で事業を展開する企業は、市場で効率的に競争するために分析機能を導入しています。エネルギーおよびユーティリティ分析市場のタイプセグメントは、ソリューションとサービスに分類されます。
サービス市場インサイト
エネルギーおよびユーティリティ分析のサービスセグメントは、マネージドサービスとプロフェッショナルサービスに分かれています。急速な技術進歩により、IT環境の複雑さを理解し、エネルギーおよびユーティリティ企業のビジネス目標とテクノロジーを同期させる必要性が高まっています。製品ライフサイクルのさまざまな部門、機能、段階に対応する複数のITシステムを統合することは、今日の組織が成長過程において直面する重要な課題となっています。そのため、組織は競争優位性を獲得するために、テクノロジー主導のビジネスモデルの実装を模索しています。
導入モデル市場インサイト
世界のエネルギーおよびユーティリティ分析市場は、導入タイプに基づいてオンプレミス、クラウド、ハイブリッドに分類されます。現状では、エネルギーおよびユーティリティ企業による分析ソリューションのニーズが高まっています。しかしながら、サイバー犯罪の脅威は、分析ソフトウェアを導入する企業にとって常に課題となっています。したがって、多くの企業は、データを保護し、データを手の届く範囲に保つために、オンプレミス導入モデルを選択しています。
アプリケーション市場インサイト
世界のエネルギーおよびユーティリティ市場は、アプリケーション別に、負荷予測、顧客分析、グリッド分析、資産管理、スマートメーター分析、その他にさらに細分化されています。電力需要予測は、エネルギーおよび電力部門における設備拡張と定期運用の戦略策定に不可欠かつ中心的なプロセスです。また、エネルギー市場間の規制緩和により、さまざまなセクターの需要パターンが非常に複雑になっているため、特定の電力ネットワークに適した予測モデルを選択することは、エネルギーおよびユーティリティ業界にとって比較的困難な作業になっています。市場にはさまざまな予測方法がありますが、すべての需要パターンに一般化できるものは一つもありません。
垂直市場インサイト
世界のエネルギーおよびユーティリティ分析市場の業種垂直セグメントは、石油およびガス、原子力、再生可能エネルギー、ユーティリティ、その他に細分化されています。石油およびガス業界は様々な面でリスク管理を模索し続けており、ガス会社は分析ソリューションを積極的に導入しています。さらに、採掘・掘削コストの上昇も、石油・ガス業界で事業を展開する企業にとって課題となることが予想されます。そのため、企業は貯留層特性評価、生産予測、掘削最適化、貯留層特性評価の複雑性改善など、様々なメリットをもたらす分析ツールを導入しています。さらに、再生可能エネルギー生産に向けた政府の取り組みにより、再生可能エネルギー設備も世界的に大幅な成長が見込まれています。
エンタープライズコンテンツ管理市場で事業を展開する企業は、市場での地位を維持するために、合併、買収、市場開拓などの戦略に重点を置いています。主要企業による開発動向は以下のとおりです。
- 2018年4月、BuildingIQは生産性向上と省エネに向けた取り組みの一環として、Cypress Envirosystemsと提携しました。BuildingIQは、自社の予測最適化技術と、Cypressが提供するEnvirosystemsの高度なサーモスタットを統合する予定です。この提携は、古い建物にAIを活用したソリューションを提供し、システムに関するより深い洞察を提供することを目指しています。また、古い建物の電力消費量を30%削減することも可能になります。
- 2018年2月、EnergySavvyとスノホミッシュ郡公益事業局(PUD)は、顧客が自宅のエネルギーを節約できるオンライン評価ツールであるPUDの新しいホームエネルギープロファイルを導入しました。
エネルギーおよびユーティリティ分析市場の地域別分析
The Insight Partnersのアナリストは、予測期間を通じてエネルギー・公益事業分析市場に影響を与える地域的な傾向と要因を詳細に解説しています。このセクションでは、北米、ヨーロッパ、アジア太平洋、中東・アフリカ、中南米におけるエネルギー・公益事業分析市場のセグメントと地域についても解説しています。
エネルギーおよびユーティリティ分析市場レポートの範囲
| レポート属性 | 詳細 |
|---|---|
| の市場規模 2017 | US$ 2.26 Billion |
| 市場規模別 2025 | US$ 5.71 Billion |
| 世界的なCAGR (2017 - 2025) | 12.5% |
| 過去データ | 2015-2016 |
| 予測期間 | 2018-2025 |
| 対象セグメント |
By タイプ
|
| 対象地域と国 |
北米
|
| 市場リーダーと主要企業の概要 |
|
エネルギーおよびユーティリティ分析市場のプレーヤー密度:ビジネスダイナミクスへの影響を理解する
エネルギー・公益事業分析市場は、消費者の嗜好の変化、技術の進歩、製品メリットへの認知度の向上といった要因によるエンドユーザーの需要増加に牽引され、急速に成長しています。需要の増加に伴い、企業は提供内容の拡充、消費者ニーズへの対応のためのイノベーション、そして新たなトレンドの活用を進めており、これが市場の成長をさらに加速させています。
- 入手 エネルギーおよびユーティリティ分析市場 主要プレーヤーの概要
- ソリューション
- サービス
エネルギーおよびユーティリティ分析市場 – サービス
- プロフェッショナル サービス
- マネージド サービス
エネルギーおよびユーティリティ分析市場 – 導入モデル
- オンプレミス
- クラウド
- ハイブリッド
エネルギーおよびユーティリティ分析市場 – アプリケーション
- 負荷予測
- 顧客分析
- グリッド分析
- 資産管理
- スマート メーター分析
- その他
エネルギーおよびユーティリティ分析市場 –垂直別
- 石油・ガス
- 再生可能エネルギー
- 原子力
- 電力
- 水道
- その他
エネルギー・公益事業分析市場 –地域別
-
北米
- 米国
- カナダ
- メキシコ
-
ヨーロッパ
- フランス
- ドイツ
- イタリア
- スペイン
- 英国
- その他ヨーロッパ
-
アジア太平洋 (APAC)
- オーストラリア
- 中国
- インド
- 日本
- その他 APAC
-
中東 &アフリカ (MEA)
- サウジアラビア
- UAE
- 南アフリカ
- MEA の残りの部分
-
南アメリカ (SAM)
- ブラジル
- MEA の残りの部分SAM
会社
- International Business Machines Corporation
- Oracle Corporation
- BuildingIQ, Inc.
- Capgemini SE
- EnergySavvy Inc.
- Infosys Limited
- SAP SE
- SAS Institute Inc.
- WegoWise, Inc.
- Wipro Limited

アンキタは、テクノロジー、メディア、ICT、エレクトロニクス・半導体の各分野で8年以上の経験を持つ、ダイナミックな市場調査およびコンサルティングのプロフェッショナルです。Microsoft、Oracle、NEC、SAP、KPMG、Expeditors Internationalといったグローバルクライアントに対し、100件以上のコンサルティングおよび調査案件を主導・遂行してきました。彼女のコアコンピテンシーは、市場評価、データ分析、予測、戦略策定、競合情報、レポート作成です。
アンキタは、販売前の提案書作成やクライアントとの協議から、販売後の実用的なインサイトの提供まで、プロジェクトサイクル全体を巧みに管理することに長けています。彼女は、部門横断的なチームの管理、複雑な調査モジュールの構築、そしてクライアント固有のビジネス目標に合わせたソリューションの調整に長けています。優れたコミュニケーション能力、リーダーシップ、そしてプレゼンテーション能力により、急速に変化する市場環境において、常に価値主導の成果を生み出しています。
- 包括的な市場規模および予測分析
- 詳細なセグメンテーション分析
- 市場動向(ダイナミクス)の徹底的な評価
- 地域および国別のインサイト
- 競争環境および企業ベンチマーク
- 戦略的ビジネスインテリジェンス
お客様の声
Insight PartnersのSCADAシステム市場レポートは包括的で、現在のトレンドと将来の予測に関する貴重な洞察が含まれています。チームは終始、非常にプロフェッショナルで、対応が早く、サポートも充実していました。私たちは彼らのサービスに非常に満足しており、強くお勧めします。
ラン・ケデム パートナー, レアリテクノロジーズ株式会社非常に特殊なソフトウェア市場に関するレポートを依頼したところ、チームは数日でレポートを作成してくれました。情報は非常に関連性が高く、分かりやすくまとめられていました。その後、レポートにいくつか修正と追加を依頼しましたが、チームは非常に迅速に対応し、1週間も経たないうちに最終レポートを受け取ることができました。
ジャン=エルヴェ・ジェン 会長, フューチャー・アナリティカ重要な市場調査と予測のために、The Insight Partnersと協力しました。彼らは機会とリスクに関する明確な洞察を提供し、私たちの計画策定に役立ちました。彼らの調査は使いやすく、確かなデータに基づいており、賢明で自信に満ちた意思決定に役立ちました。彼らを強くお勧めします。
ピユーシュ・ナグパル 上級副社長, ハイビームグローバルInsight Partnersは、深い専門知識に基づき、洞察力に富み、構造化された市場調査を提供しました。チームは終始プロフェッショナルで、対応力も抜群でした。ユーザーフレンドリーなウェブサイトにより、業界レポートへのアクセスもスムーズでした。信頼性の高い高品質な調査サービスをお探しなら、Insight Partnersを強くお勧めします。
安達幸彦 最高経営責任者(CEO), ディープブルーLLC。The Insight Partnersから市場レポートを購入するのは今回が初めてです。最初は不安でしたが、ウェブサイトを見て、リスクを負ってでも購入してみようという気持ちになりました。レポートの品質とカスタマーサービスには大変満足しています。最初のレポートにはいくつか質問やコメントがありましたが、アナリストとメールで何度かやり取りした結果、戦略策定プロセスへのインプットとして活用できるレポートが完成しました。貴重なお時間を割いていただき、貴重な体験をさせていただき、誠にありがとうございました。他の方にもぜひお勧めしたいですし、今後さらに市場データが必要になった際には、まずThe Insight Partnersにご連絡させていただきます。
ジョン・スズキ 社長兼最高経営責任者、取締役, BKテクノロジーズナイジェリアの感染症IVD市場に関する情報提供依頼に対し、ご対応いただいた際、ご尽力とプロフェッショナルな姿勢に深く感謝申し上げます。忍耐強く、的確なアドバイスをいただき、また、最終的に取引成立に至った割引のご提供にも深く感謝申し上げます。今回の最初の出会いで得た強い印象のおかげで、今後もThe Insight Partnersとの連携を心待ちにしております。
チジオケ博士 オニア マネージングディレクター, パインクレストヘルスケア株式会社購入理由
- 情報に基づいた意思決定
- 市場動向の理解
- 競合分析
- 顧客インサイト
- 市場予測
- リスク軽減
- 戦略計画
- 投資の正当性
- 新興市場の特定
- マーケティング戦略の強化
- 業務効率の向上
- 規制動向への対応


