
Marktbericht zur Energie- und Versorgungsanalyse 2025 nach Segmenten, Geografie, Dynamik, jüngsten Entwicklungen und strategischen Erkenntnissen
Marktprognose für Energie- und Versorgungsanalysen bis 2027 – Auswirkungen von COVID-19 und globale Analyse nach Typ (Software und Service), nach Bereitstellungsmodell (On-Premise, Cloud und Hybrid), nach Anwendung (Lastprognose, Kundenanalyse, Netzanalyse, Anlagenverwaltung, Smart Meter Analytics, Sonstiges) und nach Branchen (Öl und Gas, erneuerbare Energien, Kernkraft, Elektrizität und Wasser, Sonstiges)
- Status : Veröffentlicht
- Berichtscode : TIPTE100000310
- Kategorie : Technologie, Medien und Telekommunikation
- Anzahl der Seiten : 224
- Verfügbare Berichtsformate :


- Datum der letzten Aktualisierung : June 12, 2024

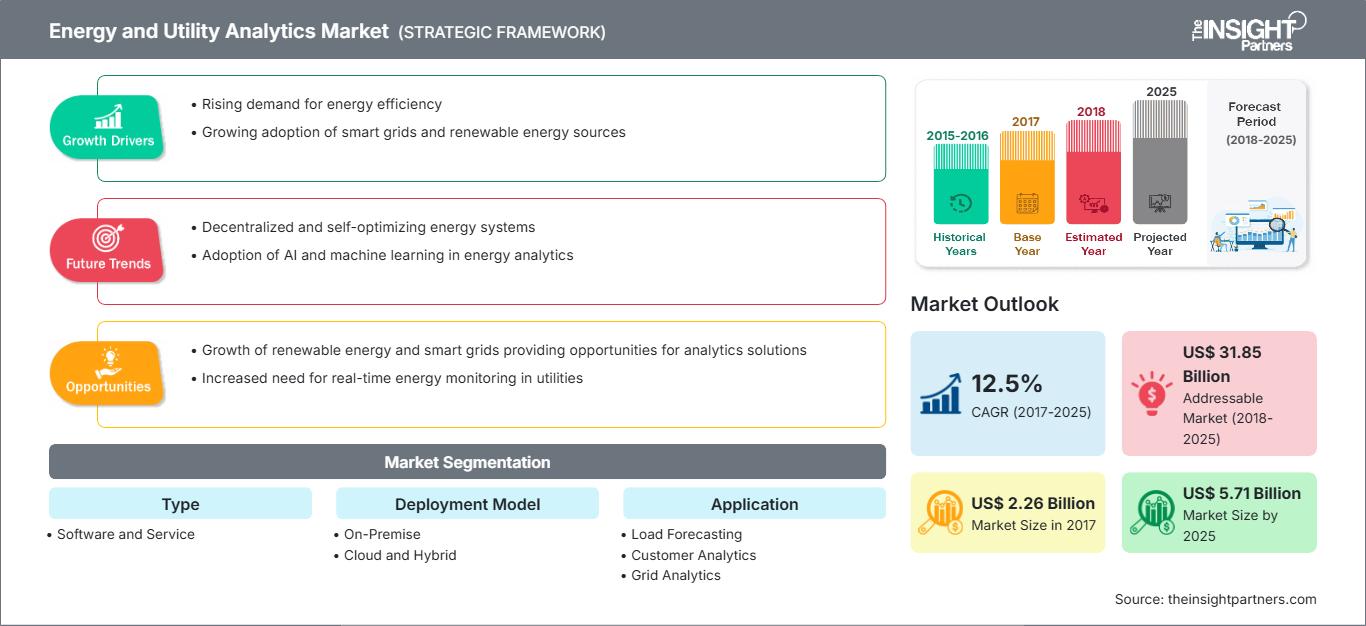
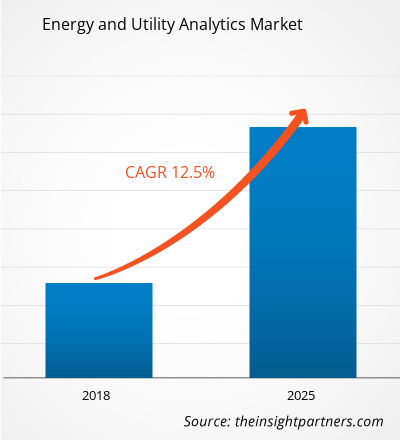
Der Markt für Energie- und Versorgungsanalysen belief sich 2017 auf 2.260,0 Mio. USD und wird im Prognosezeitraum 2017–2025 voraussichtlich mit einer durchschnittlichen jährlichen Wachstumsrate (CAGR) von 12,5 % wachsen und im Jahr 2025 5.713,3 Mio. USD erreichen.
Aufgrund der zunehmenden Verbreitung intelligenter Zähler, intelligenter Sensoren und IoT-basierter Technologien hat die Energie- und Versorgungsbranche einen tiefgreifenden Wandel erlebt, insbesondere im Hinblick auf die Datengenerierung. Dieser Wandel hat die Implementierung analytischer Lösungen für die von Versorgungsnetzen, Ölquellen, Kraftwerken und der Energieerzeugung generierten Daten weiter vorangetrieben. Mithilfe dieser analytischen Lösungen sind die dezentralen Stromerzeuger in der Lage, aussagekräftige Erkenntnisse zu gewinnen, die für betriebliche Entscheidungen genutzt werden können. Darüber hinaus liefert die Analytik in der Energie- und Versorgungsbranche beispiellose Erkenntnisse über Echtzeit-Nachfrage- und Angebotslücken, Anlagenauslastung und Ausfallzeiten.
Da Analytik es der Energie- und Versorgungsbranche ermöglicht, das volle Potenzial ihrer intelligenten Netzwerke auszuschöpfen und den Gesamt-ROI ihrer Kapitalinvestitionen zu verbessern, wird erwartet, dass die flächendeckende Einführung und Implementierung intelligenter Geräte die Nachfrage nach Analytik in der globalen Energie- und Versorgungsbranche ankurbeln wird.
Darüber hinaus spielt die Analytik eine entscheidende Rolle bei der Umwandlung enormer Datenmengen aus Informationsressourcen wie Zählern, Sensoren und SCADA in umsetzbare Erkenntnisse. Dies erleichtert die Vorhersage und Festlegung kritischer Entscheidungen, insbesondere für die Analyse der Servicequalität, das Ausfallmanagement und vorbeugende Wartungsmaßnahmen. Die unzähligen Vorteile der Analytik werden daher voraussichtlich den Markt für Energie- und Versorgungsanalytik in den kommenden Jahren exponentiell vorantreiben.
Markteinblicke
Passen Sie diesen Bericht Ihren Anforderungen an
Sie erhalten kostenlos Anpassungen an jedem Bericht, einschließlich Teilen dieses Berichts oder einer Analyse auf Länderebene, eines Excel-Datenpakets sowie tolle Angebote und Rabatte für Start-ups und Universitäten.
Markt für Energie- und Versorgungsanalysen: Strategische Einblicke
-
Holen Sie sich die wichtigsten Markttrends aus diesem Bericht.Dieses KOSTENLOSE Beispiel umfasst Datenanalysen, die von Markttrends bis hin zu Schätzungen und Prognosen reichen.
Bislang sträubten sich Unternehmen aufgrund anhaltender Sicherheitsbedrohungen in den wichtigsten Branchen des Energie- und Versorgungssektors gegen den Datenaustausch. Insbesondere die Öl- und Gasindustrie war beim Datenaustausch äußerst restriktiv, da der Verlust von Betriebsdaten ihren Wettbewerbsvorteil beeinträchtigen und so ihr zukünftiges Wachstum behindern könnte.
Da Technologieunternehmen jedoch ihre Standards zur Minimierung von Sicherheitsrisiken erhöhen, werden Energie- und Versorgungsunternehmen voraussichtlich die unzähligen Vorteile des Datenaustauschs nutzen. Zu diesen Vorteilen gehören die Überwachungsmöglichkeiten für Geräteanbieter, die es diesen ermöglichen, Wartungsprobleme in Echtzeit zu bewerten. Darüber hinaus bildet der Datenaustausch die Grundlage für den Trend zu „Equipment as a Service“, der es der Energie- und Versorgungsbranche ermöglicht, vom Kauf auf Leasing umzusteigen.
Der zunehmende Datenaustausch wird auch Anwendungsmöglichkeiten für analytische Lösungen wie robuste Demand-Response-Netzwerke, Lieferkettenoptimierung und andere Programme schaffen, die maßgeblich zum Wachstum von Smart Cities beitragen. Obwohl der Datenaustausch derzeit nur auf bestimmte entwickelte Volkswirtschaften der Welt beschränkt ist, wird erwartet, dass sich dieser Trend in naher Zukunft verstärkt. Dieser freie Informationsfluss wird die Nachfrage nach Analysefunktionen für effizientere Entscheidungsfindung weiter beschleunigen.
Markteinblicke in verschiedene Typen
Die Smart-Revolution hat zu einer zunehmenden operativen Komplexität von Energie- und Versorgungsunternehmen weltweit geführt. Darüber hinaus nehmen Volumen, Vielfalt und Komplexität der Daten enorm zu. Angesichts des zunehmenden Wettbewerbs und des stark regulierten Umfelds implementieren die Unternehmen der Energie- und Versorgungsbranche Analysefunktionen, um effizient am Markt konkurrieren zu können. Das Typensegment des Marktes für Energie- und Versorgungsanalysen ist in Lösungen und Dienstleistungen unterteilt.
Markteinblicke in Dienstleistungen
Das Dienstleistungssegment der Energie- und Versorgungsanalysen ist in Managed Services und Professional Services unterteilt. Der rasante technologische Fortschritt hat die Notwendigkeit unterstrichen, die Komplexität der IT-Umgebung zu verstehen und sicherzustellen, dass die Technologie mit den Geschäftszielen von Energie- und Versorgungsunternehmen synchronisiert ist. Die Integration mehrerer IT-Systeme, die unterschiedliche Abteilungen, Funktionen und Phasen im Produktlebenszyklus bedienen, ist für Unternehmen auf ihrem Wachstumspfad heute eine zentrale Herausforderung. Daher versuchen Unternehmen, technologiebasierte Geschäftsmodelle zu implementieren, um sich einen Wettbewerbsvorteil zu verschaffen.
Markteinblick in Bereitstellungsmodelle
Der globale Markt für Energie- und Versorgungsanalysen ist nach Bereitstellungstyp segmentiert und wird in vor Ort, Cloud und Hybrid kategorisiert. Im aktuellen Szenario steigt der Bedarf der Energie- und Versorgungsunternehmen an Analyselösungen. Die Bedrohung durch Cyberkriminalität bleibt jedoch für Unternehmen, die Analysesoftware einsetzen, immer eine Herausforderung. Daher entscheiden sich viele Unternehmen für ein Bereitstellungsmodell vor Ort, um ihre Daten zu schützen und in Reichweite zu behalten.
Markteinblick in Anwendungen
Der globale Energie- und Versorgungsmarkt ist nach Anwendung weiter segmentiert in Lastprognose, Kundenanalyse, Netzanalyse, Anlagenverwaltung, Smart-Meter-Analyse und andere. Die Bedarfsprognose für Elektrizität ist ein integraler und zentraler Prozess für die Strategieplanung von Anlagenerweiterungen und periodischen Vorgängen im Energie- und Stromsektor. Und da die Nachfragemuster verschiedener Sektoren aufgrund der Deregulierung der Energiemärkte nahezu sehr komplex sind, ist die Auswahl eines geeigneten Prognosemodells für ein bestimmtes Stromnetz für die Energie- und Versorgungsbranche zu einer relativ schwierigen Aufgabe geworden. Obwohl auf dem Markt verschiedene Prognosemethoden vorhanden sind, kann keine für alle Nachfragemuster verallgemeinert werden.
Vertikale Markteinblicke
Das vertikale Branchensegment des globalen Marktes für Energie- und Versorgungsanalysen ist in Öl und Gas, Kernkraft, erneuerbare Energien, Versorgungsunternehmen und andere unterteilt. Die Öl- und Gasunternehmen setzen konsequent auf Analyselösungen, da die Branche weiterhin an mehreren Fronten nach Risikomanagement sucht. Außerdem wird erwartet, dass die steigenden Kosten für Förderung und Bohrung eine Herausforderung für in der Öl- und Gasindustrie tätige Unternehmen darstellen. Daher integrieren die Unternehmen Analysen zur Reservoircharakterisierung, Produktionsprognose, Bohroptimierung und verbessern die Komplexität der Reservoircharakterisierung, neben anderen derartigen Vorteilen. Darüber hinaus wird mit den staatlichen Initiativen zur Erzeugung erneuerbarer Energien auch bei den Anlagen für erneuerbare Energien weltweit ein deutliches Wachstum erwartet.
Die Akteure im Markt für Enterprise-Content-Management konzentrieren sich auf Strategien wie Fusionen, Übernahmen und Marktinitiativen, um ihre Marktposition zu behaupten. Im Folgenden sind einige Entwicklungen der wichtigsten Akteure aufgeführt:
- Im April 2018 ging BuildingIQ eine Partnerschaft mit Cypress Envirosystems ein, um die Produktivität zu steigern und Energie zu sparen. BuildingIQ kombiniert seine prädiktive Optimierung mit den fortschrittlichen Thermostaten von Envirosystems von Cypress. Ziel der Partnerschaft ist es, ältere Gebäude mit KI-gesteuerten Lösungen auszustatten, um einen besseren Einblick in das System zu bieten. Außerdem könnten die alten Gebäude ihren Stromverbrauch um 30 % senken.
- Im Februar 2018 führten EnergySavvy und der Snohomish County Public Utility District das neue Home Energy Profile des PUD ein, ein Online-Bewertungstool, mit dem Kunden Energie in ihren Häusern sparen können.
Energie- und Versorgungsanalysen
Regionale Einblicke in den Energie- und VersorgungsanalysemarktDie Analysten von The Insight Partners haben die regionalen Trends und Faktoren, die den Markt für Energie- und Versorgungsanalysen im Prognosezeitraum beeinflussen, ausführlich erläutert. In diesem Abschnitt werden auch die Marktsegmente und die geografische Lage in Nordamerika, Europa, dem asiatisch-pazifischen Raum, dem Nahen Osten und Afrika sowie Süd- und Mittelamerika erörtert.
Umfang des Marktberichts zur Energie- und Versorgungsanalyse
| Berichtsattribut | Einzelheiten |
|---|---|
| Marktgröße in 2017 | US$ 2.26 Billion |
| Marktgröße nach 2025 | US$ 5.71 Billion |
| Globale CAGR (2017 - 2025) | 12.5% |
| Historische Daten | 2015-2016 |
| Prognosezeitraum | 2018-2025 |
| Abgedeckte Segmente |
By Typ
|
| Abgedeckte Regionen und Länder |
Nordamerika
|
| Marktführer und wichtige Unternehmensprofile |
|
Dichte der Marktteilnehmer im Bereich Energie- und Versorgungsanalyse: Verständnis ihrer Auswirkungen auf die Geschäftsdynamik
Der Markt für Energie- und Versorgungsanalysen wächst rasant. Dies wird durch die steigende Endverbrauchernachfrage aufgrund veränderter Verbraucherpräferenzen, technologischer Fortschritte und eines stärkeren Bewusstseins für die Produktvorteile vorangetrieben. Mit der steigenden Nachfrage erweitern Unternehmen ihr Angebot, entwickeln Innovationen, um den Bedürfnissen der Verbraucher gerecht zu werden, und nutzen neue Trends, was das Marktwachstum weiter ankurbelt.
- Holen Sie sich die Markt für Energie- und Versorgungsanalysen Übersicht der wichtigsten Akteure
- Lösungen
- Services
Markt für Energie- und Versorgungsanalytik – Service
- Professionelle Services
- Managed Services
Markt für Energie- und Versorgungsanalytik – Bereitstellungsmodell
- Vor Ort
- Cloud
- Hybrid
Markt für Energie- und Versorgungsanalytik – Anwendung
- Lastprognose
- Kundenanalytik
- Netzanalytik
- Asset Management
- Smart Meter Analytics
- Sonstige
Markt für Energie- und Versorgungsanalytik – Nach Branche
- Öl und Gas
- Erneuerbare Energien
- Kernenergie
- Strom
- Wasser
- Sonstige
Markt für Energie- und Versorgungsanalytik – Nach Geografie
-
Nordamerika
- USA
- Kanada
- Mexiko
-
Europa
- Frankreich
- Deutschland
- Italien
- Spanien
- Großbritannien
- Restliches Europa
-
Asien-Pazifik (APAC)
- Australien
- China
- Indien
- Japan
- Restlicher APAC
-
Naher Osten und Afrika (MEA)
- Saudi-Arabien
- VAE
- Südafrika
- Rest von MEA
-
Südamerika (SAM)
- Brasilien
- Rest von SAM
Unternehmen
- International Business Machines Corporation
- Oracle Corporation
- BuildingIQ, Inc.
- Capgemini SE
- EnergySavvy Inc.
- Infosys Limited
- SAP SE
- SAS Institute Inc.
- WegoWise, Inc.
- Wipro Limited

Ankita ist eine dynamische Marktforschungs- und Beratungsexpertin mit über 8 Jahren Erfahrung in den Bereichen Technologie, Medien, IKT sowie Elektronik und Halbleiter. Sie hat über 100 Beratungs- und Forschungsaufträge für globale Kunden wie Microsoft, Oracle, NEC Corporation, SAP, KPMG und Expeditors International erfolgreich geleitet und durchgeführt. Zu ihren Kernkompetenzen gehören Marktbewertung, Datenanalyse, Prognose, Strategieformulierung, Wettbewerbsbeobachtung und das Verfassen von Berichten. Ankita ist versiert in der Abwicklung kompletter Projektzyklen – von der Angebotserstellung vor dem Verkauf und Kundengesprächen bis hin zur Bereitstellung umsetzbarer Erkenntnisse nach dem Verkauf. Sie ist versiert in der Leitung funktionsübergreifender Teams, der Strukturierung komplexer Forschungsmodule und der Ausrichtung von Lösungen an kundenspezifischen Geschäftszielen. Ihre ausgezeichneten Kommunikationsfähigkeiten, Führungsqualitäten und Präsentationsfähigkeiten haben es ihr ermöglicht, in einem schnelllebigen und sich entwickelnden Marktumfeld stets wertorientierte Ergebnisse zu liefern.
- Umfassende Analyse der Marktgröße und Prognosen
- Detaillierte Segmentierungsanalyse
- Tiefgehende Bewertung der Marktdynamik
- Einblicke auf regionaler und nationaler Ebene
- Wettbewerbslandschaft und Unternehmens-Benchmarking
- Strategische Business Intelligence
Erfahrungsberichte
Der SCADA-Systemmarktbericht von Insight Partners ist umfassend und bietet wertvolle Einblicke in aktuelle Trends und Zukunftsprognosen. Das Team war durchweg hochprofessionell, reaktionsschnell und hilfsbereit. Wir sind sehr zufrieden und können die Dienstleistungen wärmstens empfehlen.
RAN KEDEM Partner, Reali Technologies LTDsIch habe einen Bericht über einen sehr spezifischen Softwaremarkt angefordert, und das Team hat ihn innerhalb weniger Tage erstellt. Die Informationen waren sehr relevant und gut präsentiert. Anschließend habe ich einige Änderungen und Ergänzungen zum Bericht angefordert. Das Team reagierte erneut sehr schnell, und ich erhielt den Abschlussbericht in weniger als einer Woche.
JEAN-HERVE JENN Vorsitzende, Future AnalyticaWir haben mit The Insight Partners für eine wichtige Marktstudie und Prognose zusammengearbeitet. Sie gaben uns klare Einblicke in Chancen und Risiken, die uns bei der Gestaltung unserer Pläne halfen. Ihre Recherchen waren benutzerfreundlich und basierten auf soliden Daten. Sie halfen uns, kluge und sichere Entscheidungen zu treffen. Wir können sie wärmstens empfehlen.
PIYUSH NAGPAL Sr. Vizepräsident, Fernlicht GlobalDie Insight Partners lieferten aufschlussreiche, gut strukturierte Marktforschung mit fundierter Fachkompetenz. Ihr Team war durchweg professionell und reaktionsschnell. Die benutzerfreundliche Website ermöglichte den Zugriff auf Branchenberichte. Wir empfehlen sie wärmstens für zuverlässige und hochwertige Forschungsdienstleistungen.
YUKIHIKO ADACHI Geschäftsführer, Deep Blue, LLC.Dies ist das erste Mal, dass ich einen Marktbericht von The Insight Partners erworben habe. Obwohl ich zunächst unsicher war, besuchte ich die Website und fühlte mich dann sicherer, das Risiko einzugehen und einen Marktbericht zu kaufen. Ich bin mit der Qualität des Berichts und dem Kundenservice rundum zufrieden. Ich hatte einige Fragen und Anmerkungen zum ersten Bericht, aber nach einigen E-Mail-Gesprächen mit dem Analysten bin ich überzeugt, dass ich einen Bericht habe, den ich als Input für unseren strategischen Planungsprozess verwenden kann. Vielen Dank, dass Sie sich die Zeit genommen und dies zu einer positiven Erfahrung gemacht haben. Ich werde Ihren Service auf jeden Fall weiterempfehlen und Sie werden meine erste Anlaufstelle sein, wenn wir weitere Marktdaten benötigen.
JOHN SUZUKI Präsident und Chief Executive Officer, Vorstandsmitglied, BK TechnologiesIch möchte mich für Ihre Unterstützung und die Professionalität bedanken, die Sie bei der Bearbeitung meiner Informationsanfrage zum IVD-Markt für Infektionskrankheiten in Nigeria gezeigt haben. Ich schätze Ihre Geduld, Ihre Beratung und die Tatsache, dass Sie bereit waren, einen Rabatt anzubieten, der uns schließlich den Abschluss eines Geschäfts ermöglichte. Ich freue mich darauf, The Insight Partners in Zukunft wieder zu beauftragen, dank des Eindrucks, den Sie bei dieser ersten Begegnung bei mir hinterlassen haben.
DR. CHIJIOKE ONYIA GESCHÄFTSFÜHRERIN, PineCrest Healthcare Ltd.Grund zum Kauf
- Fundierte Entscheidungsfindung
- Marktdynamik verstehen
- Wettbewerbsanalyse
- Kundeneinblicke
- Marktprognosen
- Risikominimierung
- Strategische Planung
- Investitionsbegründung
- Identifizierung neuer Märkte
- Verbesserung von Marketingstrategien
- Steigerung der Betriebseffizienz
- Anpassung an regulatorische Trends


