機器レンタルソフトウェア市場の成長、規模、シェア、傾向、主要プレーヤーの分析、2031年までの予測
過去データ : 2021-2022 | 基準年 : 2023 | 予測期間 : 2024-2031機器レンタルソフトウェア市場の規模と予測(2021年 - 2031年)、世界および地域のシェア、傾向、成長機会分析レポートの対象範囲:コンポーネント(ソフトウェアとサービス)、展開(オンプレミスとクラウドベース)、組織規模(中小企業と大企業)、エンドユーザー(製造、建設、輸送、その他)、および地域別
- ステータス : 公開されたデータ
- レポートコード : TIPRE00011705
- カテゴリー : テクノロジー、メディア、通信
- ページ数 : 150
- 利用可能なレポート形式 :


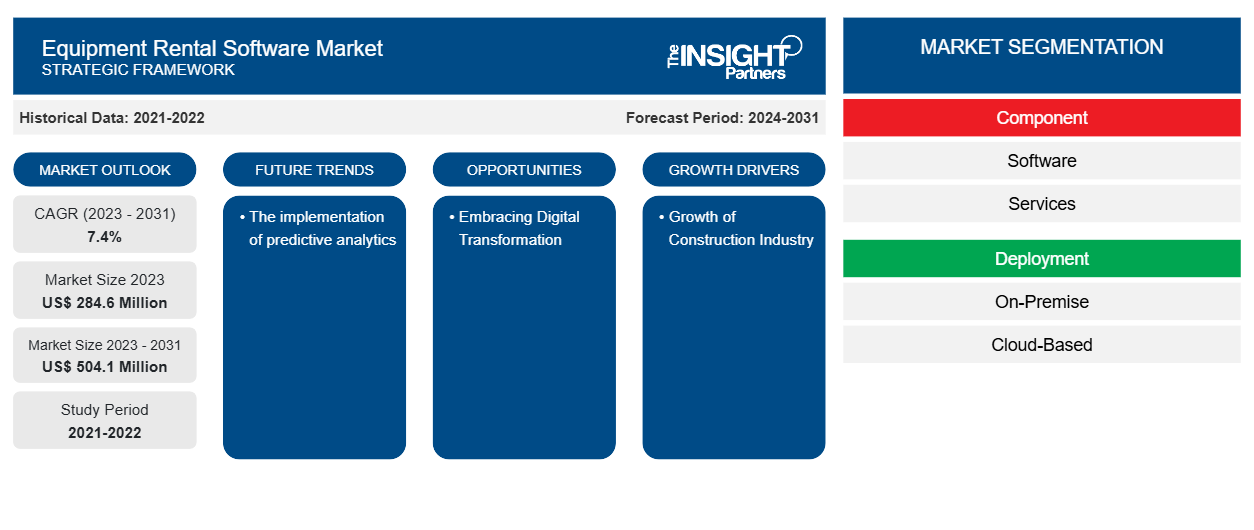
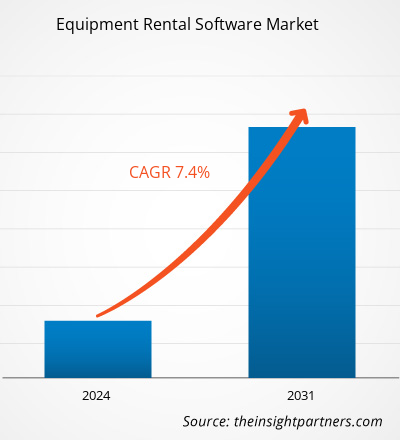
機器レンタルソフトウェアの市場規模は、2023年の2億8,460万米ドルから2031年には5億410万米ドルに達すると予測されています。市場は2023年から2031年の間に7.4%のCAGRを記録すると予想されています。予測分析の実装は、市場の主要なトレンドであり続けると思われます。
機器レンタルソフトウェア市場分析
機器レンタル ソフトウェアは、トレーニングや顧客サポートから生産性や財務管理まで、ビジネスの各側面を確実にカバーしながら、利用可能なリソースを効率的に活用するように設計されています。機器レンタル ソフトウェアの目的は、組織が所有する機器群の管理を支援することです。このソフトウェアは、利用可能な機器やレンタルの場所を知ること以外にも、組織にメリットをもたらします。強力な機器レンタル ソフトウェアを使用すると、組織は次のことを実行し、メリットを得ることができます。これらすべての機能のメリットは、全体として、生産性と収益性の向上です。優れた機器レンタル ソフトウェアと最高の機器レンタル ソフトウェアの違いは、機能の奥深さと使いやすさです。HBS Systems は、基本的な機器レンタル ソフトウェア機能を超えて、モバイル デバイスのどこからでも 1 つの使いやすいシステムで使用できる多数の追加機能を備えています。
機器レンタルソフトウェア市場の概要
機器レンタル ソフトウェアは、プロセスを合理化し、業務を整理し、資産を管理し、減価償却を計算するためのツールを企業に提供します。このソフトウェア ソリューションを使用すると、従業員に機器を割り当て、メンテナンスをスケジュールし、会計や簿記などのバックオフィス業務を実行することもできます。機器レンタル ソフトウェアは、中規模市場や急成長中の中小企業が、機器のダウンタイムの削減、スケジュールの整理、レポートや洞察の生成、請求書や文書の管理などの利点を通じて、会社の目標を達成し、成長するのに役立ちます。
要件に合わせてレポートをカスタマイズする
このレポートの一部、国レベルの分析、Excelデータパックなど、あらゆるレポートを無料でカスタマイズできます。また、スタートアップや大学向けのお得なオファーや割引もご利用いただけます。
機器レンタルソフトウェア市場:戦略的洞察
-
このレポートの主要な市場動向を入手してください。この無料サンプルには、市場動向から見積もりや予測に至るまでのデータ分析が含まれます。
機器レンタルソフトウェア市場の推進要因と機会
建設業界の成長が市場を有利に導く
公共投資プロジェクトは建設業界に大きな後押しを与えています。これには、都市インフラ、交通、道路、灌漑、不動産などの分野のメガプロジェクトが含まれます。インド空港公団は、新しい空港の建設、既存の空港の拡張とアップグレード、滑走路、テクニカルブロック、管制塔の強化に73億米ドルを投資しています。また、2025年までに35億9000万米ドルを投資して、デリー、バンガロール、ハイデラバードの3つのPPP空港を拡張する予定です。建設資材業界の建設機器レンタルソフトウェアは、クライアントのニーズを満たす信頼性の高いソリューションを提供します。産業機器の価格設定、予防保守、シリアル番号管理、修理モジュールなどの特定の機能を備えたSirius-eは、ツールと機器のレンタルのすべてのニーズを満たすように設計されています。レンタル、販売、サービスをすべて1つの統合レンタルソフトウェアで処理できるSirius-eの機能は、建設レンタルビジネスに大きなメリットをもたらします。
デジタル変革の推進
デジタルテクノロジの出現により、レンタル機器ビジネスは業務を効率化し、顧客エクスペリエンスを向上させ、成長を促進する前例のない機会を得ています。クラウドベースのレンタル管理システム、IoT 対応の機器追跡、顧客エンゲージメントのためのモバイル アプリケーションなどのデジタル変革イニシアチブを採用することで、企業は時代を先取りすることができます。データ分析と予測的洞察を活用することで、企業はリソースの割り当てを最適化し、顧客のニーズを予測し、情報に基づいたビジネス上の意思決定を行うことができます。Microsoft Dynamics 365 Business Central は、機器レンタル会社にとって貴重なソリューションとなり、ビジネス運営のさまざまな側面を効率的に管理するための統合プラットフォームを提供します。
機器レンタルソフトウェア市場レポートのセグメンテーション分析
機器レンタル ソフトウェア市場分析の導出に貢献した主要なセグメントは、コンポーネント、展開、組織規模、およびエンド ユーザーです。
- 機器レンタルソフトウェア市場は、コンポーネントに基づいてソフトウェアとサービスに分けられます。
- 展開によって、市場はオンプレミスとクラウドベースに分類されます。
- 組織の規模によって、市場は中小企業と大企業に分類されます。
- エンドユーザーの観点から見ると、市場は製造、建設、輸送、その他に分類されます。
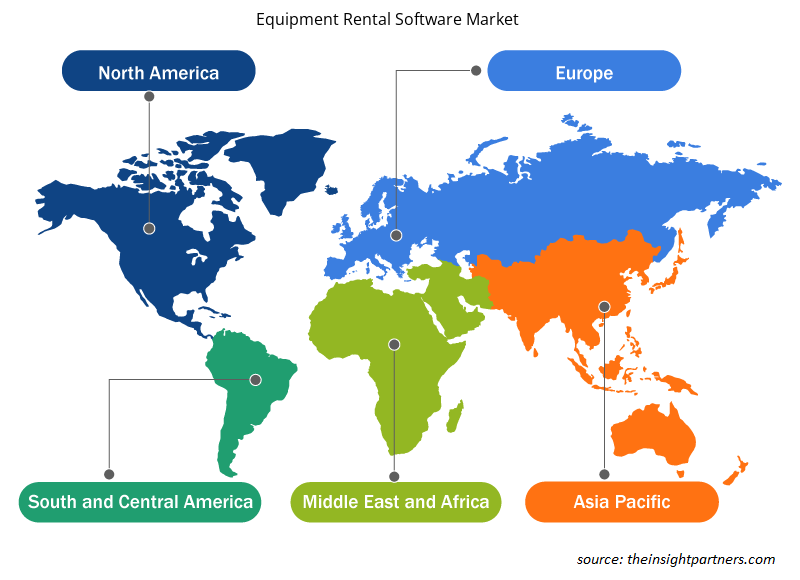
機器レンタルソフトウェアの地域別市場シェア分析
機器レンタルソフトウェア市場レポートの地理的範囲は、主に北米、アジア太平洋、ヨーロッパ、中東およびアフリカ、南米および中米の5つの地域に分かれています。北米全土での建設活動の増加と企業間の効率的な運用の必要性の高まりが、市場の成長を牽引しています。北米全土のさまざまなプレーヤーが機器レンタルソフトウェアを立ち上げています。たとえば、2020年9月、Orion Softwareは、レンタルサービスを補完するためにGPSテクノロジーを販売および商品化する契約をTelusと発表しました。レンタル会社は、Sirius eプラットフォームを使用してメーターをリアルタイムで更新し、過剰使用を請求し、予防保守アラートをトリガーできます。顧客ポータルのWebポータルでは、建設現場の現場にある機器の位置を見つけることもできます。Telusテクノロジーとのこの統合により、導入上の大きなメリットがもたらされます。レンタル会社は、すべての機器ブランドで機能し、インストールが非常に簡単な標準テクノロジーを入手できます。
機器レンタルソフトウェア市場の地域別分析
予測期間を通じて機器レンタル ソフトウェア市場に影響を与える地域的な傾向と要因は、Insight Partners のアナリストによって徹底的に説明されています。このセクションでは、北米、ヨーロッパ、アジア太平洋、中東およびアフリカ、南米および中米にわたる機器レンタル ソフトウェア市場のセグメントと地理についても説明します。
- 機器レンタルソフトウェア市場の地域別データを入手
機器レンタルソフトウェア市場レポートの範囲
| レポート属性 | 詳細 |
|---|---|
| 2023年の市場規模 | 2億8,460万米ドル |
| 2031年までの市場規模 | 5億410万米ドル |
| 世界のCAGR(2023年~2031年) | 7.4% |
| 履歴データ | 2021-2022 |
| 予測期間 | 2024-2031 |
| 対象セグメント |
コンポーネント別
|
| 対象地域と国 |
北米
|
| 市場リーダーと主要企業プロフィール |
|
機器レンタルソフトウェア市場のプレーヤー密度:ビジネスダイナミクスへの影響を理解する
機器レンタル ソフトウェア市場は、消費者の嗜好の変化、技術の進歩、製品の利点に対する認識の高まりなどの要因により、エンド ユーザーの需要が高まり、急速に成長しています。需要が高まるにつれて、企業は提供内容を拡大し、消費者のニーズを満たすために革新し、新たなトレンドを活用し、市場の成長をさらに促進しています。
市場プレーヤー密度とは、特定の市場または業界内で活動している企業または会社の分布を指します。これは、特定の市場スペースに、その市場規模または総市場価値に対してどれだけの競合相手 (市場プレーヤー) が存在するかを示します。
機器レンタルソフトウェア市場で事業を展開している主要企業は次のとおりです。
- BCSプロソフトLLC
- eSlJB Inc. を予約する
- EZレントアウト
- HQレンタルソフトウェア
- 株式会社インスプハイヤー
- MCSグローバル株式会社
免責事項:上記の企業は、特定の順序でランク付けされていません。
- 機器レンタルソフトウェア市場のトップキープレーヤーの概要を入手
機器レンタルソフトウェア市場のニュースと最近の動向
機器レンタル ソフトウェア市場は、主要な企業出版物、協会データ、データベースなどの一次調査と二次調査を経て定性的および定量的データを収集することで評価されます。機器レンタル ソフトウェア市場の動向のいくつかを以下に示します。
- EZRentOut は、多数の新機能と機能強化を導入しました。B2B 顧客管理モジュールにより、企業へのレンタルが簡単になりました。顧客は、クイック チェックイン ボタンを使用して、より迅速かつ効率的に返却したり、資産の使用量に基づいてレンタル料金を請求したり、カスタム レポートからダッシュボードに直接チャートやグラフを追加したりできるようになりました。(出典: EZRentOut、2022 年 3 月)
- Point of Rental Software は、成長戦略の 1 つとして南アフリカでの事業を拡大しており、サハラ以南のアフリカでビジネス インテリジェンス ソフトウェア ソリューションをターゲットにしています。(出典: Point of Rental Software、2021 年 12 月)
機器レンタルソフトウェア市場レポートの対象範囲と成果物
「機器レンタルソフトウェア市場の規模と予測(2021〜2031年)」レポートでは、以下の分野をカバーする市場の詳細な分析を提供しています。
- 機器レンタルソフトウェア市場の規模と予測(対象範囲に含まれるすべての主要市場セグメントの世界、地域、国レベル)
- 機器レンタルソフトウェア市場の動向、および推進要因、制約、主要な機会などの市場動向
- 詳細なPEST/ポーターの5つの力とSWOT分析
- 主要な市場動向、世界および地域の枠組み、主要プレーヤー、規制、最近の市場動向を網羅した機器レンタルソフトウェア市場分析
- 市場集中、ヒートマップ分析、主要プレーヤー、機器レンタルソフトウェア市場の最近の動向を網羅した業界の状況と競争分析
- 詳細な企業プロフィール

アンキタは、テクノロジー、メディア、ICT、エレクトロニクス・半導体の各分野で8年以上の経験を持つ、ダイナミックな市場調査およびコンサルティングのプロフェッショナルです。Microsoft、Oracle、NEC、SAP、KPMG、Expeditors Internationalといったグローバルクライアントに対し、100件以上のコンサルティングおよび調査案件を主導・遂行してきました。彼女のコアコンピテンシーは、市場評価、データ分析、予測、戦略策定、競合情報、レポート作成です。
アンキタは、販売前の提案書作成やクライアントとの協議から、販売後の実用的なインサイトの提供まで、プロジェクトサイクル全体を巧みに管理することに長けています。彼女は、部門横断的なチームの管理、複雑な調査モジュールの構築、そしてクライアント固有のビジネス目標に合わせたソリューションの調整に長けています。優れたコミュニケーション能力、リーダーシップ、そしてプレゼンテーション能力により、急速に変化する市場環境において、常に価値主導の成果を生み出しています。
- 過去2年間の分析、基準年、CAGRによる予測(7年間)
- PEST分析とSWOT分析
- 市場規模価値/数量 - 世界、地域、国
- 業界と競争環境
- Excel データセット
お客様の声
Insight PartnersのSCADAシステム市場レポートは包括的で、現在のトレンドと将来の予測に関する貴重な洞察が含まれています。チームは終始、非常にプロフェッショナルで、対応が早く、サポートも充実していました。私たちは彼らのサービスに非常に満足しており、強くお勧めします。
ラン・ケデム パートナー, レアリテクノロジーズ株式会社非常に特殊なソフトウェア市場に関するレポートを依頼したところ、チームは数日でレポートを作成してくれました。情報は非常に関連性が高く、分かりやすくまとめられていました。その後、レポートにいくつか修正と追加を依頼しましたが、チームは非常に迅速に対応し、1週間も経たないうちに最終レポートを受け取ることができました。
ジャン=エルヴェ・ジェン 会長, フューチャー・アナリティカ重要な市場調査と予測のために、The Insight Partnersと協力しました。彼らは機会とリスクに関する明確な洞察を提供し、私たちの計画策定に役立ちました。彼らの調査は使いやすく、確かなデータに基づいており、賢明で自信に満ちた意思決定に役立ちました。彼らを強くお勧めします。
ピユーシュ・ナグパル 上級副社長, ハイビームグローバルInsight Partnersは、深い専門知識に基づき、洞察力に富み、構造化された市場調査を提供しました。チームは終始プロフェッショナルで、対応力も抜群でした。ユーザーフレンドリーなウェブサイトにより、業界レポートへのアクセスもスムーズでした。信頼性の高い高品質な調査サービスをお探しなら、Insight Partnersを強くお勧めします。
安達幸彦 最高経営責任者(CEO), ディープブルーLLC。The Insight Partnersから市場レポートを購入するのは今回が初めてです。最初は不安でしたが、ウェブサイトを見て、リスクを負ってでも購入してみようという気持ちになりました。レポートの品質とカスタマーサービスには大変満足しています。最初のレポートにはいくつか質問やコメントがありましたが、アナリストとメールで何度かやり取りした結果、戦略策定プロセスへのインプットとして活用できるレポートが完成しました。貴重なお時間を割いていただき、貴重な体験をさせていただき、誠にありがとうございました。他の方にもぜひお勧めしたいですし、今後さらに市場データが必要になった際には、まずThe Insight Partnersにご連絡させていただきます。
ジョン・スズキ 社長兼最高経営責任者、取締役, BKテクノロジーズナイジェリアの感染症IVD市場に関する情報提供依頼に対し、ご対応いただいた際、ご尽力とプロフェッショナルな姿勢に深く感謝申し上げます。忍耐強く、的確なアドバイスをいただき、また、最終的に取引成立に至った割引のご提供にも深く感謝申し上げます。今回の最初の出会いで得た強い印象のおかげで、今後もThe Insight Partnersとの連携を心待ちにしております。
チジオケ博士 オニア マネージングディレクター, パインクレストヘルスケア株式会社購入理由
- 情報に基づいた意思決定
- 市場動向の理解
- 競合分析
- 顧客インサイト
- 市場予測
- リスク軽減
- 戦略計画
- 投資の正当性
- 新興市場の特定
- マーケティング戦略の強化
- 業務効率の向上
- 規制動向への対応


 無料サンプルを入手 - 機器レンタルソフトウェア市場