エンジニアリング ソフトウェア市場 - 2031 年の成長予測、統計、事実
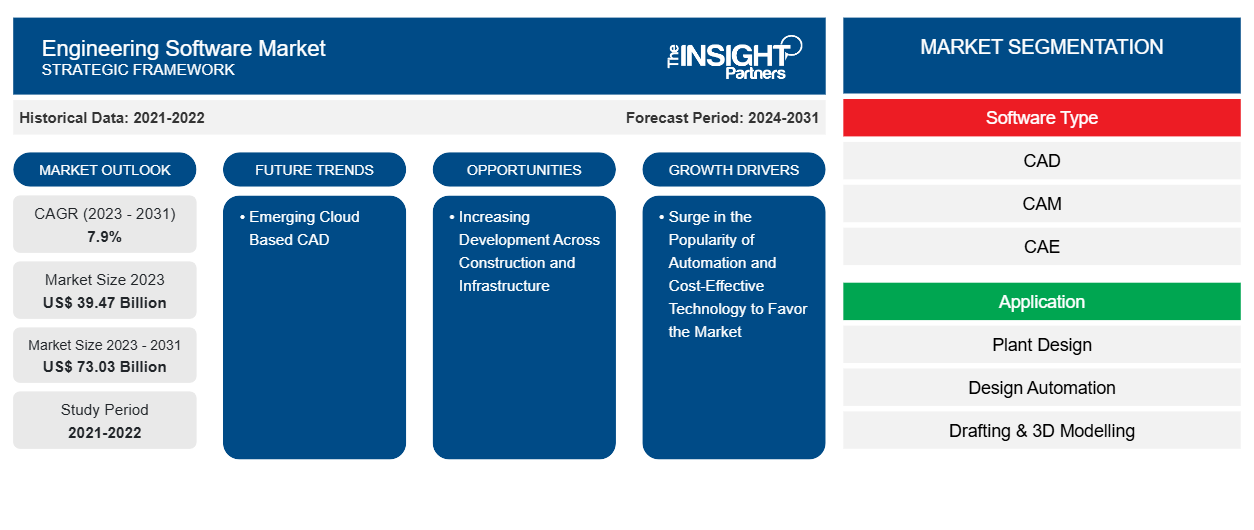
過去データ : 2021-2022 | 基準年 : 2023 | 予測期間 : 2024-2031エンジニアリングソフトウェア市場の規模と予測(2021-2031年)、世界および地域のシェア、トレンド、成長機会分析レポートの対象範囲:ソフトウェアの種類(CAD、CAM、CAE、AEC、EDA)およびアプリケーション(プラント設計、設計自動化、製図および3Dモデリング、製品設計およびテスト、その他)、および地域別
- ステータス : 公開されたデータ
- レポートコード : TIPTE100000135
- カテゴリー : テクノロジー、メディア、通信
- ページ数 : 150
- 利用可能なレポート形式 :


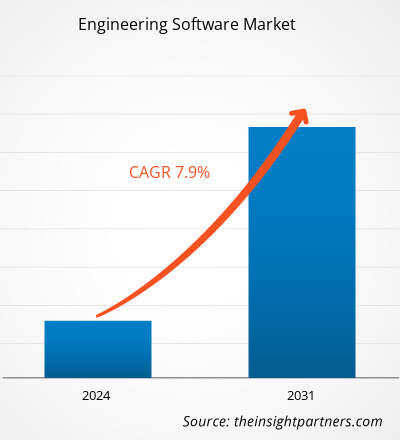
エンジニアリング ソフトウェア市場の規模は、2023 年の 394.7 億米ドルから 2031 年には 730.3 億米ドルに達すると予測されています。市場は 2023 年から 2031 年にかけて 7.9% の CAGR を記録すると予想されています。自動化とコスト効率の高いテクノロジーの人気の高まりは、今後もエンジニアリング ソフトウェア市場の主要なトレンドであり続けると思われます。
エンジニアリングソフトウェア市場分析
自動車、航空宇宙、建設、医療などのさまざまな業界で CAD および CAE ソフトウェアの使用が増えていることが、市場の拡大につながっています。エンジニアリング用ソフトウェアには、コンピュータ支援設計 (CAD)、コンピュータ支援製造 (CAM)、コンピュータ支援エンジニアリング (CAE) などがあります。エンジニアリング ソフトウェア市場は、製品開発の時間と費用を短縮したいという企業からの需要の高まりなど、さまざまな理由から、予測期間を通じて大幅に拡大すると予想されています。
エンジニアリングソフトウェア市場の概要
エンジニア、設計者、製造業者は、エンジニアリング ソフトウェア ソリューションを利用して、重要なエンジニアリング ドキュメントの作成、製品のパフォーマンスと操作の分析とシミュレーション、複雑なモデルの開発を行うことができます。クラウドベースのソリューションでは、Web ブラウザーからアクセスできるため、チーム メンバーは任意のデバイスを使用してリモートで共同作業を行うことができます。その結果、企業は計算能力や有用性を犠牲にすることなく、ハードウェアの最新化と支出の削減が可能になります。
要件に合わせてレポートをカスタマイズする
このレポートの一部、国レベルの分析、Excelデータパックなど、あらゆるレポートを無料でカスタマイズできます。また、スタートアップや大学向けのお得なオファーや割引もご利用いただけます。
エンジニアリング ソフトウェア市場:戦略的洞察
-
このレポートの主要な市場動向を入手してください。この無料サンプルには、市場動向から見積もりや予測に至るまでのデータ分析が含まれます。
エンジニアリング ソフトウェア市場の推進要因と機会
自動化とコスト効率の高いテクノロジーの人気が高まり、市場が有利になります。
世界中のプラント 0/0 と EPC は、市場の競争が激化しているため、製造エラーと運用コストを削減するプレッシャーにさらされています。プラント エンジニアは、設計、製造、試運転のプロセス中に特定の国際標準に従うことで、品質を向上させることができます。製造と強度の問題は、設計ソフトウェア、継続的な分析、標準のアップグレードによって解決できます。その結果、世界中の企業が、建設と製造におけるミスを削減するために、エンジニアリング ソフトウェアをますます使用しています。
建設とインフラ全体の開発の拡大
どの国でも、社会経済の発展に貢献する主な要因の 1 つは建設であると考えられています。エチオピア、インド、中国、ブラジル、ウズベキスタン、カンボジア、タンザニア、ミャンマーなど、世界中の発展途上国では、建設業界が急速に拡大しています。これらの経済の基本的なインフラも急速に発展しています。たとえば、アジア太平洋および SAM の発展途上国では、インフラ開発に多くの外国直接投資が集まっています。これらの進歩はインフラの成長にも拍車をかけ、建設業界が拡大するにつれて、エンジニアリング ソフトウェアの必要性も高まります。したがって、インフラおよび建設ビジネス分野の進歩が拡大することが期待されます。
エンジニアリングソフトウェア市場レポートのセグメンテーション分析
エンジニアリング ソフトウェア市場分析の導出に貢献した主要なセグメントは、ソフトウェアの種類とアプリケーションです。
- ソフトウェアの種類に基づいて、エンジニアリング ソフトウェア市場は CAD、CAM、CAE、AEC、EDA に分かれています。CAD セグメントは予測期間中に成長すると予想されます。CAE, AEC, and EDA. The CAD segment is anticipated to grow in the forecast period.
- アプリケーション別に見ると、市場はプラント設計、設計自動化、製図と 3D モデリング、製品設計とテスト、その他に分類されます。設計自動化セグメントは予測期間中に成長すると予想されます。
地域別エンジニアリングソフトウェア市場シェア分析
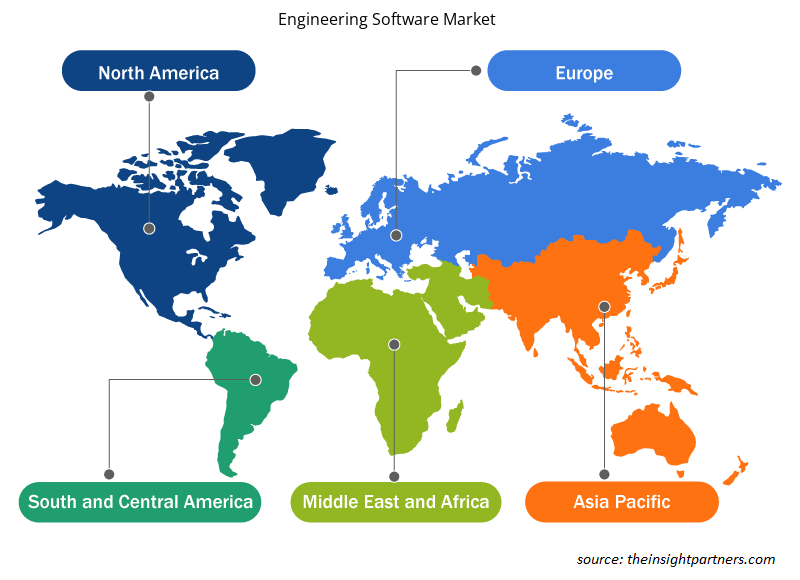
エンジニアリング ソフトウェア市場レポートの地理的範囲は、主に北米、アジア太平洋、ヨーロッパ、中東およびアフリカ、南米/中南米の 5 つの地域に分かれています。北米はエンジニアリング ソフトウェア市場を支配してきました。北米地域のさまざまな業界でのハイテク採用の傾向が、エンジニアリング ソフトウェア市場の成長を後押ししています。デジタル ツールの採用の増加や政府機関による高額な技術支出などの要因が、北米のエンジニアリング ソフトウェア市場の成長を牽引すると予想されています。さらに、米国とカナダの先進国では研究開発に重点が置かれているため、北米のプレーヤーは技術的に高度なソリューションを市場に投入せざるを得ません。さらに、米国には、革新的なソリューションの開発にますます重点を置いているエンジニアリング ソフトウェア市場のプレーヤーが多数存在します。これらすべての要因が、この地域のエンジニアリング ソフトウェア市場の成長に貢献しています。
エンジニアリング ソフトウェア市場の地域別分析
予測期間を通じてエンジニアリング ソフトウェア市場に影響を与える地域的な傾向と要因は、Insight Partners のアナリストによって徹底的に説明されています。このセクションでは、北米、ヨーロッパ、アジア太平洋、中東およびアフリカ、南米および中米にわたるエンジニアリング ソフトウェア市場のセグメントと地理についても説明します。
- エンジニアリングソフトウェア市場の地域別データを入手
エンジニアリングソフトウェア市場レポートの範囲
| レポート属性 | 詳細 |
|---|---|
| 2023年の市場規模 | 394.7億米ドル |
| 2031年までの市場規模 | 730.3億米ドル |
| 世界のCAGR(2023年~2031年) | 7.9% |
| 履歴データ | 2021-2022 |
| 予測期間 | 2024-2031 |
| 対象セグメント |
ソフトウェアタイプ別
|
| 対象地域と国 |
北米
|
| 市場リーダーと主要企業プロフィール |
|
エンジニアリング ソフトウェア市場のプレーヤー密度: ビジネス ダイナミクスへの影響を理解する
エンジニアリング ソフトウェア市場は、消費者の嗜好の変化、技術の進歩、製品の利点に対する認識の高まりなどの要因により、エンド ユーザーの需要が高まり、急速に成長しています。需要が高まるにつれて、企業は提供内容を拡大し、消費者のニーズを満たすために革新を起こし、新たなトレンドを活用し、市場の成長をさらに促進しています。
市場プレーヤー密度とは、特定の市場または業界内で活動している企業または会社の分布を指します。これは、特定の市場スペースに、その市場規模または総市場価値に対してどれだけの競合相手 (市場プレーヤー) が存在するかを示します。
エンジニアリング ソフトウェア市場で事業を展開している主要企業は次のとおりです。
- PTCC
- ロックウェル・オートメーション
- SAP SE
- シーメンス
- シノプシス株式会社
- オートデスク株式会社
免責事項:上記の企業は、特定の順序でランク付けされていません。
- エンジニアリングソフトウェア市場のトップキープレーヤーの概要を入手
エンジニアリング ソフトウェア市場のニュースと最近の動向
エンジニアリング ソフトウェア市場は、主要な企業出版物、協会データ、データベースなどの一次調査と二次調査後の定性的および定量的データを収集することによって評価されます。市場の動向の一覧は次のとおりです。
- 2024 年 2 月、世界的なテクノロジー企業 Cognizant は、プラットフォームの提供範囲を拡大することでビジネスの近代化を加速することを目指しています。同社は、ソフトウェア エンジニアリングの新時代を推進するために設計された生成 AI 対応プラットフォームである Cognizant Flowsource のリリースを発表しました。
(出典:コグニザント、プレスリリース、2024年)
- 2023 年 6 月、Nullspace, Inc. は、アラバマ州ハンツビルの老舗防衛請負業者である IERUS Technologies からのスピンオフとして設立されました。Nullspace, Inc. は、電磁気アプリケーション向けの高度なエンジニアリング ソフトウェアの提供に重点を置いています。
(出典:Nullspace、プレスリリース、2023年)
エンジニアリングソフトウェア市場レポートの対象範囲と成果物
「エンジニアリング ソフトウェア市場の規模と予測 (2021 ~ 2031 年)」レポートでは、以下の分野をカバーする市場の詳細な分析を提供しています。
- 対象範囲に含まれるすべての主要市場セグメントの世界、地域、国レベルでの市場規模と予測
- 市場の動向(推進要因、制約、主要な機会など)
- 今後の主な動向
- 詳細なPEST/ポーターの5つの力とSWOT分析
- 主要な市場動向、主要プレーヤー、規制、最近の市場動向を網羅した世界および地域の市場分析
- 市場集中、ヒートマップ分析、主要プレーヤー、最近の動向を網羅した業界の状況と競争分析
- 詳細な企業プロフィール

アンキタは、テクノロジー、メディア、ICT、エレクトロニクス・半導体の各分野で8年以上の経験を持つ、ダイナミックな市場調査およびコンサルティングのプロフェッショナルです。Microsoft、Oracle、NEC、SAP、KPMG、Expeditors Internationalといったグローバルクライアントに対し、100件以上のコンサルティングおよび調査案件を主導・遂行してきました。彼女のコアコンピテンシーは、市場評価、データ分析、予測、戦略策定、競合情報、レポート作成です。
アンキタは、販売前の提案書作成やクライアントとの協議から、販売後の実用的なインサイトの提供まで、プロジェクトサイクル全体を巧みに管理することに長けています。彼女は、部門横断的なチームの管理、複雑な調査モジュールの構築、そしてクライアント固有のビジネス目標に合わせたソリューションの調整に長けています。優れたコミュニケーション能力、リーダーシップ、そしてプレゼンテーション能力により、急速に変化する市場環境において、常に価値主導の成果を生み出しています。
- 過去2年間の分析、基準年、CAGRによる予測(7年間)
- PEST分析とSWOT分析
- 市場規模価値/数量 - 世界、地域、国
- 業界と競争環境
- Excel データセット
お客様の声
Insight PartnersのSCADAシステム市場レポートは包括的で、現在のトレンドと将来の予測に関する貴重な洞察が含まれています。チームは終始、非常にプロフェッショナルで、対応が早く、サポートも充実していました。私たちは彼らのサービスに非常に満足しており、強くお勧めします。
ラン・ケデム パートナー, レアリテクノロジーズ株式会社非常に特殊なソフトウェア市場に関するレポートを依頼したところ、チームは数日でレポートを作成してくれました。情報は非常に関連性が高く、分かりやすくまとめられていました。その後、レポートにいくつか修正と追加を依頼しましたが、チームは非常に迅速に対応し、1週間も経たないうちに最終レポートを受け取ることができました。
ジャン=エルヴェ・ジェン 会長, フューチャー・アナリティカ重要な市場調査と予測のために、The Insight Partnersと協力しました。彼らは機会とリスクに関する明確な洞察を提供し、私たちの計画策定に役立ちました。彼らの調査は使いやすく、確かなデータに基づいており、賢明で自信に満ちた意思決定に役立ちました。彼らを強くお勧めします。
ピユーシュ・ナグパル 上級副社長, ハイビームグローバルInsight Partnersは、深い専門知識に基づき、洞察力に富み、構造化された市場調査を提供しました。チームは終始プロフェッショナルで、対応力も抜群でした。ユーザーフレンドリーなウェブサイトにより、業界レポートへのアクセスもスムーズでした。信頼性の高い高品質な調査サービスをお探しなら、Insight Partnersを強くお勧めします。
安達幸彦 最高経営責任者(CEO), ディープブルーLLC。The Insight Partnersから市場レポートを購入するのは今回が初めてです。最初は不安でしたが、ウェブサイトを見て、リスクを負ってでも購入してみようという気持ちになりました。レポートの品質とカスタマーサービスには大変満足しています。最初のレポートにはいくつか質問やコメントがありましたが、アナリストとメールで何度かやり取りした結果、戦略策定プロセスへのインプットとして活用できるレポートが完成しました。貴重なお時間を割いていただき、貴重な体験をさせていただき、誠にありがとうございました。他の方にもぜひお勧めしたいですし、今後さらに市場データが必要になった際には、まずThe Insight Partnersにご連絡させていただきます。
ジョン・スズキ 社長兼最高経営責任者、取締役, BKテクノロジーズナイジェリアの感染症IVD市場に関する情報提供依頼に対し、ご対応いただいた際、ご尽力とプロフェッショナルな姿勢に深く感謝申し上げます。忍耐強く、的確なアドバイスをいただき、また、最終的に取引成立に至った割引のご提供にも深く感謝申し上げます。今回の最初の出会いで得た強い印象のおかげで、今後もThe Insight Partnersとの連携を心待ちにしております。
チジオケ博士 オニア マネージングディレクター, パインクレストヘルスケア株式会社購入理由
- 情報に基づいた意思決定
- 市場動向の理解
- 競合分析
- 顧客インサイト
- 市場予測
- リスク軽減
- 戦略計画
- 投資の正当性
- 新興市場の特定
- マーケティング戦略の強化
- 業務効率の向上
- 規制動向への対応


 無料サンプルを入手 - エンジニアリングソフトウェア市場