
RF パワーアンプ市場の分析と予測 - 規模、シェア、成長、トレンド 2031 年
RFパワーアンプ市場の規模と予測(2021年 - 2031年)、世界および地域別のシェア、トレンド、成長機会分析レポートの対象範囲:周波数(10GHz未満、11~20GHz、21~30GHz、30GHz以上)、技術(ガリウムヒ素(GaAs)、窒化ガリウム(GaN)、シリコンゲルマニウム(SiGe)、その他)、アプリケーション(民生用電子機器、航空宇宙および防衛、自動車、医療、その他)、および地域
- ステータス : 出版
- レポートコード : TIPTE100000482
- カテゴリー : エレクトロニクスおよび半導体
- ページ数 : 181
- 利用可能なレポート形式 :


- 最終更新日 : June 12, 2024

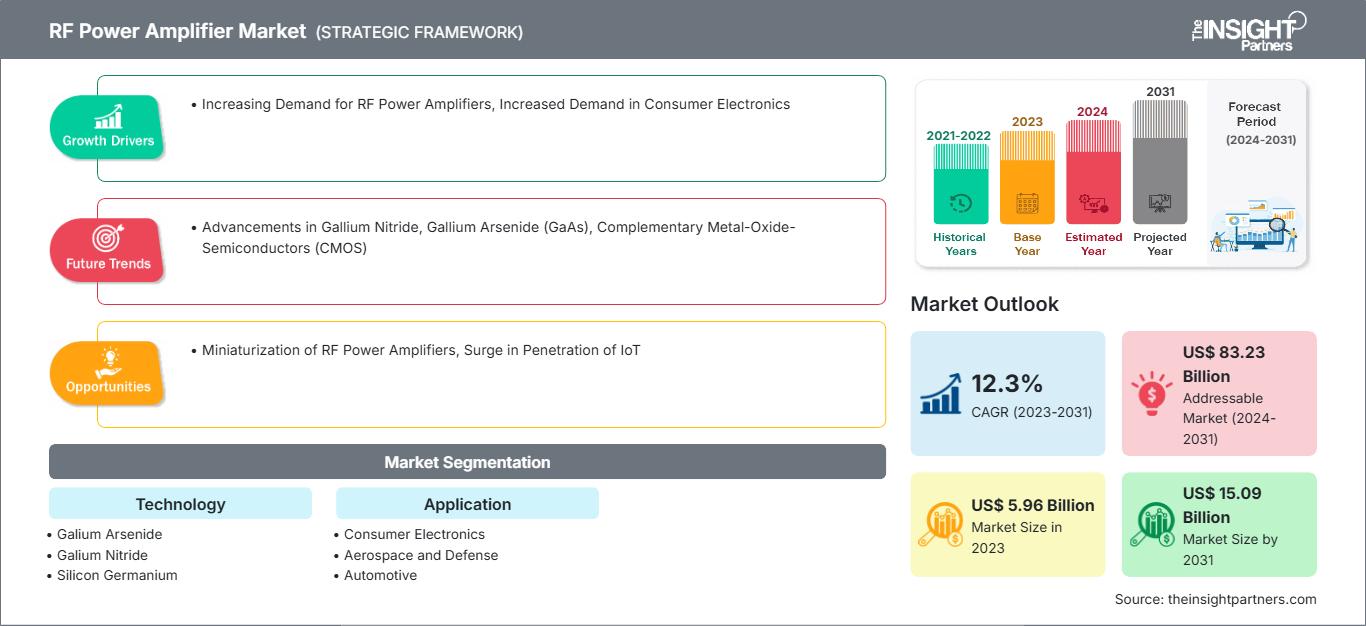
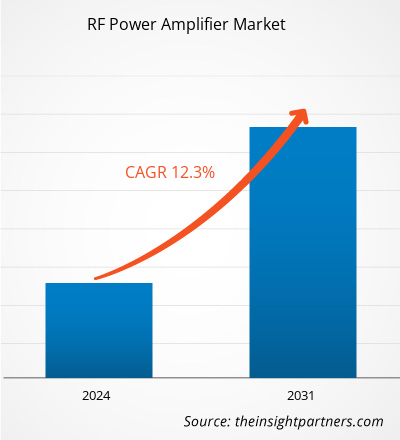
RFパワーアンプ市場規模は、2023年の59億6,000万米ドルから2031年には150億9,000万米ドルに達すると予測されています。市場は2023年から2031年にかけて12.3%のCAGRを記録すると予想されています。RFパワーアンプの需要増加と民生用電子機器の需要増加は、RFパワーアンプ市場の主要なトレンドであり続けると思われます。
RFパワーアンプ市場分析
RFパワーアンプは、無線周波数信号の電力を増幅するために使用される電気機器です。弱い入力信号を、長距離伝送や高電力負荷(最も一般的にはアンテナ)の駆動に適したより大きな電力レベルに増幅します。RFパワーアンプは、直線性、信号品質、低歪みを維持しながら、高電力レベルを効率的に処理できる能力によって区別されます。RFパワーアンプ市場規模は、5Gインフラストラクチャの急速な導入により、今後数年間で急増する可能性があります。 RFパワーアンプ市場レポートでは、市場を牽引する主要要因と主要企業の動向に焦点を当てています。
RFパワーアンプ市場概要
無線周波数パワーアンプ(RFパワーアンプ)は、微弱な無線周波数信号を増幅し、より高い電力レベルに増幅する電子機器です。通常、無線送信機の最終段で使用され、アンテナを介して送信される前に信号を増幅します。RFパワーアンプは、信号強度の強化、出力電力の増加、帯域幅の拡大、電力効率の向上、直線性の維持、入出力インピーダンスの整合、効率的な放熱など、特定の目的に合わせて設計されています。
タブレット、ノートパソコン、スマートフォンなどの個人用電子機器の使用増加に伴い、RFパワーアンプの需要が高まっています。これらのアンプは、低電力の無線周波数信号を高電力信号に変換することで、これらの機器の性能向上に重要な役割を果たします。電子機器への消費者支出が継続的に増加するにつれて、RFパワーアンプの需要も増加すると予想されます。さらに、革新的なRF技術の開発は、民生用電子機器におけるRFパワーアンプの需要増加に貢献しています。これらの技術は、ダイナミックパワーレンジ、より高い周波数、より低いノイズパラメータを備えた製品を提供し、次世代電子部品の設計を可能にします。さらに、4Gや5Gなどの高速ネットワークの普及と普及は、民生用電子機器におけるRFパワーアンプの需要に大きな影響を与えています。民生用電子機器や通信などの業界におけるRFパワーアンプの需要の増加は、RFパワーアンプ市場全体の成長に大きく貢献しています。
要件に合わせてレポートをカスタマイズ
レポートの一部、国レベルの分析、Excelデータパックなどを含め、スタートアップ&大学向けに特別オファーや割引もご利用いただけます(無償)
RFパワーアンプ市場: 戦略的洞察
-
このレポートの主要な市場動向を入手してください。この無料サンプルには、市場動向から見積もりや予測に至るまでのデータ分析が含まれます。
RFパワーアンプ市場の推進要因と機会
民生用電子機器業界におけるRFパワーアンプの需要増加が市場を後押し
スマートフォン、タブレット、ラップトップ、その他の個人用デバイスを含む民生用電子機器の使用の急増は、RFパワーアンプの需要増加の要因となっています。可処分所得の増加、デジタル化、個人用電子機器の普及の拡大など、さまざまな要因に牽引されて民生用電子機器市場が拡大し続ける中、これらのデバイスは、低電力の無線周波数信号を高電力信号に変換することでパフォーマンスを向上させるためにRFパワーアンプに依存しています。GSMAの年次モバイルインターネット接続レポート2023(SOMIC)によると、2023年10月時点で世界人口の半分以上(54%)、約43億人がスマートフォンを所有しています。たとえば、エリクソンとラディカティグループによると、2020年のスマートフォンの数は57億5000万台と記録されました。2024年にはスマートフォンの数は69億3000万台に増加し、2025年までには71億5000万台に達すると予想されています。
RFパワーアンプの小型化 - RFパワーアンプの機会
ワイヤレステクノロジーアプリケーションにおけるコンパクトでエネルギー効率の高いデバイスの需要、5Gなどの通信エンジニアリングの進歩、および効率、直線性、帯域幅などのパラメーターを強化した高品質伝送の必要性から、小型RFパワーアンプの採用につながっています。RFパワーアンプの小型化により、ワイヤレストランシーバーへの統合が可能になります。この統合は、全体的なパフォーマンスに影響を与えることなく、より小型でポータブルなデバイスの開発に不可欠です。小型RFパワーアンプをトランシーバーに統合することで、各セルの無線センサーに複数のRFパワーアンプを搭載できるようになり、無線通信システムの効率と性能の向上に貢献します。小型RFパワーアンプは消費電力を削減し、性能を損なうことなくコンパクトなデバイスを設計するのに役立ちます。RFパワーアンプのサイズを小型化し、設計を改善することで、安定した出力と高効率を維持しながら消費電力を最小限に抑えることができます。IoT、無線センサー、コネクテッドデバイスの採用が増加するにつれて、効率的に動作し、バッテリー寿命を延ばすことができるRFパワーアンプのニーズが高まっています。RFパワーアンプの小型化は、通信、放送、航空宇宙、防衛、ヘルスケアなど、さまざまな業界で応用されています。したがって、RFパワーアンプの小型化は、予測期間中に市場プレーヤーに新たな機会をもたらすと予想されます。
RFパワーアンプ市場レポートのセグメンテーション分析
RFパワーアンプ市場分析の導出に貢献した主要なセグメントは、タイプ、原因、障害タイプ、カテゴリ、およびエンドユーザーです。
- 周波数に基づいて、RFパワーアンプ市場は、10GHz未満、11〜20GHz、21〜30GHz、および30GHz以上に分割されています。10GHz未満のセグメントは、2023年に大きな市場シェアを占めました。
- 技術別に、市場はガリウムヒ素(GaAs)、窒化ガリウム(GaN)、シリコンゲルマニウム(SiGe)などに分割されています。 2023年には、ガリウムヒ素(GaAs)セグメントが最大の市場シェアを占めました。
- アプリケーション別に見ると、市場は民生用電子機器、航空宇宙および防衛、自動車、医療、その他に分類されています。2023年には、民生用電子機器セグメントが最大の市場シェアを占めました。
RFパワーアンプの地域別市場シェア分析
RFパワーアンプ市場レポートの地理的範囲は、主に北米、アジア太平洋、ヨーロッパ、中東およびアフリカ、南米/中南米の5つの地域に分かれています。
収益面では、アジア太平洋地域が最大のRFパワーアンプ市場シェアを占めました。この地域の市場は、中国、日本、韓国、インド、オーストラリア、その他のアジア太平洋地域に分かれています。中国は非常に収益性の高いRFパワーアンプ市場を有し、同国はRFパワーアンプの世界全体の生産量と消費量の大きなシェアを占めています。中国では、RFパワーアンプ技術の研究開発の増加、ワイヤレス技術の進歩、ヘルスケアや製薬などの業界におけるハイテク製品やソリューションの急速な普及により、RFパワーアンプの需要が高まっています。中国には膨大な数のモバイル加入者がいます。GSMAによると、2022年末の時点で、国内で約13億人がモバイルサービスに加入していました。このような大規模な消費者基盤が、同国のRFパワーアンプの需要に貢献しています。さらに、高品質のインフラと低い人件費が、同国への巨額の投資と事業開発の機会を惹きつけており、中国はRFパワーアンプ市場における大規模投資と事業拡大の世界的な拠点としての地位を確立しています。
RFパワーアンプ市場のニュースと最近の動向
RFパワーアンプ市場は、重要な企業出版物、協会データ、データベースなどの一次調査と二次調査後の定性的および定量的データを収集することによって評価されます。以下は、音声言語障害および戦略の市場における動向のリストです。
- Broadcom Inc は、Wi-Fi 7 アクセス ポイント向けに最適化されたフィルター統合を備えた FiFEM を発表しました。FiFEM は、Wi-Fi ルーター、住宅用ゲートウェイ、エンタープライズ アプリケーションで使用される世界初の Wi-Fi RF FEM です。FiFEM デバイスは、クラス最高の FBAR フィルター技術を採用しており、優れた 5 GHz 帯と 6 GHz 帯の共存と低い帯域内挿入損失を実現するとともに、RF フロント エンドの部品表 (BOM) を大幅に削減します。(出典: Broadcom Inc、プレス リリース、2023 年)
- Qualcomm Inc は、高性能 5G モバイル デバイス向けの Snapdragon X65 および X62 5G モデム RF システムなど、次世代の RF フロント エンド (RFFE) ソリューションを発表しました。これらのソリューションは、モデム、RFトランシーバー、人工知能(AI)を活用したRFフロントエンドコンポーネント、ミリ波アンテナモジュールを統合し、高度な性能と電力効率を実現するように設計されています。これらのソリューションにより、OEMはプレミアム5Gデバイスを設計できます。(出典:Qualcomm Inc、プレスリリース、2021年)
RFパワーアンプ市場の地域別分析
予測期間を通じてRFパワーアンプ市場に影響を与える地域的なトレンドと要因については、The Insight Partnersのアナリストが詳細に解説しています。このセクションでは、北米、ヨーロッパ、アジア太平洋、中東・アフリカ、中南米におけるRFパワーアンプ市場のセグメントと地域についても解説しています。
RFパワーアンプ市場レポートのスコープ
| レポート属性 | 詳細 |
|---|---|
| の市場規模 2023 | US$ 5.96 Billion |
| 市場規模別 2031 | US$ 15.09 Billion |
| 世界的なCAGR (2023 - 2031) | 12.3% |
| 過去データ | 2021-2022 |
| 予測期間 | 2024-2031 |
| 対象セグメント |
By テクノロジー
|
| 対象地域と国 |
北米
|
| 市場リーダーと主要企業の概要 |
|
RFパワーアンプ市場のプレーヤー密度:ビジネスダイナミクスへの影響を理解する
RFパワーアンプ市場は、消費者の嗜好の変化、技術の進歩、製品メリットへの認知度の高まりといった要因によるエンドユーザー需要の増加に牽引され、急速に成長しています。需要の増加に伴い、企業は製品ラインナップの拡充、消費者ニーズへの対応のための革新、そして新たなトレンドの活用を進めており、これが市場の成長をさらに加速させています。
- 入手 RFパワーアンプ市場 主要プレーヤーの概要
RFパワーアンプ市場レポートの対象範囲と成果物
「RFパワーアンプ市場規模と予測(2023~2031年)」レポートは、以下の分野を含む市場の詳細な分析を提供します。
- 調査対象となるすべての主要市場セグメントの世界、地域、国レベルでの市場規模と予測
- 推進要因、制約要因、主要な機会などの市場動向
- 主要な将来の傾向
- 詳細なPEST/ポーターの5つの力とSWOT分析
- 主要な市場傾向、主要プレーヤー、規制、および最近の市場動向を含む世界および地域の市場分析
- 市場集中、ヒートマップ分析、主要プレーヤー、および最近の動向を含む業界の状況と競争分析
- 詳細な企業プロファイル

Naveenは、カスタム、シンジケート、コンサルティングの各プロジェクトにおいて9年以上の実績を持つ、経験豊富な市場調査およびコンサルティングのプロフェッショナルです。現在はアソシエイトバイスプレジデントを務め、プロジェクトバリューチェーン全体にわたるステークホルダー管理を成功させ、100件以上の調査レポートと30件以上のコンサルティング案件を執筆しています。産業および政府機関のプロジェクトに幅広く携わり、クライアントの成功とデータに基づく意思決定に大きく貢献しています。
Naveenは、カルナータカ州VTUで電子通信工学の学位を取得し、マニパル大学でマーケティング&オペレーションズのMBAを取得しています。IEEEの会員として9年間活動し、会議や技術シンポジウムへの参加、セクションレベルおよび地域レベルでのボランティア活動に積極的に取り組んでいます。現職以前は、IndustryARCでアソシエイト戦略コンサルタント、Hewlett Packard(HP Global)で産業用サーバーコンサルタントを務めていました。
- 包括的な市場規模および予測分析
- 詳細なセグメンテーション分析
- 市場動向(ダイナミクス)の徹底的な評価
- 地域および国別のインサイト
- 競争環境および企業ベンチマーク
- 戦略的ビジネスインテリジェンス
お客様の声
Insight PartnersのSCADAシステム市場レポートは包括的で、現在のトレンドと将来の予測に関する貴重な洞察が含まれています。チームは終始、非常にプロフェッショナルで、対応が早く、サポートも充実していました。私たちは彼らのサービスに非常に満足しており、強くお勧めします。
ラン・ケデム パートナー, レアリテクノロジーズ株式会社非常に特殊なソフトウェア市場に関するレポートを依頼したところ、チームは数日でレポートを作成してくれました。情報は非常に関連性が高く、分かりやすくまとめられていました。その後、レポートにいくつか修正と追加を依頼しましたが、チームは非常に迅速に対応し、1週間も経たないうちに最終レポートを受け取ることができました。
ジャン=エルヴェ・ジェン 会長, フューチャー・アナリティカ重要な市場調査と予測のために、The Insight Partnersと協力しました。彼らは機会とリスクに関する明確な洞察を提供し、私たちの計画策定に役立ちました。彼らの調査は使いやすく、確かなデータに基づいており、賢明で自信に満ちた意思決定に役立ちました。彼らを強くお勧めします。
ピユーシュ・ナグパル 上級副社長, ハイビームグローバルInsight Partnersは、深い専門知識に基づき、洞察力に富み、構造化された市場調査を提供しました。チームは終始プロフェッショナルで、対応力も抜群でした。ユーザーフレンドリーなウェブサイトにより、業界レポートへのアクセスもスムーズでした。信頼性の高い高品質な調査サービスをお探しなら、Insight Partnersを強くお勧めします。
安達幸彦 最高経営責任者(CEO), ディープブルーLLC。The Insight Partnersから市場レポートを購入するのは今回が初めてです。最初は不安でしたが、ウェブサイトを見て、リスクを負ってでも購入してみようという気持ちになりました。レポートの品質とカスタマーサービスには大変満足しています。最初のレポートにはいくつか質問やコメントがありましたが、アナリストとメールで何度かやり取りした結果、戦略策定プロセスへのインプットとして活用できるレポートが完成しました。貴重なお時間を割いていただき、貴重な体験をさせていただき、誠にありがとうございました。他の方にもぜひお勧めしたいですし、今後さらに市場データが必要になった際には、まずThe Insight Partnersにご連絡させていただきます。
ジョン・スズキ 社長兼最高経営責任者、取締役, BKテクノロジーズナイジェリアの感染症IVD市場に関する情報提供依頼に対し、ご対応いただいた際、ご尽力とプロフェッショナルな姿勢に深く感謝申し上げます。忍耐強く、的確なアドバイスをいただき、また、最終的に取引成立に至った割引のご提供にも深く感謝申し上げます。今回の最初の出会いで得た強い印象のおかげで、今後もThe Insight Partnersとの連携を心待ちにしております。
チジオケ博士 オニア マネージングディレクター, パインクレストヘルスケア株式会社購入理由
- 情報に基づいた意思決定
- 市場動向の理解
- 競合分析
- 顧客インサイト
- 市場予測
- リスク軽減
- 戦略計画
- 投資の正当性
- 新興市場の特定
- マーケティング戦略の強化
- 業務効率の向上
- 規制動向への対応


