スマートハイウェイ市場の成長、規模、シェア、トレンド、主要プレーヤーの分析、2031年までの予測

  • Report Date : Oct 2025
  • Report Code : TIPRE00005250
  • Category : Automotive and Transportation
  • Status : Data Released
  • Available Report Formats : pdf-format excel-format
  • No. of Pages : 150

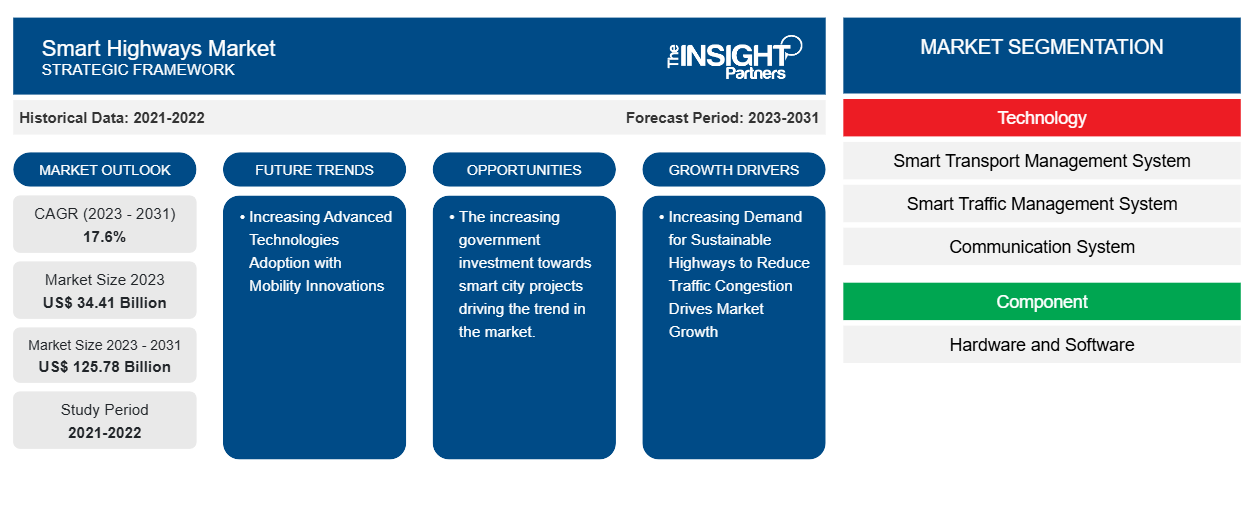
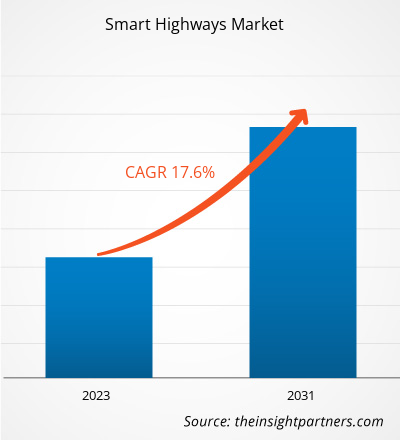
スマートハイウェイの市場規模は、2023年の344億1,000万米ドルから2031年には1,257億8,000万米ドルに達すると予測されています。市場は2023年から2031年の間に17.6%のCAGRを記録すると予想されています。スマートシティ開発に対する政府の取り組みの増加が市場の成長を牽引しています。世界中でスマートシティの確立のための高度なテクノロジーの採用が増えていることが、市場の原動力となっています。

スマートハイウェイ市場分析

交通道路における人工知能、モノのインターネット、接続デバイスなどの先進技術の統合によるスマート ハイウェイの開発の増加が、スマート ハイウェイ市場の成長を牽引しています。世界中のインテリジェントな交通システムと道路インフラをサポートするために、特に高速道路のルートを変更することを計画しているさまざまな管理機関があります。たとえば、ヨーロッパでは、道路利用者と交通管理者が道路活動に関する役立つ情報を調整および共有できるようにする、スマート ロード用の協調型インテリジェント トランスポート システムが構築されています。

スマートハイウェイ市場の概要

広範なセンサー ネットワークを統合して接続性を向上させる都市部での「スマート シティ」の導入とプロジェクト開発の増加が、市場の成長を牽引しています。世界中のスマート シティは、住民の生活をより良く、より効率的に、そして環境に優しいものにするために、大きな変化を遂げています。スマート シティの構築などのイノベーションは、今後数年間でスマート ハイウェイの市場を大幅に強化すると予想されます。

ニューヨーク市は現在、公共部門と民間部門の両方からのプロジェクトにより、モノのインターネットと接続デバイスが提供する最先端のテクノロジーでデジタル変革を進めています。

要件に合わせてレポートをカスタマイズする

このレポートの一部、国レベルの分析、Excelデータパックなど、あらゆるレポートを無料でカスタマイズできます。また、スタートアップや大学向けのお得なオファーや割引もご利用いただけます。

スマートハイウェイ市場:

Smart Highways Market
  • このレポートの主要な市場動向を入手してください。
    この無料サンプルには、市場動向から見積もりや予測に至るまでのデータ分析が含まれます。

スマートハイウェイ市場の推進要因と機会

交通渋滞を緩和する持続可能な高速道路の需要増加が市場の成長を促進

持続可能な高速道路は、社会の発展と経済成長を可能にし、環境への悪影響を軽減します。連邦道路管理局 (FHWA) によると、持続可能な高速道路は持続可能な開発の不可欠な部分であり、設計から建設、運用、保守まで、ライフサイクル全体にわたって評価および実装を検討する必要があります。環境と天然資源のニーズに対応することに加えて、持続可能な高速道路は、交通サービスのアクセシビリティと、安全で快適なウォーキング、サイクリング、および輸送ルートの需要に応えます。米国の高速道路当局は、インテリジェント交通システム (ITS)、リサイクル、計画、環境との連携、国家環境政策法 (NEPA) の要件など、幅広いイニシアチブを通じて持続可能性に取り組んでいます。

建設と道路インフラへの政府支出の増加は、北米のスマートハイウェイ市場にさらなる機会をもたらすでしょう。米国運輸省によると、米国の高速道路と街路プロジェクトへの公共建設支出は、2021年に955億米ドルに達しました。また、米国運輸省によると、スマートシティ開発のために公的資金と民間資金に約3億5000万米ドルが投資されています。

モビリティイノベーションによる先進技術の導入拡大

アドホック メッシュ Wi-Fi や Cellular Vehicle-to-Everything (C-V2X) などのさまざまなテクノロジーにより、ドライバーは信号の変化を常に把握し、他の車両と通信して衝突を回避できます。デジタル テクノロジーの革新により、予測期間中にスマート ハイウェイ市場のプレーヤーに有利な成長機会がもたらされると予想されます。世界中の政府は、スマート ハイウェイ市場の成長を促進するために、コネクテッド ビークル テクノロジーに多額の投資を行っています。たとえば、コロラド州運輸局は、10 年以内に 2,500 台の政府車両に C-V2X と専用短距離通信 (DSRC) テクノロジーを装備する計画を立てています。中国では、C-V2X は広範囲にカバーできるため、コネクテッド ビークルの重要な実現手段として政府に広く採用されています。

スマートハイウェイ市場レポートのセグメンテーション分析

スマートハイウェイ市場分析の導出に貢献した主要なセグメントは、ディスク技術、コンポーネント、および地理です。

  • 技術に基づいて、市場はスマート輸送管理システム、スマート交通管理システム、通信システム、監視システム、その他に分かれています。これらのうち、スマート輸送管理システムは2023年に最大のシェアを占めました。これは、政府の取り組みによるスマートシティへの投資の増加によるものです。
  • コンポーネントに応じて、市場はハードウェアとソフトウェアに分かれています。このうち、2023年にはハードウェアセグメントのシェアが拡大します。これは、スマートシティへの投資の増加によるものです。

スマートハイウェイの地域別市場シェア分析

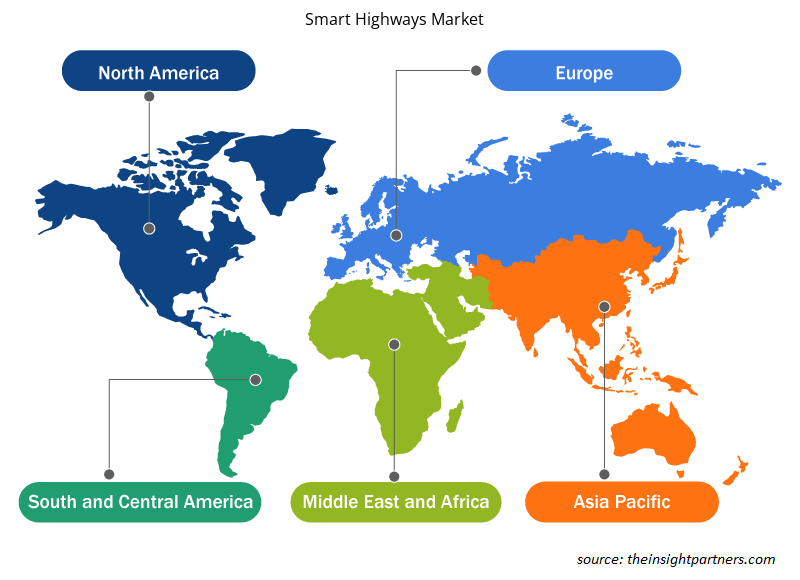
スマートハイウェイ市場レポートの地理的範囲は、主に北米、アジア太平洋、ヨーロッパ、中東およびアフリカ、南米の 5 つの地域に分かれています。

2023年には北米が最大のシェアを占めると予想されています。これは主に、橋、有料道路、トンネルの費用を賄うために高速道路への投資が増加しているためです。米国全土には、この地域の道路輸送と高速道路のシナリオを変革する施設が300以上あります。Toll Miner Data Visualizationツールによると、米国には321以上の有料施設を運営する114以上の事業者があります。これはETCを使用しており、道路の中心線はなんと6,235マイルに及びます。したがって、施設からの現金支払い(および料金所)を排除する自動料金徴収システムの大規模な導入は、北米のスマート高速道路の他のコンポーネントとテクノロジーの実装の成功を促します。


スマートハイウェイ市場の地域別分析

予測期間を通じてスマートハイウェイ市場に影響を与える地域的な傾向と要因は、Insight Partners のアナリストによって徹底的に説明されています。このセクションでは、北米、ヨーロッパ、アジア太平洋、中東およびアフリカ、南米および中米にわたるスマートハイウェイ市場のセグメントと地理についても説明します。

Smart Highways Market
  • スマートハイウェイ市場の地域別データを入手

スマートハイウェイ市場レポートの範囲

レポート属性詳細
2023年の市場規模344.1億米ドル
2031年までの市場規模1,257.8億米ドル
世界のCAGR(2023年~2031年)17.6%
履歴データ2021-2022
予測期間2023-2031
対象セグメントテクノロジー別
  • スマート輸送管理システム
  • スマート交通管理システム
  • 通信システム
  • 監視システム
コンポーネント別
  • ハードウェアとソフトウェア
対象地域と国北米
  • 私たち
  • カナダ
  • メキシコ
ヨーロッパ
  • 英国
  • ドイツ
  • フランス
  • ロシア
  • イタリア
  • その他のヨーロッパ
アジア太平洋
  • 中国
  • インド
  • 日本
  • オーストラリア
  • その他のアジア太平洋地域
南米と中央アメリカ
  • ブラジル
  • アルゼンチン
  • 南米および中米のその他の地域
中東およびアフリカ
  • 南アフリカ
  • サウジアラビア
  • アラブ首長国連邦
  • その他の中東およびアフリカ
市場リーダーと主要企業プロフィール
  • コンデュエント
  • 株式会社
  • ファーウェイテクノロジーズ株式会社
  • IBIグループ
  • シスコ
  • カプシュ・トラフィックコムAG
  • 日本工営株式会社
  • ノキア
  • シーメンス
  • Telegra東芝インフラシステムズ株式会社


スマートハイウェイ市場のプレーヤー密度:ビジネスダイナミクスへの影響を理解する

スマート ハイウェイ市場は、消費者の嗜好の変化、技術の進歩、製品の利点に対する認識の高まりなどの要因により、エンド ユーザーの需要が高まり、急速に成長しています。需要が高まるにつれて、企業は提供内容を拡大し、消費者のニーズを満たすために革新を起こし、新たなトレンドを活用し、市場の成長をさらに促進しています。

市場プレーヤー密度とは、特定の市場または業界内で活動している企業または会社の分布を指します。これは、特定の市場スペースに、その規模または総市場価値と比較して、どれだけの競合相手 (市場プレーヤー) が存在するかを示します。

スマートハイウェイ市場で事業を展開している主要企業は次のとおりです。

  1. コンデュエント
  2. 株式会社
  3. ファーウェイテクノロジーズ株式会社
  4. IBIグループ
  5. シスコ
  6. カプシュ・トラフィックコムAG

免責事項上記の企業は、特定の順序でランク付けされていません。


smart-highway-market-cagr


  • スマートハイウェイ市場のトップキープレーヤーの概要を入手

スマートハイウェイ市場のニュースと最近の動向

スマート ハイウェイ市場は、主要な企業出版物、協会データ、データベースなどの一次調査と二次調査後の定性的および定量的データを収集することによって評価されます。スマート ハイウェイ市場におけるいくつかの開発を以下に示します。

  • インドのスマートシティプロジェクトでは、首都が一般に公開され、2本の道路が開発されました。アルタラからヴァズタカウドとティカウドを経由してチェンティッタまで建設されたスマートハイウェイは、2024年4月末までに完成する予定です。キリパラム-アッタクランガラ道路は、2024年5月の第2週までに完成しました。(出典:タイムズ・オブ・インディア・ニュースレター、2024年3月)
  • スマートモビリティインフラ管理における世界的に信頼されるテクノロジーエコシステムであるIteris, Inc.は本日、米国ネバダ州カーソンシティが市内の交差点検知センサーをIterisのVantage Apexハイブリッドセンサーにアップグレードすることを決定したことを発表しました。Vantage Apexは、人工知能(AI)アルゴリズムを統合した業界初の1080p高解像度(HD)ビデオおよび4次元(4D)レーダーセンサーです。車両、歩行者、自転車の最先端の検知、追跡、分類精度に加え、交通管理センター監視用のHDビデオ表示を提供します。(出典:プレスリリース、2024年4月)

スマートハイウェイ市場レポートの対象範囲と成果物

「スマートハイウェイ市場規模と予測(2021〜2031年)」レポートでは、以下の分野をカバーする市場の詳細な分析を提供しています。

  • スマートハイウェイの市場規模と予測(対象範囲に含まれるすべての主要市場セグメントについて、世界、地域、国レベルで)
  • スマートハイウェイ市場の動向、および推進要因、制約、主要な機会などの市場動向
  • 詳細なPESTおよびSWOT分析
  • 主要な市場動向、世界および地域の枠組み、主要プレーヤー、規制、最近の市場動向を網羅したスマートハイウェイ市場分析
  • 市場集中、ヒートマップ分析、主要プレーヤー、スマートハイウェイ市場の最近の動向を網羅した業界展望と競争分析
  • 詳細な企業プロフィール

よくある質問

Which region dominated the smart highways market in 2023?

North America is expected to dominate the smart highways market in 2023.

What are the driving factors impacting the smart highways market?

Increasing demand for sustainable highways to reduce traffic congestion drives the market growth.

What are the future trends of the smart highways market?

Increasing adoption of advanced technologies for smart city establishment across the globe is a driving trend in the market.

Which are the leading players operating in the smart highways market?

Conduent, Inc., Huawei Technologies Co., Ltd., IBI Group, Cisco, Kapsch TrafficCom AG, Nippon Koei Co., Ltd., Nokia, Siemens, TelegraToshiba Infrastructure Systems & Solutions Corporation are among the major companies operating in the Smart Highways market.

What would be the estimated value of the Smart Highways market by 2031?

The smart highways market size is projected to reach US$ 125.78 billion by 2031 from US$ 34.41 billion in 2023.

What is the expected CAGR of the smart highways market?

The market is expected to register a CAGR of 17.6% during 2023–2031.

ナヴィーン・チッタラギ
ナヴィーン・チッタラギ
副社長
市場調査とコンサルティング

ナビーンは、カスタム、シンジケート、コンサルティングの各プロジェクトにおいて9年以上の実績を持つ、経験豊富な市場調査およびコンサルティングのプロフェッショナルです。現在はアソシエイトバイスプレジデントを務め、プロジェクトバリューチェーン全体にわたるステークホルダーのマネジメントを成功させ、100件以上の調査レポートと30件以上のコンサルティング案件を執筆しています。産業分野から政府機関まで、幅広いプロジェクトに携わり、クライアントの成功とデータに基づく意思決定に大きく貢献しています。

ナビーンは、カルナータカ州VTUで電子通信工学の学位を取得し、マニパル大学でマーケティング&オペレーションズのMBAを取得しています。9年間IEEEの会員として活動し、会議や技術シンポジウムへの参加、支部および地域レベルでのボランティア活動などを行っています。現職に就く前は、IndustryARCでアソシエイト戦略コンサルタント、ヒューレット・パッカード(HP Global)で産業用サーバーコンサルタントを務めていました。

  • 過去2年間の分析、基準年、CAGRによる予測(7年間)
  • PEST分析とSWOT分析
  • 市場規模価値/数量 - 世界、地域、国
  • 業界と競争環境
  • Excel データセット

お客様の声

購入理由

  • 情報に基づいた意思決定
  • 市場動向の理解
  • 競合分析
  • 新興市場の特定
  • 顧客インサイト
  • 市場予測
  • リスク軽減
  • 業務効率の向上
  • 戦略計画
  • 投資の正当性
  • 業界イノベーションの追跡
  • 規制動向への対応
主な懸念事項への対応 - 質問と回答
購入前にレポートのサンプルを見ることはできますか?

はい!レポートの範囲(目次)、レポートの構成、そしてレポート全体の価値を評価するのに役立つ厳選されたインサイトを含む、レポートの無料サンプルをご提供しています。 「サンプルをダウンロード」ボタンをクリックするか、お問い合わせの上、サンプルをお送りください。

ご購入にはアナリストサポートが含まれていますか?

はい、アナリストによるサポートはパッケージに含まれています。ご購入後、アナリストにご連絡いただき、レポートの洞察や手法についてご説明したり、調査結果がお客様のビジネスニーズにどのように当てはまるかご相談いただけます。

注文後の手順を教えてください。

ご注文が完了すると、確認メールと請求書が届きます。

• 公開済みレポートの場合:4~6営業時間以内に、セキュリティ保護されたメールがお客様のメールアドレスに送信されます。
• 近日公開予定レポートの場合:ご注文は事前予約として記録されます。リリース予定日については、担当チームからご連絡し、最新情報をお知らせいたします。レポートが公開され次第、ご登録いただいたメールアドレスに配信いたします。

レポートは、お客様の特定のニーズに合わせてカスタマイズできますか?

お客様の特定の目的に合わせてレポートをカスタマイズするためのオプションをご用意しております。特定の地域、業界セグメント、競合他社の分析、データカットなど、より深い洞察が必要な場合でも、当社のリサーチチームがそれに応じてレポートをカスタマイズいたします。ご要望をお聞かせください。お客様に合わせたご提案やスコープを喜んでご提供いたします。

レポートはどのような形式で提供されますか?

レポートは、選択したライセンスに応じて、PDF形式またはExcelデータセットで提供されます。

PDF版では、完全な分析とビジュアルがすぐに読める形式で提供されます。Excelデータセットには、すべてのデータテーブルが含まれており、簡単に操作して詳細な分析を行うことができます。
ご購入時にライセンスオプションをご確認ください。または、ご購入に含まれる形式を確認するには、お問い合わせください。

プラットフォームの決済プロセスはどの程度安全ですか?

当社の決済プロセスは完全に安全で、PCI-DSSに準拠しています。

当社は、すべての取引が業界標準のSSL暗号化で保護されるよう、信頼性の高い暗号化された決済ゲートウェイを使用しています。お支払い情報は当社のサーバーに保存されることはありません。認定されたサードパーティの決済代行業者によって安全に処理されます。
お客様の個人情報と財務情報は当社で安全に保管されますので、安心してご購入いただけます。

複数のレポートをご購入いただく場合、特別価格はありますか?

はい、まとめ買いの場合は特別価格をご用意しております。
複数のレポートをご購入いただく場合は、お客様のニーズに合わせてカスタマイズされたバンドルオファーまたは数量ベースの割引をご提供いたします。ご検討中のレポートのリストを弊社の営業チームまでお送りください。お客様に合わせたお見積もりをお送りいたします。

ご購入前に、担当チームとレポートについてご相談させていただくことは可能でしょうか?

はい、もちろんです。
弊社のチームが、お客様が十分な情報に基づいて意思決定できるようお手伝いいたします。レポートの範囲、方法論、カスタマイズオプション、最適なライセンスなど、ご質問がございましたら、お気軽にお問い合わせください。 sales@theinsightpartners.com までご連絡ください。担当者が速やかにご連絡いたします。

ご購入時に請求書は発行されますか?

はい、ご購入が完了すると請求書が自動的に生成され、ご登録いただいたメールアドレスに送信されます。
特定の形式で請求書が必要な場合や、追加情報(会社名、GST、VAT情報など)が必要な場合は、お気軽にお問い合わせください。喜んでご対応させていただきます。

レポートにアクセスできない場合、サポートを受けることはできますか?

はい、もちろんです。
レポートへのアクセスや受信に問題が発生した場合は、サポートチームがサポートいたします。ご注文情報を添えて、メールまたはライブチャットでお問い合わせください。問題を迅速に解決し、お客様が中断することなくレポートにアクセスできるようお手伝いいたします。

当社のクライアント
Your data will never be shared with third parties, however, we may send you information from time to time about our products that may be of interest to you. By submitting your details, you agree to be contacted by us. You may contact us at any time to opt-out.

販売支援
US: +1-646-491-9876
UK: +44-20-8125-4005
Email: sales@theinsightpartners.com
チャットでお問い合わせください
DUNS Logo
87-673-9708
ISO Certified Logo
ISO 9001:2015
ISO Certified Logo

The Insight Partners performs research in 4 major stages: Data Collection & Secondary Research, Primary Research, Data Analysis and Data Triangulation & Final Review.

  1. Data Collection and Secondary Research:

As a market research and consulting firm operating from a decade, we have published and advised several client across the globe. First step for any study will start with an assessment of currently available data and insights from existing reports. Further, historical and current market information is collected from Investor Presentations, Annual Reports, SEC Filings, etc., and other information related to company’s performance and market positioning are gathered from Paid Databases (Factiva, Hoovers, and Reuters) and various other publications available in public domain.

Several associations trade associates, technical forums, institutes, societies and organization are accessed to gain technical as well as market related insights through their publications such as research papers, blogs and press releases related to the studies are referred to get cues about the market. Further, white papers, journals, magazines, and other news articles published in last 3 years are scrutinized and analyzed to understand the current market trends.

  1. Primary Research:

The primarily interview analysis comprise of data obtained from industry participants interview and answers to survey questions gathered by in-house primary team.

For primary research, interviews are conducted with industry experts/CEOs/Marketing Managers/VPs/Subject Matter Experts from both demand and supply side to get a 360-degree view of the market. The primary team conducts several interviews based on the complexity of the markets to understand the various market trends and dynamics which makes research more credible and precise.

A typical research interview fulfils the following functions:

  • Provides first-hand information on the market size, market trends, growth trends, competitive landscape, and outlook
  • Validates and strengthens in-house secondary research findings
  • Develops the analysis team’s expertise and market understanding

Primary research involves email interactions and telephone interviews for each market, category, segment, and sub-segment across geographies. The participants who typically take part in such a process include, but are not limited to:

  • Industry participants: VPs, business development managers, market intelligence managers and national sales managers
  • Outside experts: Valuation experts, research analysts and key opinion leaders specializing in the electronics and semiconductor industry.

Below is the breakup of our primary respondents by company, designation, and region:

Research Methodology

Once we receive the confirmation from primary research sources or primary respondents, we finalize the base year market estimation and forecast the data as per the macroeconomic and microeconomic factors assessed during data collection.

  1. Data Analysis:

Once data is validated through both secondary as well as primary respondents, we finalize the market estimations by hypothesis formulation and factor analysis at regional and country level.

  • Macro-Economic Factor Analysis:

We analyse macroeconomic indicators such the gross domestic product (GDP), increase in the demand for goods and services across industries, technological advancement, regional economic growth, governmental policies, the influence of COVID-19, PEST analysis, and other aspects. This analysis aids in setting benchmarks for various nations/regions and approximating market splits. Additionally, the general trend of the aforementioned components aid in determining the market's development possibilities.

  • Country Level Data:

Various factors that are especially aligned to the country are taken into account to determine the market size for a certain area and country, including the presence of vendors, such as headquarters and offices, the country's GDP, demand patterns, and industry growth. To comprehend the market dynamics for the nation, a number of growth variables, inhibitors, application areas, and current market trends are researched. The aforementioned elements aid in determining the country's overall market's growth potential.

  • Company Profile:

The “Table of Contents” is formulated by listing and analyzing more than 25 - 30 companies operating in the market ecosystem across geographies. However, we profile only 10 companies as a standard practice in our syndicate reports. These 10 companies comprise leading, emerging, and regional players. Nonetheless, our analysis is not restricted to the 10 listed companies, we also analyze other companies present in the market to develop a holistic view and understand the prevailing trends. The “Company Profiles” section in the report covers key facts, business description, products & services, financial information, SWOT analysis, and key developments. The financial information presented is extracted from the annual reports and official documents of the publicly listed companies. Upon collecting the information for the sections of respective companies, we verify them via various primary sources and then compile the data in respective company profiles. The company level information helps us in deriving the base number as well as in forecasting the market size.

  • Developing Base Number:

Aggregation of sales statistics (2020-2022) and macro-economic factor, and other secondary and primary research insights are utilized to arrive at base number and related market shares for 2022. The data gaps are identified in this step and relevant market data is analyzed, collected from paid primary interviews or databases. On finalizing the base year market size, forecasts are developed on the basis of macro-economic, industry and market growth factors and company level analysis.

  1. Data Triangulation and Final Review:

The market findings and base year market size calculations are validated from supply as well as demand side. Demand side validations are based on macro-economic factor analysis and benchmarks for respective regions and countries. In case of supply side validations, revenues of major companies are estimated (in case not available) based on industry benchmark, approximate number of employees, product portfolio, and primary interviews revenues are gathered. Further revenue from target product/service segment is assessed to avoid overshooting of market statistics. In case of heavy deviations between supply and demand side values, all thes steps are repeated to achieve synchronization.

We follow an iterative model, wherein we share our research findings with Subject Matter Experts (SME’s) and Key Opinion Leaders (KOLs) until consensus view of the market is not formulated – this model negates any drastic deviation in the opinions of experts. Only validated and universally acceptable research findings are quoted in our reports.

We have important check points that we use to validate our research findings – which we call – data triangulation, where we validate the information, we generate from secondary sources with primary interviews and then we re-validate with our internal data bases and Subject matter experts. This comprehensive model enables us to deliver high quality, reliable data in shortest possible time.