出張・経費管理ソフトウェア市場の概要、成長、傾向、分析、調査レポート(2023-2031)
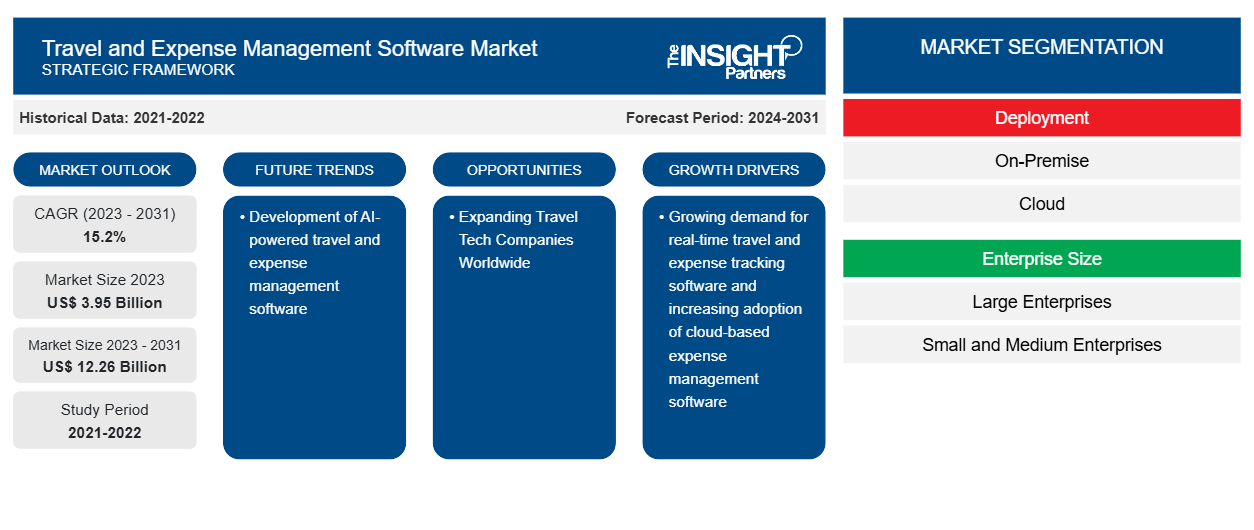
過去データ : 2021-2022 | 基準年 : 2023 | 予測期間 : 2024-2031旅行・経費管理ソフトウェア市場の規模と予測(2021年~2031年)、世界および地域のシェア、トレンド、成長機会分析レポートの対象範囲:導入モード(オンプレミスおよびクラウド)、組織規模(大企業および中小企業)、業界(BFSI、ITおよび通信、製造、ヘルスケア、政府および防衛、小売、運輸および物流、その他)、および地域別
- ステータス : 出版
- レポートコード : TIPRE00004361
- カテゴリー : テクノロジー、メディア、通信
- ページ数 : 207
- 利用可能なレポート形式 :


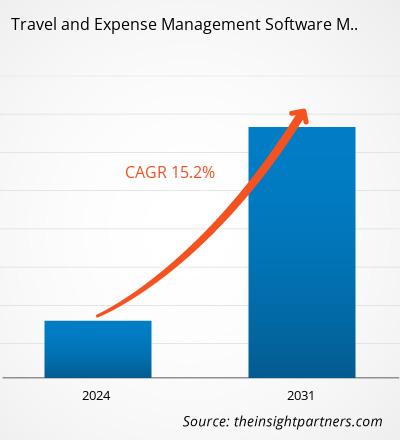
出張・経費管理ソフトウェアの市場規模は、2023年の39億5,000万米ドルから2031年には122億6,000万米ドルに達すると予想されています。市場は2023年から2031年にかけて15.2%のCAGRを記録すると予測されています。世界中で旅行テクノロジー企業の拡大が、引き続き主要な市場トレンドとなると思われます。
出張・経費管理ソフトウェア市場分析
デジタルトランスフォーメーションの拡大、多岐にわたる活動の増加、そして複数の企業のグローバル展開の拡大により、出張者数が増加し、世界の旅行および関連経費管理市場を牽引しています。テクノロジーベースの旅行会社の成長と、安全な取引のためのブロックチェーン技術の採用の増加は、旅行および経費管理ソフトウェア市場の成長の機会を生み出すと予想される主な要因です。
出張・経費管理ソフトウェア市場の概要
出張および経費管理ソフトウェアは、ユーザーが出張関連の経費を管理するのに役立つツールです。すべての従業員の領収書を追跡することで、雇用主が手間をかけずに請求や払い戻しを行えるように設計されています。このソフトウェアには通常、出張の予約、経費の追跡、払い戻しの承認ワークフローを容易にする重要な機能が含まれています。ユーザーはスマートフォンを使用して領収書の電子コピーを保存し、一元化されたダッシュボードにアップロードできます。これらの領収書は割り当てられた承認者にルーティングされ、その後、支払いのための払い戻し小切手のスケジュールが設定されます。このように、出張および経費管理ソフトウェアソリューションは、ユーザーが手作業で面倒な作業を減らし、紙の使用を排除するのに役立ちます。さらに、このソフトウェアを使用すると、ビジネスマンは従業員が行った全体的な経費を統合的に把握できるため、予算を管理し、ポリシーのコンプライアンスを推進できます。また、単一のプラットフォームで大量の経費データを分析および監視するためにも使用され、時間と費用を節約できます。あらゆる種類のビジネスが、企業の出張経費を管理するために出張および経費管理ソフトウェアを使用できます。さらに、出張および経費管理ソフトウェアは、支出パターンに関する洞察を企業に提供し、予算をより効果的に管理するのに役立ちます。このソフトウェアは、従業員の出張手配の整理と旅程の作成をサポートし、構造化されたデータ管理方法を提供します。
要件に合わせてレポートをカスタマイズする
このレポートの一部、国レベルの分析、Excelデータパックなど、あらゆるレポートを無料でカスタマイズできます。また、スタートアップや大学向けのお得なオファーや割引もご利用いただけます。
出張・経費管理ソフトウェア市場:戦略的洞察
-
このレポートの主要な市場動向を入手してください。この無料サンプルには、市場動向から見積もりや予測に至るまでのデータ分析が含まれます。
出張・経費管理ソフトウェア市場の推進要因と機会
リアルタイムの出張・経費追跡ソフトウェアの需要増加
世界中の企業は、財務業務の俊敏性と透明性を維持するために、リアルタイムの経費追跡ソフトウェアを強く求めています。この機能により、企業は支出を即座に把握できるため、プロアクティブな予算管理が可能になります。このソフトウェアを使用すると、従業員はモバイルアプリを使用して領収書の写真を撮り、情報を即座に取得できるため、経費を即座に記録して提出できます。これにより、領収書の紛失の可能性が減るだけでなく、承認と払い戻しのプロセスがスムーズになります。さらに、リアルタイムの経費追跡ソフトウェアは、財務チームに最新のデータを提供し、企業ポリシーのコンプライアンスを監視することで、不正を迅速に特定できます。このソフトウェアは、財務チームが正確な財務予測を行うのにも役立ち、企業に財務コミットメントの継続的な概要を提供します。リアルタイムの経費追跡ソフトウェアの需要は、世界中の企業の間で継続的に高まっています。今日、ビジネスマンは、市場プレーヤーが顧客の要件に基づいて経費管理プラットフォームを開発および強化することを奨励するオールインワンの旅行プラットフォームに対する要件を高めています。たとえば、2024年7月、BCD Travel Services BVは、中小企業向けのオールインワンの旅行プラットフォームであるGetGoingを発表しました。 GetGoing プラットフォームにより、企業は経費をデジタル化し、紙の使用を不要にし、手間のかからない出張および経費処理を促進できます。
AIを活用した出張・経費管理ソフトウェアの開発
自動化の進化と、出張経費管理ソフトウェアへの人工知能 (AI) の統合により、出張および経費管理ソフトウェア市場が変革しています。出張経費管理ソフトウェアへの AI の統合により、企業は反復的なタスクを自動化し、出張および経費管理手順を合理化し、経費の追跡と承認に必要な手作業の量を減らすことができます。たとえば、データ入力や領収書の照合などの反復的なタスクは、エラーを減らし、従業員が他の重要なタスクを実行する時間を増やすことで、自動化して効果的に完了できます。さらに、AI はインテリジェントな洞察と予測分析を提供し、予算要件を予測し、支出傾向を調べることでコスト削減の領域を特定します。これにより、デジタル変革に重点を置く企業の間で AI の採用が増加します。たとえば、2024 年 5 月、Yatra Online Private Limited は、中小企業および大企業向けの新しい経費管理ソリューションを開始して、サービスを強化しました。同社は、ミスを減らして時間を節約するために、徹底的かつ正確な経費追跡を保証する生成 AI 搭載の経費管理ソリューションを開発しました。このソリューションは、出張予約経費追跡のシームレスな統合も提供し、企業が出張費と出張費以外の経費を管理するのに役立ちます。同社は、ユーザーが領収書を分析し、経費の正確な追跡を保証するのに役立つ大規模言語モデル(LLM)を使用して経費管理ソリューションを開発する予定です。同様に、2023年9月には、出張および経費管理のリーダーであるEmburse, Inc.が、経費管理を自動化するためのAI搭載の領収書スキャンエンジンをリリースしました。このリリースは、Emburseの100%自動化された経費管理の目標をサポートしています。このソリューションは、プロセス全体を自動化し、人間の関与を必要とせずにエラーのないトランザクションをサポートしました。したがって、AIを搭載したテクノロジーを実装することで、企業は払い戻しサイクルの迅速化、データ管理の精度向上、ビジネス成果の向上、運用コストの削減を期待できます。
出張・経費管理ソフトウェア市場レポートのセグメンテーション分析
出張および経費管理ソフトウェア市場分析の導出に貢献した主要なセグメントは、展開モード、組織の規模、および業界です。
- 展開モードに基づいて、市場はクラウドとオンプレミスに分かれています。クラウドセグメントは2023年に大きな市場シェアを占めました。
- 組織規模に基づいて、市場は大企業と中小企業に分割されています。大企業セグメントは、2023年により大きな出張および経費管理ソフトウェア市場シェアを占めました。
- 業界別に見ると、市場はBFSI、ITおよび通信、製造、ヘルスケア、政府および防衛、小売、運輸および物流、その他に分かれています。BFSIセグメントは、2023年に最大の出張および経費管理ソフトウェア市場シェアを占めました。
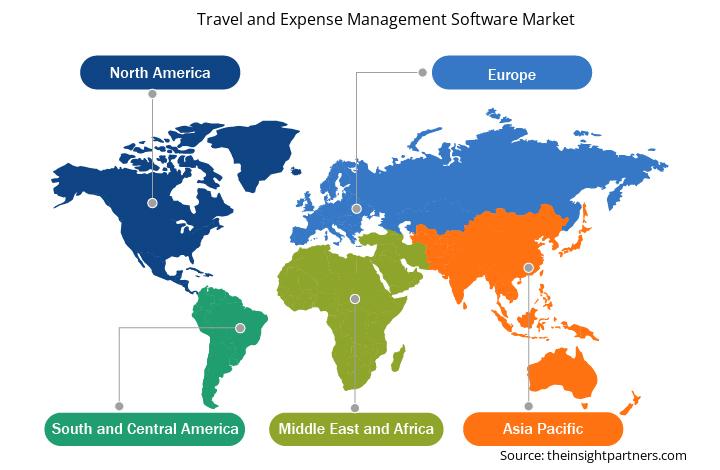
地域別の出張・経費管理ソフトウェア市場シェア分析
出張・経費管理ソフトウェア市場は、北米、ヨーロッパ、アジア太平洋 (APAC)、中東およびアフリカ (MEA)、南米および中米の 5 つの主要地域に分かれています。2023 年には北米が市場を支配し、ヨーロッパとアジア太平洋がそれに続きました。
北米の出張・経費管理ソフトウェア市場は、カナダ、米国、メキシコに分かれています。過去 10 年間、北米の IT および通信、製造、観光業界は、テクノロジーの導入と進歩、デジタル化とオンライン サービスの需要の増加、地域全体での複数の高度なソフトウェアの導入などの要因により、驚異的な成長を遂げてきました。従業員による国内外の訪問の増加、出張・経費管理ソフトウェアによる手間のかからない請求と払い戻しが、市場全体の成長を牽引しています。
ヨーロッパには、新しいテクノロジーの採用と適用を好む先進国がいくつかあります。また、IT および通信、製造、小売、輸送および物流などの確立された産業が存在するため、この地域では出張および経費管理ソフトウェアが普及しています。ヨーロッパの出張および経費管理ソフトウェア市場は、強力なデータ保護規制、地域のコンプライアンスニーズ、国境を越えた事業運営、GDPR コンプライアンス、国際ビジネス旅行により成長しています。アジア太平洋の出張および経費管理ソフトウェア市場は、予測期間中に目覚ましい成長を遂げると予測されています。アジア太平洋は、さまざまな経済、技術、ビジネス要因の結果として急速な拡大を遂げています。アジア太平洋が世界的な経済大国になるにつれて、出張および経費管理ソフトウェアの需要は継続的に高まっています。
出張・経費管理ソフトウェア市場の地域別分析
予測期間を通じて出張および経費管理ソフトウェア市場に影響を与える地域的な傾向と要因は、Insight Partners のアナリストによって徹底的に説明されています。このセクションでは、北米、ヨーロッパ、アジア太平洋、中東およびアフリカ、南米および中米にわたる出張および経費管理ソフトウェア市場のセグメントと地域についても説明します。
- 出張・経費管理ソフトウェア市場の地域別データを入手
出張・経費管理ソフトウェア市場レポートの範囲
| レポート属性 | 詳細 |
|---|---|
| 2023年の市場規模 | 39億5千万米ドル |
| 2031年までの市場規模 | 122.6億米ドル |
| 世界のCAGR(2023年~2031年) | 15.2% |
| 履歴データ | 2021-2022 |
| 予測期間 | 2024-2031 |
| 対象セグメント |
展開別
|
| 対象地域と国 |
北米
|
| 市場リーダーと主要企業プロフィール |
|
出張・経費管理ソフトウェア市場のプレーヤー密度:ビジネスダイナミクスへの影響を理解する
旅行および経費管理ソフトウェア市場は、消費者の嗜好の変化、技術の進歩、製品の利点に対する認識の高まりなどの要因により、エンドユーザーの需要が高まり、急速に成長しています。需要が高まるにつれて、企業は提供内容を拡大し、消費者のニーズを満たすために革新し、新たなトレンドを活用し、市場の成長をさらに促進しています。
市場プレーヤー密度とは、特定の市場または業界内で活動している企業または会社の分布を指します。これは、特定の市場スペースに、その市場規模または総市場価値に対してどれだけの競合相手 (市場プレーヤー) が存在するかを示します。
出張・経費管理ソフトウェア市場で事業を展開している主要企業は次のとおりです。
- バスウェア株式会社
- クーパソフトウェア株式会社
- 株式会社データベース
- エクスペンシファイ株式会社
- インフォア株式会社
- GBビジネスグローバル
免責事項:上記の企業は、特定の順序でランク付けされていません。
- 旅行および経費管理ソフトウェア市場のトップキープレーヤーの概要を入手
出張・経費管理ソフトウェア市場のニュースと最近の動向
出張および経費管理ソフトウェア市場は、主要な企業出版物、協会データ、データベースなどの一次および二次調査後の定性的および定量的データを収集することによって評価されます。出張および経費管理ソフトウェア市場におけるいくつかの開発を次に示します。
- ユーザーのスマートな業務運営と成長の加速を支援する AI 主導型プラットフォームのリーダーである Coupa は、中東およびアフリカ最大の金融機関である QNB グループが、同社の調達および財務業務を完全にデジタル化するために Coupa を選択したと発表しました。Coupa の統合 AI 主導型プラットフォームにより、QNB は単一のシステムですべての支出を完全に可視化および制御できるというメリットを得ています。リアルタイムの財務データに即座にアクセスし、より情報に基づいた意思決定を行って運転資本を改善できます。(出典: Coupa Software、プレスリリース、2024 年 3 月)
- DATABASICS は、世界的に著名な企業間 (B2B) 決済テクノロジー企業である TransferMate との戦略的提携および統合を発表しました。このコラボレーションにより、TransferMate の高度なグローバル決済機能が組み込まれることで、DATABASICS の経費ソリューションが強化されます。(出典: Databasics、プレスリリース、2023 年 3 月)
出張・経費管理ソフトウェア市場レポートの対象範囲と成果物
「出張・経費管理ソフトウェア市場の規模と予測(2021~2031年)」では、以下の分野を網羅した市場の詳細な分析を提供しています。
- 出張・経費管理ソフトウェアの市場規模と予測(対象範囲に含まれるすべての主要市場セグメントについて、世界、地域、国レベルで)
- 出張・経費管理ソフトウェア市場の動向、および推進要因、制約、主要な機会などの市場動向
- 詳細なPESTおよびSWOT分析
- 主要な市場動向、世界および地域の枠組み、主要プレーヤー、規制、最近の市場動向を網羅した出張および経費管理ソフトウェア市場分析
- 市場集中、ヒートマップ分析、主要プレーヤー、出張・経費管理ソフトウェア市場の最近の動向を網羅した業界展望と競争分析
- 詳細な企業プロフィール

アンキタは、テクノロジー、メディア、ICT、エレクトロニクス・半導体の各分野で8年以上の経験を持つ、ダイナミックな市場調査およびコンサルティングのプロフェッショナルです。Microsoft、Oracle、NEC、SAP、KPMG、Expeditors Internationalといったグローバルクライアントに対し、100件以上のコンサルティングおよび調査案件を主導・遂行してきました。彼女のコアコンピテンシーは、市場評価、データ分析、予測、戦略策定、競合情報、レポート作成です。
アンキタは、販売前の提案書作成やクライアントとの協議から、販売後の実用的なインサイトの提供まで、プロジェクトサイクル全体を巧みに管理することに長けています。彼女は、部門横断的なチームの管理、複雑な調査モジュールの構築、そしてクライアント固有のビジネス目標に合わせたソリューションの調整に長けています。優れたコミュニケーション能力、リーダーシップ、そしてプレゼンテーション能力により、急速に変化する市場環境において、常に価値主導の成果を生み出しています。
- 過去2年間の分析、基準年、CAGRによる予測(7年間)
- PEST分析とSWOT分析
- 市場規模価値/数量 - 世界、地域、国
- 業界と競争環境
- Excel データセット
お客様の声
Insight PartnersのSCADAシステム市場レポートは包括的で、現在のトレンドと将来の予測に関する貴重な洞察が含まれています。チームは終始、非常にプロフェッショナルで、対応が早く、サポートも充実していました。私たちは彼らのサービスに非常に満足しており、強くお勧めします。
ラン・ケデム パートナー, レアリテクノロジーズ株式会社非常に特殊なソフトウェア市場に関するレポートを依頼したところ、チームは数日でレポートを作成してくれました。情報は非常に関連性が高く、分かりやすくまとめられていました。その後、レポートにいくつか修正と追加を依頼しましたが、チームは非常に迅速に対応し、1週間も経たないうちに最終レポートを受け取ることができました。
ジャン=エルヴェ・ジェン 会長, フューチャー・アナリティカ重要な市場調査と予測のために、The Insight Partnersと協力しました。彼らは機会とリスクに関する明確な洞察を提供し、私たちの計画策定に役立ちました。彼らの調査は使いやすく、確かなデータに基づいており、賢明で自信に満ちた意思決定に役立ちました。彼らを強くお勧めします。
ピユーシュ・ナグパル 上級副社長, ハイビームグローバルInsight Partnersは、深い専門知識に基づき、洞察力に富み、構造化された市場調査を提供しました。チームは終始プロフェッショナルで、対応力も抜群でした。ユーザーフレンドリーなウェブサイトにより、業界レポートへのアクセスもスムーズでした。信頼性の高い高品質な調査サービスをお探しなら、Insight Partnersを強くお勧めします。
安達幸彦 最高経営責任者(CEO), ディープブルーLLC。The Insight Partnersから市場レポートを購入するのは今回が初めてです。最初は不安でしたが、ウェブサイトを見て、リスクを負ってでも購入してみようという気持ちになりました。レポートの品質とカスタマーサービスには大変満足しています。最初のレポートにはいくつか質問やコメントがありましたが、アナリストとメールで何度かやり取りした結果、戦略策定プロセスへのインプットとして活用できるレポートが完成しました。貴重なお時間を割いていただき、貴重な体験をさせていただき、誠にありがとうございました。他の方にもぜひお勧めしたいですし、今後さらに市場データが必要になった際には、まずThe Insight Partnersにご連絡させていただきます。
ジョン・スズキ 社長兼最高経営責任者、取締役, BKテクノロジーズナイジェリアの感染症IVD市場に関する情報提供依頼に対し、ご対応いただいた際、ご尽力とプロフェッショナルな姿勢に深く感謝申し上げます。忍耐強く、的確なアドバイスをいただき、また、最終的に取引成立に至った割引のご提供にも深く感謝申し上げます。今回の最初の出会いで得た強い印象のおかげで、今後もThe Insight Partnersとの連携を心待ちにしております。
チジオケ博士 オニア マネージングディレクター, パインクレストヘルスケア株式会社購入理由
- 情報に基づいた意思決定
- 市場動向の理解
- 競合分析
- 顧客インサイト
- 市場予測
- リスク軽減
- 戦略計画
- 投資の正当性
- 新興市場の特定
- マーケティング戦略の強化
- 業務効率の向上
- 規制動向への対応


 無料サンプルを入手 - 出張・経費管理ソフトウェア市場