데이터 센터 변전소 시장 분석 및 예측(크기, 점유율, 성장, 동향 2031)
이전 데이터 : 2021-2022 | 기준 연도 : 2023 | 예측 기간 : 2024-2031데이터 센터 변전소 시장 규모 및 예측(2021-2031), 글로벌 및 지역별 점유율, 추세 및 성장 기회 분석 보고서 범위: 구성 요소(변압기, 스위치기어, 릴레이 및 기타), 전압 유형(33KV-110KV, 111KV-220KV, 221KV-500KV 및 500KV 이상) 및 지역별
- 상태 : 데이터 공개
- 보고서 코드 : TIPRE00025991
- 범주 : 기술, 미디어 및 통신
- 페이지 수 : 150
- 사용 가능한 보고서 형식 :


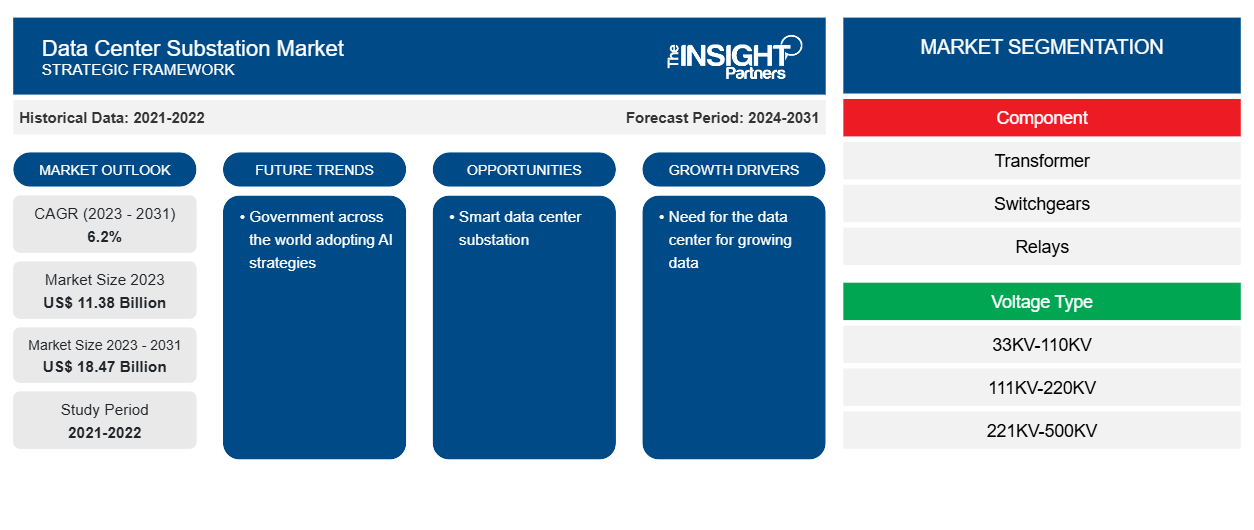
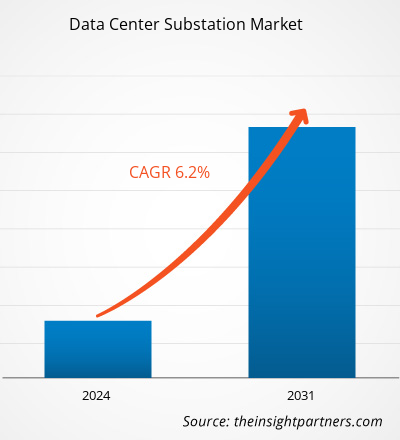
데이터 센터 변전소 시장 규모는 2023년 113억 8천만 달러에서 2031년까지 184억 7천만 달러로 성장할 것으로 예상됩니다. 이 시장은 2023~2031년 동안 6.2%의 CAGR을 기록할 것으로 예상됩니다. 전 세계 데이터 센터의 성장과 데이터 센터에 대한 효율적이고 원활하며 안정적인 전력 공급에 대한 필요성은 시장의 주요 추세로 남을 가능성이 높습니다.
데이터 센터 변전소 시장 분석
전 세계적으로 증가하는 데이터 센터의 수는 효율적인 전력 공급에 대한 필요성을 촉진하고 있으며, 이는 데이터 센터 변전소 시장을 더욱 촉진합니다. 전 세계적으로 사업을 확장하는 회사는 데이터 센터를 시작하거나 콜로케이션 서비스를 선택하고 있으며, 이는 데이터 센터에 대한 필요성을 더욱 촉진합니다. 증가하는 데이터는 처리 및 분석할 수 있는 저장소에 대한 필요성을 생성하고 있으며, 이는 데이터 센터에 대한 필요성을 더욱 촉진합니다. 따라서 데이터 센터에 대한 필요성이 커지면서 데이터 센터를 구축하고 운영하는 동안 효율적인 전력 공급을 위한 데이터 센터 변전소 시장이 활성화되고 있습니다.
데이터 센터 변전소 시장 개요
데이터 센터 변전소는 생산에서 소비로 에너지를 전달하는 전력망에서 중요한 역할을 하는 시설입니다. 변전소는 장비를 고장이나 단락으로부터 보호하고 전력선과 장비의 손상을 방지하는 데 도움이 됩니다. 데이터 센터 공급업체는 유틸리티 공급업체에 연락하여 캠퍼스에 변전소를 건설하거나 건설하여 데이터 센터에 전달합니다.
귀하의 요구 사항에 맞게 이 보고서를 사용자 정의하세요
이 보고서의 일부 또는 국가 수준 분석, Excel 데이터 팩을 포함하여 모든 보고서에 대한 사용자 정의를 무료로 받을 수 있으며 신생 기업 및 대학을 위한 훌륭한 혜택과 할인 혜택을 이용할 수 있습니다.
데이터 센터 변전소 시장: 전략적 통찰력
-
이 보고서의 주요 시장 동향을 알아보세요.이 무료 샘플에는 시장 동향부터 추정 및 예측까지 다양한 데이터 분석이 포함됩니다.
데이터 센터 변전소 시장 동인 및 기회
시장 호조를 위해 데이터 증가에 따른 데이터 센터 필요성
데이터는 더 빠른 속도로 생성됩니다. 인터넷 보급률의 증가는 데이터 생성을 촉진했습니다. 전 세계의 기업은 효율적인 비즈니스 성장을 위해 데이터 중심의 전략적 계획에 의존하고 있습니다. 또한 IoT는 실시간으로 처리, 저장 및 분석해야 하는 엄청난 양의 데이터를 생성합니다. 5G의 배포는 4G 및 기타 네트워크보다 훨씬 더 많은 데이터와 더 낮은 대기 시간을 제공하므로 데이터 트래픽 양을 크게 증가시킬 것으로 예상됩니다. Cisco 보고서에 따르면 5G는 2023년까지 전 세계 모바일 연결의 10% 이상을 지원할 것이며 평균 속도는 575Mbps입니다. 이는 오늘날의 평균 모바일 연결보다 13배 빠릅니다. 데이터 트래픽이 증가함에 따라 기업과 기업은 데이터를 보다 효율적이고 안정적으로 저장, 처리 및 배포할 위치를 찾고 데이터 센터 공급자에 대한 필요성이 높아졌습니다. 따라서 데이터 센터의 전력망을 효과적으로 관리하기 위해 데이터 센터 변전소에 대한 수요가 증가하고 있습니다.fuelled the generation of data. Businesses all over the world are relying on data-driven strategic planning for efficient business growth. In addition, IoT generates a huge number of data that needs to be processed, stored and analyzed in real-time. The deployment of 5G is expected to significantly increase the volume of data traffic, as 5G offers much higher data and lower latency than the 4G and other networks. According to the Cisco reports, 5G will support more than 10% of the world's mobile connections by 2023, with an average speed of 575 Mbps. That's 13 times faster than the average mobile connection today. Due to increased data traffic, businesses and enterprises will seek a location to store, process and distribute their data more efficiently and reliably, contributing to the need for data center providers. Thus, to manage the power grid of a data center effectively, the demand for data center substations is growing.
스마트 데이터 센터 변전소
다양한 국가의 정부는 데이터 센터 구축을 면밀히 모니터링하고 데이터 센터를 개발하고 운영하는 동안 지속 가능성을 보장하고 있습니다. 정부는 탄소 발자국을 줄이고 에너지 집약적 시설에서 발생하는 우려를 처리하는 데 중점을 두고 있습니다. 따라서 시장 참여자는 데이터 센터 산업을 효과적으로 홍보하기 위해 스마트 데이터 센터 변전소 솔루션을 구축하는 데 중점을 두고 있습니다. 예를 들어 ABB는 이러한 시설의 탄소 및 부동산 발자국을 줄이기 위해 스마트 데이터 센터 변전소를 제공합니다. 스마트 모듈식 구성 요소를 사용하여 회사는 구리 제어 케이블의 양을 50% 이상 줄일 수 있었습니다. 따라서 이러한 스마트 솔루션 구축은 데이터 센터 산업을 육성하고 효율적인 데이터 센터 변전소 시장에 대한 수요를 창출할 것입니다.
데이터 센터 변전소 시장 보고서 세분화 분석
데이터 센터 변전소 시장 분석에 기여한 주요 세그먼트는 구성 요소와 전압 유형입니다.
- 데이터 센터 변전소 시장은 구성 요소에 따라 변압기, 스위치기어, 릴레이 등으로 구분됩니다. 스위치기어 부문은 2023년에 시장 점유율이 가장 높았습니다.
- 전압 유형별로 시장은 33KV-110KV, 111KV-220KV, 221KV-500KV, 500KV 이상으로 세분화됩니다. 500KV 이상은 예측 기간 동안 상당한 CAGR로 성장할 것으로 예상됩니다.
지역별 데이터 센터 변전소 시장 점유율 분석
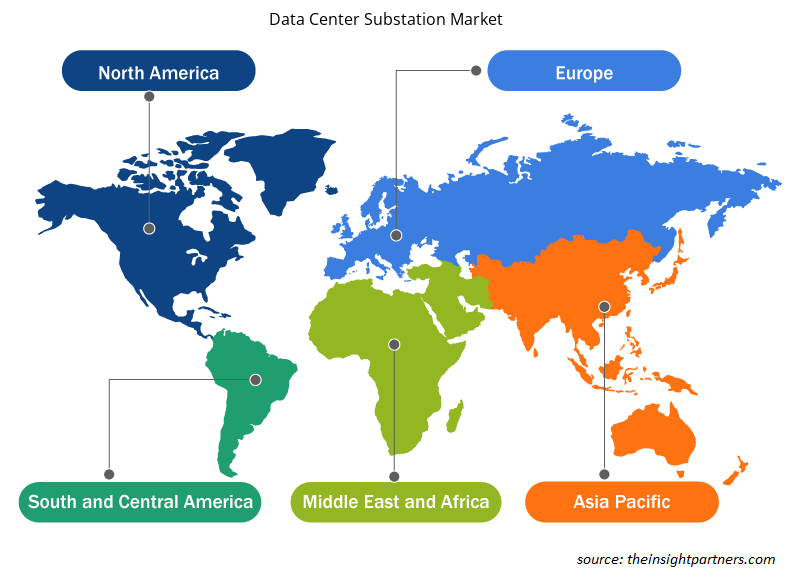
데이터 센터 변전소 시장 보고서의 지리적 범위는 주로 북미, 아시아 태평양, 유럽, 중동 및 아프리카, 남미 및 중부 아메리카의 5개 지역으로 나뉩니다.
아시아 태평양 지역은 예측 기간 동안 가장 높은 CAGR로 성장할 것으로 예상됩니다. 5G, 클라우드 컴퓨팅, 빅데이터 분석 및 기타 여러 고급 기술의 증가는 처리 및 분석이 필요한 방대한 양의 데이터를 처리합니다. 데이터 저장 및 컴퓨팅 수요 는 이 지역의 데이터 센터 시장을 육성하고 있으며, 이는 아시아 태평양의 데이터 센터 변전소 시장을 더욱 보완합니다.
데이터 센터 변전소 시장 지역 통찰력
Insight Partners의 분석가들은 예측 기간 동안 데이터 센터 변전소 시장에 영향을 미치는 지역적 추세와 요인을 철저히 설명했습니다. 이 섹션에서는 북미, 유럽, 아시아 태평양, 중동 및 아프리카, 남미 및 중미 전역의 데이터 센터 변전소 시장 세그먼트와 지리에 대해서도 설명합니다.
- 데이터 센터 변전소 시장에 대한 지역별 데이터 얻기
데이터 센터 변전소 시장 보고서 범위
| 보고서 속성 | 세부 |
|---|---|
| 2023년 시장 규모 | 113억 8천만 달러 |
| 2031년까지 시장 규모 | 184억 7천만 달러 |
| 글로벌 CAGR (2023-2031) | 6.2% |
| 역사적 데이터 | 2021-2022 |
| 예측 기간 | 2024-2031 |
| 다루는 세그먼트 |
구성 요소별로
|
| 포함된 지역 및 국가 |
북아메리카
|
| 시장 선도 기업 및 주요 회사 프로필 |
|
데이터 센터 변전소 시장 참여자 밀도: 비즈니스 역학에 미치는 영향 이해
데이터 센터 변전소 시장 시장은 소비자 선호도의 변화, 기술 발전, 제품의 이점에 대한 인식 증가와 같은 요인으로 인해 최종 사용자 수요가 증가함에 따라 빠르게 성장하고 있습니다. 수요가 증가함에 따라 기업은 제품을 확장하고, 소비자의 요구를 충족하기 위해 혁신하고, 새로운 트렌드를 활용하여 시장 성장을 더욱 촉진하고 있습니다.
시장 참여자 밀도는 특정 시장이나 산업 내에서 운영되는 회사나 기업의 분포를 말합니다. 주어진 시장 공간에 얼마나 많은 경쟁자(시장 참여자)가 존재하는지 그 규모나 전체 시장 가치에 비해 나타냅니다.
데이터 센터 변전소 시장에서 운영되는 주요 회사는 다음과 같습니다.
- 이튼
- 제너럴 일렉트릭
- 히타치 에너지 주식회사
- NEI 전력 엔지니어링 주식회사
- NR 전기
- S&C 전기회사
면책 조항 : 위에 나열된 회사는 어떤 특별한 순서에 따라 순위가 매겨지지 않았습니다.
- 데이터 센터 변전소 시장 주요 업체 개요 알아보기
데이터 센터 변전소 시장 뉴스 및 최근 개발
데이터 센터 변전소 시장은 1차 및 2차 조사 이후의 정성적, 정량적 데이터를 수집하여 평가합니다. 여기에는 중요한 기업 간행물, 협회 데이터 및 데이터베이스가 포함됩니다. 데이터 센터 변전소 시장의 몇 가지 개발 사항은 다음과 같습니다.
- 선도적인 IT 인프라 및 서비스 기업인 NTT Ltd.는 NTT Global Data Centers Corporation(NTT Ltd.의 자회사)을 통해 NTT Cyberjaya 캠퍼스에 새로운 데이터 센터를 오픈한다고 발표했습니다. 5,000만 달러(2억 3,400만 링깃)가 넘는 투자가 이루어진 이 시설은 말레이시아의 디지털 성장 비전과 일치하며, 2025년까지 말레이시아를 '아시아 디지털 타이거'로 만들겠다는 목표를 가지고 있습니다. NTT 캠퍼스의 여섯 번째 데이터 센터인 CBJ6는 7MW의 중요 IT 부하, 4,890m2의 공간, 다양한 전력 수신을 갖춘 2개의 33kV 변전소, 최대 15kW의 고밀도 랙에 안정적인 환경을 유지하기 위한 고급 냉각벽 기술을 갖추고 있습니다. CBJ6는 2021년에 건설된 Cyberjaya 5(CBJ5) 데이터 센터를 보완하며, 이 시설은 20,000m2의 공간과 22MW의 시설 부하를 갖추고 있습니다. (출처: NTT Ltd, 보도자료, 2023년 10월)
- 하이퍼스케일 및 대규모 엔터프라이즈 데이터 센터 솔루션의 글로벌 공급업체인 Colt Data Centre Services(DCS)가 인도에서 첫 번째 데이터 센터를 출범한다고 발표했습니다. 플래그십 Navi Mumbai 데이터 센터는 Colt DCS의 전략적 확장과 빠르게 성장하는 인도 데이터 센터 시장에서 하이퍼스케일 클라우드 서비스 공급업체와 대규모 엔터프라이즈 기업의 증가하는 수요를 지원하려는 노력을 나타냅니다. 이 데이터 센터는 LILO 구성으로 현장에 매우 회복성이 뛰어난 220kV GIS 변전소를 자랑합니다. (출처: Colt Data Centre Services Holdings, 보도자료, 2023년 9월)
데이터 센터 변전소 시장 보고서 범위 및 제공물
"데이터 센터 변전소 시장 규모 및 예측(2021-2031)" 보고서는 아래 영역을 포괄하는 시장에 대한 자세한 분석을 제공합니다.
- 범위에 포함된 모든 주요 시장 세그먼트에 대한 글로벌, 지역 및 국가 수준의 데이터 센터 변전소 시장 규모 및 예측
- 데이터 센터 변전소 시장 동향과 동인, 제약 및 주요 기회와 같은 시장 역학
- 자세한 PEST/포터의 5가지 힘 및 SWOT 분석
- 주요 시장 동향, 글로벌 및 지역 프레임워크, 주요 업체, 규정 및 최근 시장 개발 사항을 포괄하는 데이터 센터 변전소 시장 분석
- 데이터 센터 변전소 시장의 시장 집중도, 히트맵 분석, 유명 업체 및 최근 개발 사항을 다루는 산업 환경 및 경쟁 분석
- 자세한 회사 프로필

안키타는 기술, 미디어, 정보통신기술(ICT), 전자 및 반도체 분야에서 8년 이상의 경력을 보유한 역동적인 시장 조사 및 컨설팅 전문가입니다. Microsoft, Oracle, NEC Corporation, SAP, KPMG, Expeditors International 등 글로벌 고객을 대상으로 100건 이상의 컨설팅 및 조사 업무를 성공적으로 이끌고 수행했습니다. 그녀의 핵심 역량은 시장 평가, 데이터 분석, 예측, 전략 수립, 경쟁 정보 분석, 보고서 작성입니다.
안키타는 사전 판매 제안서 설계 및 고객 논의부터 실행 가능한 인사이트의 사후 판매까지 전체 프로젝트 주기를 능숙하게 처리합니다. 또한, 여러 부서의 팀을 관리하고, 복잡한 조사 모듈을 구성하며, 고객별 비즈니스 목표에 맞춰 솔루션을 조정하는 데 능숙합니다. 뛰어난 의사소통, 리더십, 그리고 프레젠테이션 능력을 바탕으로 빠르게 변화하는 시장 환경에서도 가치 중심의 성과를 꾸준히 달성해 왔습니다.
- 과거 분석(2년), 기준 연도, CAGR을 포함한 예측(7년)
- PEST 및 SWOT 분석
- 시장 규모 가치/거래량 - 글로벌, 지역, 국가
- 산업 및 경쟁 환경
- Excel 데이터세트
사용 후기
Insight Partners의 SCADA 시스템 시장 보고서는 포괄적이며, 현재 동향과 미래 전망에 대한 귀중한 통찰력을 제공합니다. 팀은 매우 전문적이고, 신속하게 대응하며, 처음부터 끝까지 지원해 주었습니다. 저희는 매우 만족하며 Insight Partners의 서비스를 적극 추천합니다.
란 케뎀 파트너, Reali Technologies LTDs아주 구체적인 소프트웨어 시장에 대한 보고서를 요청했는데, 팀에서 며칠 만에 보고서를 작성해 주셨습니다. 정보는 매우 관련성이 높고 잘 정리되어 있었습니다. 그 후 보고서에 몇 가지 수정과 추가 사항을 요청했습니다. 팀원들의 응답도 매우 빨랐고, 일주일도 채 되지 않아 최종 보고서를 받았습니다.
장-에르브 젠 의장, 퓨처 애널리티카The Insight Partners와 함께 중요한 시장 조사 및 예측 작업을 진행했습니다. Insight Partners는 기회와 위험에 대한 명확한 통찰력을 제공하여 계획을 세우는 데 큰 도움이 되었습니다. The Insight Partners의 조사는 사용하기 쉬웠고, 탄탄한 데이터를 기반으로 했습니다. 덕분에 현명하고 자신 있는 결정을 내릴 수 있었습니다. The Insight Partners를 강력 추천합니다.
피유시 나그팔 수석 부사장, 하이빔 글로벌Insight Partners는 탄탄한 분야 전문성을 바탕으로 통찰력 있고 체계적인 시장 조사를 제공했습니다. Insight Partners 팀은 처음부터 끝까지 전문적이고 신속하게 대응했습니다. 사용자 친화적인 웹사이트 덕분에 업계 보고서에 쉽게 접근할 수 있었습니다. 신뢰할 수 있고 고품질의 조사 서비스를 원하신다면 Insight Partners를 강력 추천합니다.
아다치 유키히코 대표이사, 딥블루 주식회사The Insight Partners에서 시장 보고서를 구매한 것은 이번이 처음입니다. 처음에는 확신이 없었지만, 웹사이트를 방문하고 나서 위험을 감수하고 시장 보고서를 구매하는 것이 더 편하다는 것을 알게 되었습니다. 보고서의 품질과 고객 서비스에 매우 만족합니다. 처음 보고서를 보고 몇 가지 질문과 의견이 있었지만, 분석가와 이메일로 몇 차례 대화를 나눈 후, 전략 기획 과정에 참고할 수 있는 보고서를 확보했다고 생각합니다. 시간을 내어 긍정적인 경험을 선사해 주셔서 정말 감사합니다. 다른 사람들에게도 귀사의 서비스를 적극 추천할 것이며, 추가적인 시장 데이터가 필요할 때면 가장 먼저 귀사에 연락하겠습니다.
존 스즈키 사장 겸 최고 경영자, 이사회 이사, BK 테크놀로지스나이지리아 감염성 질환 IVD 시장 관련 정보 요청에 응해 주신 귀사의 지원과 전문성에 감사드립니다. 귀사의 인내심과 지도, 그리고 할인 혜택을 기꺼이 제공해 주셔서 결국 계약을 성사시킬 수 있었습니다. 첫 만남을 통해 귀사가 저에게 심어주신 좋은 인상을 바탕으로 앞으로도 The Insight Partners와 함께할 수 있기를 기대합니다.
치지오케 박사 오니아 전무이사, 파인크레스트 헬스케어 유한회사구매 이유
- 정보에 기반한 의사 결정
- 시장 역학 이해
- 경쟁 분석
- 고객 인사이트
- 시장 예측
- 위험 완화
- 전략 기획
- 투자 타당성 분석
- 신흥 시장 파악
- 마케팅 전략 강화
- 운영 효율성 향상
- 규제 동향에 발맞춰 대응


 무료 샘플 받기 - 데이터 센터 변전소 시장