Análisis y pronóstico del mercado de subestaciones de centros de datos por tamaño, participación, crecimiento y tendencias para 2031
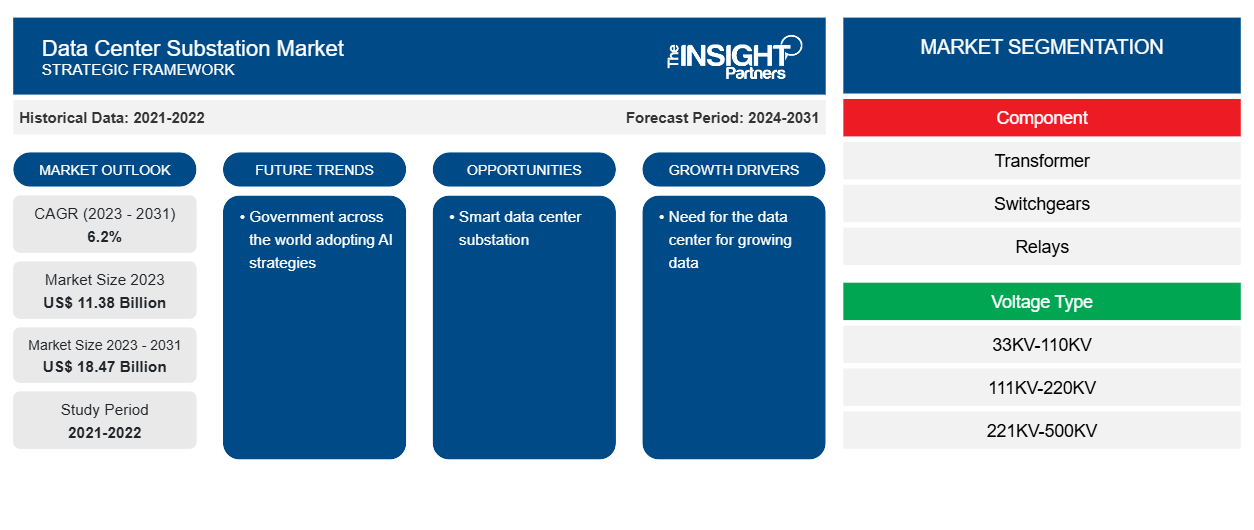
Datos históricos : 2021-2022 | Año base : 2023 | Período de pronóstico : 2024-2031Tamaño y pronóstico del mercado de subestaciones para centros de datos (2021-2031), participación global y regional, tendencias y análisis de oportunidades de crecimiento. Cobertura del informe: por componente (transformador, cuadros de distribución, relés y otros), tipo de voltaje (33 kV-110 kV, 111 kV-220 kV, 221 kV-500 kV y más de 500 kV) y geografía.
- Estado : Datos publicados
- Código de informe : TIPRE00025991
- Categoría : Tecnología, medios y telecomunicaciones
- Número de páginas : 150
- Formatos de informe disponibles :


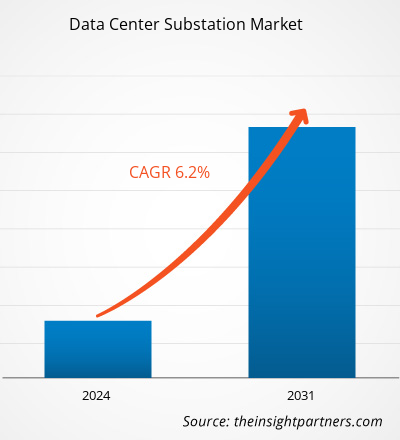
Se proyecta que el tamaño del mercado de subestaciones de centros de datos alcance los 18.470 millones de dólares estadounidenses en 2031, frente a los 11.380 millones de dólares estadounidenses en 2023. Se espera que el mercado registre una CAGR del 6,2 % durante el período 2023-2031. Es probable que el crecimiento de los centros de datos en todo el mundo y la necesidad de un suministro de energía eficiente, fluido y confiable para los centros de datos sigan siendo tendencias clave en el mercado.
Análisis del mercado de subestaciones para centros de datos
El creciente número de centros de datos en todo el mundo está impulsando la necesidad de un suministro de energía eficiente, lo que fomenta aún más el mercado de subestaciones para centros de datos. Las empresas que expanden sus negocios en todo el mundo están lanzando su centro de datos o recurriendo a servicios de coubicación, lo que impulsa aún más la necesidad de centros de datos. El aumento de los datos está generando la necesidad de almacenamiento donde se puedan procesar y analizar, lo que fomenta aún más la necesidad de centros de datos. Por lo tanto, la creciente necesidad de centros de datos está impulsando el mercado de subestaciones para centros de datos para el suministro de energía eficiente durante la construcción y el funcionamiento del centro de datos.
Descripción general del mercado de subestaciones para centros de datos
Una subestación de un centro de datos es una instalación que desempeña un papel fundamental en la red eléctrica, ya que transfiere energía desde la producción hasta el consumo. La subestación ayuda a proteger los equipos de fallas o cortocircuitos y evita daños en las líneas eléctricas y los equipos. Los proveedores de centros de datos se comunican con el proveedor de servicios públicos para construir una subestación en su campus o para construir una y entregarla al centro de datos.
Personalice este informe según sus necesidades
Obtendrá personalización en cualquier informe, sin cargo, incluidas partes de este informe o análisis a nivel de país, paquete de datos de Excel, así como también grandes ofertas y descuentos para empresas emergentes y universidades.
Mercado de subestaciones para centros de datos: perspectivas estratégicas
-
Obtenga las principales tendencias clave del mercado de este informe.Esta muestra GRATUITA incluirá análisis de datos, desde tendencias del mercado hasta estimaciones y pronósticos.
Factores impulsores y oportunidades del mercado de subestaciones para centros de datos
Necesidad del centro de datos para el crecimiento de los datos para favorecer el mercado
Los datos se generan a un ritmo más rápido. El aumento de la penetración de Internet ha impulsado la generación de datos. Las empresas de todo el mundo confían en la planificación estratégica basada en datos para un crecimiento empresarial eficiente. Además, IoT genera una gran cantidad de datos que deben procesarse, almacenarse y analizarse en tiempo real. Se espera que la implementación de 5G aumente significativamente el volumen de tráfico de datos, ya que 5G ofrece datos mucho más altos y una latencia más baja que 4G y otras redes. Según los informes de Cisco, 5G soportará más del 10% de las conexiones móviles del mundo para 2023, con una velocidad promedio de 575 Mbps. Eso es 13 veces más rápido que la conexión móvil promedio actual. Debido al aumento del tráfico de datos, las empresas y las empresas buscarán una ubicación para almacenar, procesar y distribuir sus datos de manera más eficiente y confiable, lo que contribuye a la necesidad de proveedores de centros de datos. Por lo tanto, para administrar la red eléctrica de un centro de datos de manera efectiva, la demanda de subestaciones de centros de datos está creciendo.
Subestación de centro de datos inteligente
Los gobiernos de varios países están supervisando de cerca la construcción de centros de datos y garantizando la sostenibilidad durante el desarrollo y el trabajo en centros de datos. El gobierno se centra en reducir su huella de carbono y abordar las preocupaciones que surgen de las instalaciones de alto consumo energético. Por lo tanto, los actores del mercado se centran en la construcción de soluciones de subestaciones de centros de datos inteligentes para promover la industria de los centros de datos de manera efectiva. Por ejemplo, ABB proporciona subestaciones de centros de datos inteligentes para reducir la huella de carbono y de bienes raíces de estas instalaciones. Al utilizar componentes modulares inteligentes, la empresa pudo reducir la cantidad de cables de control de cobre en más del 50%. Por lo tanto, la construcción de soluciones inteligentes promoverá la industria de los centros de datos y generará la demanda de un mercado de subestaciones de centros de datos eficiente.
Análisis de segmentación del informe de mercado de subestaciones de centros de datos
Los segmentos clave que contribuyeron a la derivación del análisis del mercado de subestaciones del centro de datos son el componente y el tipo de voltaje.
- Según el componente, el mercado de subestaciones de centros de datos se divide en transformadores, cuadros de distribución, relés y otros. El segmento de cuadros de distribución tuvo la mayor participación del mercado en 2023.
- Por tipo de voltaje, el mercado está segmentado en 33KV-110KV, 111KV-220KV, 221KV-500KV y más de 500KV. Se espera que los más de 500KV crezcan con una CAGR significativa durante el período de pronóstico.
Análisis de la cuota de mercado de las subestaciones de centros de datos por geografía
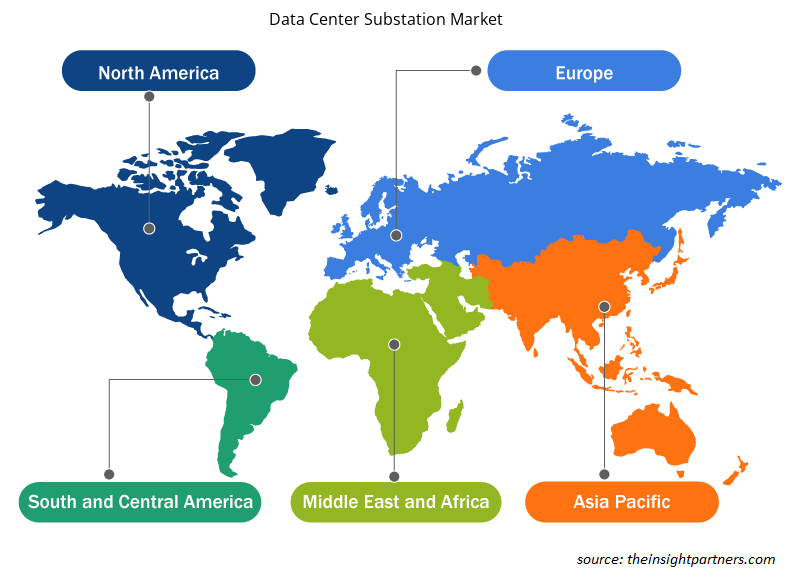
El alcance geográfico del informe del mercado de subestaciones del centro de datos se divide principalmente en cinco regiones: América del Norte, Asia Pacífico, Europa, Medio Oriente y África, y América del Sur y Central.
Se espera que la región de Asia Pacífico crezca con la CAGR más alta durante el período de pronóstico. El auge de 5G, computación en la nube, análisis de big data y varias otras tecnologías avanzadas funcionan en una gran escala de datos que deben procesarse y analizarse. La demanda de almacenamiento y computación de datos está impulsando el mercado de centros de datos en la región, que complementa aún más el mercado de subestaciones de centros de datos en Asia Pacífico.
Perspectivas regionales del mercado de subestaciones para centros de datos
Los analistas de Insight Partners explicaron en detalle las tendencias y los factores regionales que influyen en el mercado de subestaciones para centros de datos durante el período de pronóstico. Esta sección también analiza los segmentos y la geografía del mercado de subestaciones para centros de datos en América del Norte, Europa, Asia Pacífico, Oriente Medio y África, y América del Sur y Central.
- Obtenga datos regionales específicos para el mercado de subestaciones de centros de datos
Alcance del informe de mercado de subestaciones de centros de datos
| Atributo del informe | Detalles |
|---|---|
| Tamaño del mercado en 2023 | US$ 11.38 mil millones |
| Tamaño del mercado en 2031 | US$ 18,47 mil millones |
| CAGR global (2023 - 2031) | 6,2% |
| Datos históricos | 2021-2022 |
| Período de pronóstico | 2024-2031 |
| Segmentos cubiertos |
Por componente
|
| Regiones y países cubiertos |
América del norte
|
| Líderes del mercado y perfiles de empresas clave |
|
Densidad de actores del mercado de subestaciones de centros de datos: comprensión de su impacto en la dinámica empresarial
El mercado de subestaciones para centros de datos está creciendo rápidamente, impulsado por la creciente demanda de los usuarios finales debido a factores como la evolución de las preferencias de los consumidores, los avances tecnológicos y una mayor conciencia de los beneficios del producto. A medida que aumenta la demanda, las empresas amplían sus ofertas, innovan para satisfacer las necesidades de los consumidores y aprovechan las tendencias emergentes, lo que impulsa aún más el crecimiento del mercado.
La densidad de actores del mercado se refiere a la distribución de las empresas o firmas que operan dentro de un mercado o industria en particular. Indica cuántos competidores (actores del mercado) están presentes en un espacio de mercado determinado en relación con su tamaño o valor total de mercado.
Las principales empresas que operan en el mercado de subestaciones de centros de datos son:
- Comer
- General Electric
- Compañía: Hitachi Energy Ltd.
- Ingeniería de energía eléctrica NEI, Inc.
- NR Eléctrico
- Compañía eléctrica S&C
Descargo de responsabilidad : Las empresas enumeradas anteriormente no están clasificadas en ningún orden particular.
- Obtenga una descripción general de los principales actores clave del mercado de subestaciones de centros de datos
Noticias y desarrollos recientes del mercado de subestaciones para centros de datos
El mercado de subestaciones para centros de datos se evalúa mediante la recopilación de datos cualitativos y cuantitativos a partir de una investigación primaria y secundaria, que incluye publicaciones corporativas importantes, datos de asociaciones y bases de datos. A continuación, se enumeran algunos de los avances en el mercado de subestaciones para centros de datos:
- NTT Ltd., empresa líder en servicios e infraestructura de TI, a través de NTT Global Data Centers Corporation (una subsidiaria de NTT Ltd.), anunció el lanzamiento de su nuevo centro de datos en el campus NTT Cyberjaya. Esta instalación, con una inversión de más de 50 millones de dólares estadounidenses (234 millones de RM), se alinea con la visión de crecimiento digital de Malasia, cuyo objetivo es que Malasia sea un "tigre digital asiático" para 2025. CBJ6, el sexto centro de datos en el campus de NTT, tiene una carga crítica de TI de 7 MW, 4.890 m2 de espacio, dos subestaciones de 33 kV con recepción de energía diversa y tecnología avanzada de pared de enfriamiento para mantener un entorno estable para racks de alta densidad de hasta 15 kW. CBJ6 complementa el centro de datos Cyberjaya 5 (CBJ5), construido en 2021, la instalación combinada tiene 20.000 m2 de espacio y una carga de instalación de 22 MW. (Fuente: NTT Ltd, comunicado de prensa, octubre de 2023)
- Colt Data Centre Services (DCS), un proveedor global de soluciones de centros de datos para grandes empresas e hiperescala, anunció el lanzamiento de su primer centro de datos en India. El centro de datos insignia de Navi Mumbai marca la expansión estratégica de Colt DCS y su compromiso de respaldar la creciente demanda de proveedores de servicios en la nube a hiperescala y grandes empresas en el mercado de centros de datos de la India, que está creciendo rápidamente. El centro de datos cuenta con una subestación GIS de 220 kV altamente resistente en el sitio con configuración LILO. (Fuente: Colt Data Centre Services Holdings, comunicado de prensa, septiembre de 2023)
Informe de mercado de subestaciones de centros de datos: cobertura y resultados
El informe “Tamaño y pronóstico del mercado de subestaciones de centros de datos (2021-2031)” proporciona un análisis detallado del mercado que cubre las siguientes áreas:
- Tamaño del mercado de subestaciones de centros de datos y pronóstico a nivel global, regional y nacional para todos los segmentos clave del mercado cubiertos bajo el alcance
- Tendencias del mercado de subestaciones de centros de datos, así como dinámicas del mercado, como impulsores, restricciones y oportunidades clave
- Análisis detallado de las cinco fuerzas de Porter y PEST y FODA
- Análisis del mercado de subestaciones de centros de datos que abarca las tendencias clave del mercado, el marco global y regional, los principales actores, las regulaciones y los desarrollos recientes del mercado
- Análisis del panorama de la industria y de la competencia que abarca la concentración del mercado, el análisis de mapas de calor, los actores destacados y los desarrollos recientes para el mercado de subestaciones de centros de datos
- Perfiles detallados de empresas

Ankita es una profesional dinámica en investigación de mercados y consultoría con más de 8 años de experiencia en los sectores de tecnología, medios de comunicación, TIC, electrónica y semiconductores. Ha liderado y ejecutado con éxito más de 100 proyectos de consultoría e investigación para clientes globales como Microsoft, Oracle, NEC Corporation, SAP, KPMG y Expeditors International. Sus principales competencias incluyen la evaluación de mercado, el análisis de datos, la previsión, la formulación de estrategias, la inteligencia competitiva y la redacción de informes.
Ankita es experta en la gestión de ciclos completos de proyecto, desde el diseño de propuestas de preventa y las conversaciones con los clientes hasta la entrega de información práctica posventa. Es experta en la gestión de equipos multifuncionales, la estructuración de módulos de investigación complejos y la alineación de soluciones con los objetivos de negocio específicos del cliente. Sus excelentes habilidades de comunicación, liderazgo y presentación le han permitido obtener constantemente resultados orientados al valor en entornos de mercado dinámicos y en constante evolución.
- Análisis histórico (2 años), año base, pronóstico (7 años) con CAGR
- Análisis PEST y FODA
- Tamaño del mercado, valor/volumen: global, regional y nacional
- Industria y panorama competitivo
- Conjunto de datos de Excel
Testimonios
El informe de mercado de sistemas SCADA de Insight Partners es completo y ofrece información valiosa sobre las tendencias actuales y las previsiones futuras. El equipo fue altamente profesional, receptivo y me brindó un gran apoyo en todo momento. Estamos muy satisfechos y recomendamos ampliamente sus servicios.
RAN KEDEM Socio, Reali Technologies LTDsSolicité un informe sobre un mercado de software muy específico y el equipo lo elaboró en pocos días. La información era muy relevante y estaba bien presentada. Posteriormente, solicité algunos cambios y adiciones al informe. El equipo fue muy receptivo y recibí el informe final en menos de una semana.
JEAN-HERVE JENN Presidente, Future AnalyticaTrabajamos con The Insight Partners para un importante estudio y pronóstico de mercado. Nos brindaron una visión clara de las oportunidades y los riesgos, lo que nos ayudó a definir nuestros planes. Su investigación fue fácil de usar y se basó en datos sólidos. Nos ayudó a tomar decisiones inteligentes y seguras. Los recomendamos ampliamente.
PIYUSH NAGPAL Vicepresidente Sénior, , High Beam GlobalThe Insight Partners realizó una investigación de mercado profunda y bien estructurada con una sólida experiencia en el sector. Su equipo fue profesional y receptivo en todo momento. El sitio web, fácil de usar, facilitó el acceso a los informes del sector. Los recomendamos ampliamente por sus servicios de investigación confiables y de alta calidad.
YUKIHIKO ADACHI Director Ejecutivo, , Deep Blue, LLCEsta es la primera vez que compro un informe de mercado de The Insight Partners. Aunque al principio tenía dudas, visité su sitio web y me sentí más cómodo al arriesgarme y comprarlo. Estoy completamente satisfecho con la calidad del informe y el servicio al cliente. Tenía varias preguntas y comentarios sobre el informe inicial, pero después de un par de conversaciones por correo electrónico con su analista, creo que tengo un informe que puedo usar como base para nuestro proceso de planificación estratégica. Muchas gracias por tomarse el tiempo y hacer de esta una experiencia positiva. Sin duda, recomendaré sus servicios y serán mi primera opción cuando necesitemos más datos de mercado.
JOHN SUZUKI Presidente y Director Ejecutivo, Director de la Junta Directiva, BK TechnologiesAgradezco su apoyo y la profesionalidad que demostraron al atender mi solicitud de información sobre el mercado de diagnóstico in vitro (IVD) para enfermedades infecciosas en Nigeria. Agradezco su paciencia, su orientación y su disposición a ofrecerme un descuento, lo que finalmente nos permitió cerrar un trato. Espero poder colaborar con The Insight Partners en el futuro, gracias a la impresión que me causó este primer encuentro.
DRA. CHIJIOKE ONYIA, DIRECTORA GENERAL, PineCrest Healthcare Ltd.Razón para comprar
- Toma de decisiones informada
- Comprensión de la dinámica del mercado
- Análisis competitivo
- Información sobre clientes
- Pronósticos del mercado
- Mitigación de riesgos
- Planificación estratégica
- Justificación de la inversión
- Identificación de mercados emergentes
- Mejora de las estrategias de marketing
- Impulso de la eficiencia operativa
- Alineación con las tendencias regulatorias


Desbloquea descuentos exclusivos en informes
Consultar ahora


 Obtenga una muestra gratuita para - Mercado de subestaciones de centros de datos