データセンター変電所市場の分析と予測 - 規模、シェア、成長、トレンド 2031 年
過去データ : 2021-2022 | 基準年 : 2023 | 予測期間 : 2024-2031データセンター変電所市場の規模と予測(2021年 - 2031年)、世界および地域のシェア、傾向、成長機会分析レポートの対象範囲:コンポーネント別(変圧器、配電装置、リレー、その他)、電圧タイプ別(33KV-110KV、111KV-220KV、221KV-500KV、500KV以上)、および地域別
- ステータス : 公開されたデータ
- レポートコード : TIPRE00025991
- カテゴリー : テクノロジー、メディア、通信
- ページ数 : 150
- 利用可能なレポート形式 :


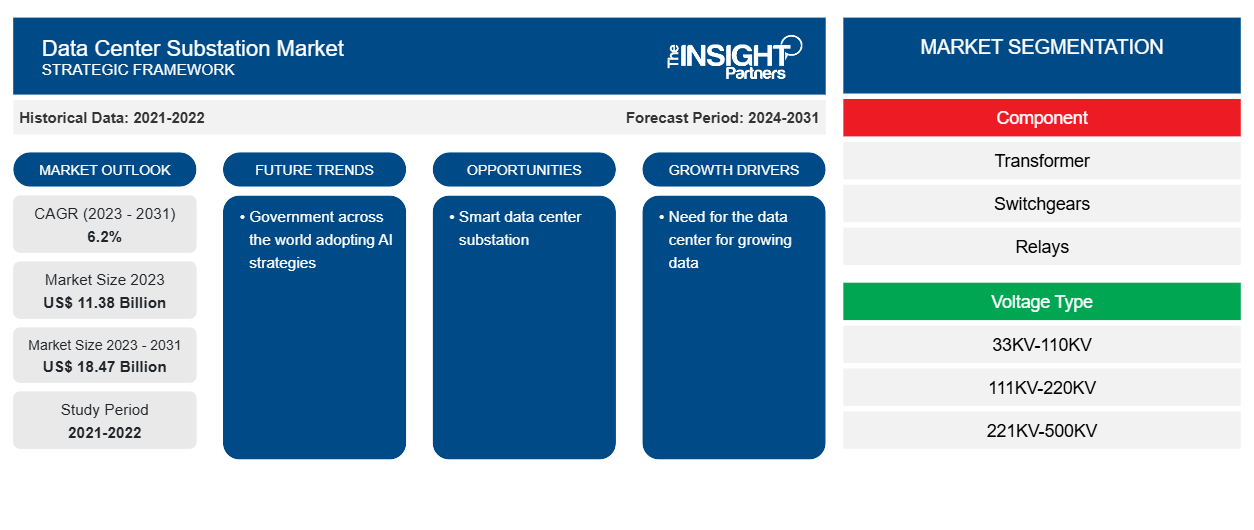
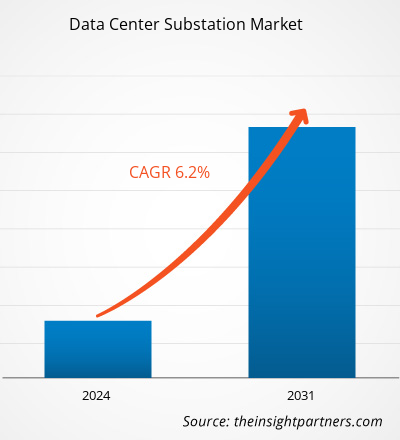
データセンター変電所の市場規模は、2023 年の 113.8 億米ドルから 2031 年には 184.7 億米ドルに達すると予測されています。市場は 2023 年から 2031 年にかけて 6.2% の CAGR を記録すると予想されています。世界中のデータセンターの成長と、データセンターへの効率的でスムーズかつ信頼性の高い電力供給の必要性は、今後も市場の主要なトレンドであり続けると思われます。
データセンター変電所市場分析
世界中でデータセンターの数が増えていることで、効率的な電力供給の必要性が高まっており、これがデータセンター変電所市場のさらなる発展につながっています。世界中で事業を拡大している企業がデータセンターを立ち上げたり、コロケーション サービスを導入したりしていることで、データセンターの必要性がさらに高まっています。データの増加により、データを処理および分析できるストレージの必要性が生じており、これがデータセンターの必要性をさらに高めています。このように、データセンターの必要性の高まりにより、データセンターの構築と運用中に効率的な電力を供給するためのデータセンター変電所市場が活性化しています。
データセンター変電所市場の概要
データ センターの変電所は、エネルギーを生産から消費へ転送する電力網において重要な役割を果たす施設です。変電所は、機器を故障や短絡から保護し、電力線や機器の損傷を防ぐのに役立ちます。データ センター プロバイダーは、ユーティリティ プロバイダーに連絡して、キャンパス内に変電所を建設するか、変電所を構築してデータ センターに供給してもらいます。
要件に合わせてレポートをカスタマイズする
このレポートの一部、国レベルの分析、Excelデータパックなど、あらゆるレポートを無料でカスタマイズできます。また、スタートアップや大学向けのお得なオファーや割引もご利用いただけます。
データセンター変電所市場:戦略的洞察
-
このレポートの主要な市場動向を入手してください。この無料サンプルには、市場動向から見積もりや予測に至るまでのデータ分析が含まれます。
データセンター変電所市場の推進要因と機会
市場を有利にするには、増大するデータに対応するデータセンターが必要
データの生成ペースは加速しています。インターネットの普及率の上昇は、データの生成を促進しています。世界中の企業は、効率的なビジネス成長のためにデータ主導の戦略的計画に依存しています。さらに、IoTは、リアルタイムで処理、保存、分析する必要がある膨大なデータを生成します。5Gは4Gや他のネットワークよりもはるかに高いデータと低い遅延を提供するため、5Gの導入によりデータトラフィックの量が大幅に増加すると予想されています。シスコのレポートによると、5Gは2023年までに世界のモバイル接続の10%以上をサポートし、平均速度は575 Mbpsになります。これは、今日の平均的なモバイル接続の13倍の速度です。データトラフィックの増加により、企業や企業はデータをより効率的かつ確実に保存、処理、配布できる場所を求めており、データセンタープロバイダーの必要性が高まっています。したがって、データセンターの電力網を効果的に管理するために、データセンター変電所の需要が高まっています。
スマートデータセンター変電所
各国の政府は、データセンターの建設を綿密に監視し、データセンターの開発と運用中に持続可能性を確保しています。政府は、二酸化炭素排出量の削減と、エネルギー集約型施設から生じる懸念への対応に重点を置いています。そのため、市場プレーヤーは、データセンター業界を効果的に促進するために、スマートデータセンター変電所ソリューションの構築に注力しています。たとえば、ABBは、これらの施設の二酸化炭素排出量と不動産排出量を削減するために、スマートデータセンター変電所を提供しています。スマートモジュラーコンポーネントを使用することで、同社は銅製の制御ケーブルの量を50%以上削減することができました。したがって、このようなスマートソリューションの構築は、データセンター業界を促進し、効率的なデータセンター変電所市場の需要を生み出すでしょう。
データセンター変電所市場レポートのセグメンテーション分析
データセンター変電所市場分析の導出に貢献した主要なセグメントは、コンポーネントと電圧タイプです。
- コンポーネントに基づいて、データセンター変電所市場は、変圧器、スイッチギア、リレー、その他に分かれています。スイッチギアセグメントは、2023年に市場で最大のシェアを占めました。
- 電圧タイプ別に見ると、市場は 33KV-110KV、111KV-220KV、221KV-500KV、および 500KV 以上に区分されています。500KV 以上の電圧は、予測期間中に大幅な CAGR で成長すると予想されます。
データセンター変電所の地域別市場シェア分析
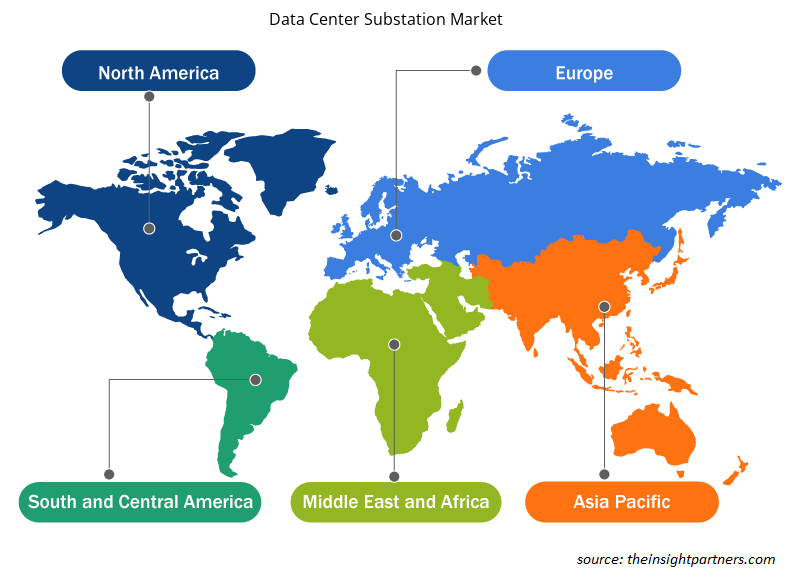
データセンター変電所市場レポートの地理的範囲は、主に北米、アジア太平洋、ヨーロッパ、中東およびアフリカ、南米および中米の 5 つの地域に分かれています。
アジア太平洋地域は、予測期間中に最も高い CAGR で成長すると予想されています。5G、クラウド コンピューティング、ビッグ データ分析、およびその他の高度なテクノロジの増加により、処理および分析が必要な大量のデータが処理されるようになりました。データ ストレージとコンピューティングの需要により、この地域のデータ センター市場が促進され、アジア太平洋地域のデータ センター サブステーション市場がさらに補完されます。
データセンター変電所市場の地域別分析
予測期間を通じてデータセンター変電所市場に影響を与える地域的な傾向と要因は、Insight Partners のアナリストによって徹底的に説明されています。このセクションでは、北米、ヨーロッパ、アジア太平洋、中東、アフリカ、南米、中米にわたるデータセンター変電所市場のセグメントと地理についても説明します。
- データセンター変電所市場の地域別データを入手
データセンター変電所市場レポートの範囲
| レポート属性 | 詳細 |
|---|---|
| 2023年の市場規模 | 113.8億米ドル |
| 2031年までの市場規模 | 184.7億米ドル |
| 世界のCAGR(2023年~2031年) | 6.2% |
| 履歴データ | 2021-2022 |
| 予測期間 | 2024-2031 |
| 対象セグメント |
コンポーネント別
|
| 対象地域と国 |
北米
|
| 市場リーダーと主要企業プロフィール |
|
データセンター変電所市場のプレーヤー密度:ビジネスダイナミクスへの影響を理解する
データ センター サブステーション市場は、消費者の嗜好の変化、技術の進歩、製品の利点に対する認識の高まりなどの要因により、エンド ユーザーの需要が高まり、急速に成長しています。需要が高まるにつれて、企業は提供内容を拡大し、消費者のニーズを満たすために革新し、新たなトレンドを活用し、市場の成長をさらに促進しています。
市場プレーヤー密度とは、特定の市場または業界内で活動している企業または会社の分布を指します。これは、特定の市場スペースに、その市場規模または総市場価値に対してどれだけの競合相手 (市場プレーヤー) が存在するかを示します。
データセンター変電所市場で事業を展開している主要企業は次のとおりです。
- イートン
- ゼネラル・エレクトリック
- 日立エナジー株式会社
- NEIエレクトリックパワーエンジニアリング株式会社
- NRエレクトリック
- S&Cエレクトリックカンパニー
免責事項:上記の企業は、特定の順序でランク付けされていません。
- データセンター変電所市場のトップキープレーヤーの概要を入手
データセンター変電所市場のニュースと最近の動向
データ センター サブステーション市場は、主要な企業出版物、協会データ、データベースなどの一次調査と二次調査後の定性的および定量的データを収集することによって評価されます。データ センター サブステーション市場の動向のいくつかを以下に示します。
- 大手ITインフラストラクチャおよびサービス企業であるNTT Ltd.は、NTTグローバルデータセンター株式会社(NTT Ltd.の子会社)を通じて、NTTサイバージャヤキャンパスに新しいデータセンターを開設すると発表しました。5,000万米ドル(2億3,400万リンギット)超の投資が行われるこの施設は、2025年までにマレーシアを「アジアのデジタルタイガー」にするというマレーシアのデジタル成長ビジョンに沿っています。NTTキャンパスで6番目のデータセンターとなるCBJ6は、7MWの重要なIT負荷、4,890m2のスペース、多様な受電を備えた2つの33kV変電所、最大15kWの高密度ラックの安定した環境を維持するための高度な冷却壁技術を備えています。CBJ6は、2021年に建設されたサイバージャヤ5(CBJ5)データセンターを補完するもので、合わせた施設は20,000m2のスペースと22MWの設備負荷を備えています。 (出典:NTT Ltd、プレスリリース、2023年10月)
- ハイパースケールおよび大規模エンタープライズ向けデータセンターソリューションのグローバルプロバイダーであるColt Data Centre Services (DCS) は、インド初のデータセンターの開設を発表しました。このフラッグシップのNavi Mumbaiデータセンターは、急成長するインドのデータセンター市場におけるハイパースケールクラウドサービスプロバイダーと大規模エンタープライズ企業の高まる需要をサポートするColt DCSの戦略的拡大と取り組みを示すものです。このデータセンターは、LILO構成の非常に耐障害性の高い220kV GIS変電所をオンサイトで備えています。(出典: Colt Data Centre Services Holdings、プレスリリース、2023年9月)
データセンター変電所市場レポートの対象範囲と成果物
「データセンター変電所市場規模と予測(2021〜2031年)」レポートでは、以下の分野をカバーする市場の詳細な分析を提供しています。
- データセンター変電所の市場規模と予測、および対象範囲に含まれるすべての主要市場セグメントの世界、地域、国レベルでの予測
- データセンター変電所市場の動向、および推進要因、制約、主要な機会などの市場動向
- 詳細なPEST/ポーターの5つの力とSWOT分析
- 主要な市場動向、世界および地域の枠組み、主要プレーヤー、規制、最近の市場動向を網羅したデータセンター変電所市場分析
- 市場集中、ヒートマップ分析、主要プレーヤー、データセンター変電所市場の最近の動向を網羅した業界の状況と競争分析
- 詳細な企業プロフィール

アンキタは、テクノロジー、メディア、ICT、エレクトロニクス・半導体の各分野で8年以上の経験を持つ、ダイナミックな市場調査およびコンサルティングのプロフェッショナルです。Microsoft、Oracle、NEC、SAP、KPMG、Expeditors Internationalといったグローバルクライアントに対し、100件以上のコンサルティングおよび調査案件を主導・遂行してきました。彼女のコアコンピテンシーは、市場評価、データ分析、予測、戦略策定、競合情報、レポート作成です。
アンキタは、販売前の提案書作成やクライアントとの協議から、販売後の実用的なインサイトの提供まで、プロジェクトサイクル全体を巧みに管理することに長けています。彼女は、部門横断的なチームの管理、複雑な調査モジュールの構築、そしてクライアント固有のビジネス目標に合わせたソリューションの調整に長けています。優れたコミュニケーション能力、リーダーシップ、そしてプレゼンテーション能力により、急速に変化する市場環境において、常に価値主導の成果を生み出しています。
- 過去2年間の分析、基準年、CAGRによる予測(7年間)
- PEST分析とSWOT分析
- 市場規模価値/数量 - 世界、地域、国
- 業界と競争環境
- Excel データセット
お客様の声
Insight PartnersのSCADAシステム市場レポートは包括的で、現在のトレンドと将来の予測に関する貴重な洞察が含まれています。チームは終始、非常にプロフェッショナルで、対応が早く、サポートも充実していました。私たちは彼らのサービスに非常に満足しており、強くお勧めします。
ラン・ケデム パートナー, レアリテクノロジーズ株式会社非常に特殊なソフトウェア市場に関するレポートを依頼したところ、チームは数日でレポートを作成してくれました。情報は非常に関連性が高く、分かりやすくまとめられていました。その後、レポートにいくつか修正と追加を依頼しましたが、チームは非常に迅速に対応し、1週間も経たないうちに最終レポートを受け取ることができました。
ジャン=エルヴェ・ジェン 会長, フューチャー・アナリティカ重要な市場調査と予測のために、The Insight Partnersと協力しました。彼らは機会とリスクに関する明確な洞察を提供し、私たちの計画策定に役立ちました。彼らの調査は使いやすく、確かなデータに基づいており、賢明で自信に満ちた意思決定に役立ちました。彼らを強くお勧めします。
ピユーシュ・ナグパル 上級副社長, ハイビームグローバルInsight Partnersは、深い専門知識に基づき、洞察力に富み、構造化された市場調査を提供しました。チームは終始プロフェッショナルで、対応力も抜群でした。ユーザーフレンドリーなウェブサイトにより、業界レポートへのアクセスもスムーズでした。信頼性の高い高品質な調査サービスをお探しなら、Insight Partnersを強くお勧めします。
安達幸彦 最高経営責任者(CEO), ディープブルーLLC。The Insight Partnersから市場レポートを購入するのは今回が初めてです。最初は不安でしたが、ウェブサイトを見て、リスクを負ってでも購入してみようという気持ちになりました。レポートの品質とカスタマーサービスには大変満足しています。最初のレポートにはいくつか質問やコメントがありましたが、アナリストとメールで何度かやり取りした結果、戦略策定プロセスへのインプットとして活用できるレポートが完成しました。貴重なお時間を割いていただき、貴重な体験をさせていただき、誠にありがとうございました。他の方にもぜひお勧めしたいですし、今後さらに市場データが必要になった際には、まずThe Insight Partnersにご連絡させていただきます。
ジョン・スズキ 社長兼最高経営責任者、取締役, BKテクノロジーズナイジェリアの感染症IVD市場に関する情報提供依頼に対し、ご対応いただいた際、ご尽力とプロフェッショナルな姿勢に深く感謝申し上げます。忍耐強く、的確なアドバイスをいただき、また、最終的に取引成立に至った割引のご提供にも深く感謝申し上げます。今回の最初の出会いで得た強い印象のおかげで、今後もThe Insight Partnersとの連携を心待ちにしております。
チジオケ博士 オニア マネージングディレクター, パインクレストヘルスケア株式会社購入理由
- 情報に基づいた意思決定
- 市場動向の理解
- 競合分析
- 顧客インサイト
- 市場予測
- リスク軽減
- 戦略計画
- 投資の正当性
- 新興市場の特定
- マーケティング戦略の強化
- 業務効率の向上
- 規制動向への対応


 無料サンプルを入手 - データセンター変電所市場