
2030년까지 데이터 컨버터 시장 전략, 상위 플레이어, 성장 기회, 분석 및 예측
데이터 변환기 시장 규모 및 예측(2020-2030), 글로벌 및 지역별 점유율, 추세 및 성장 기회 분석 보고서 범위: 유형(ADC 및 DAC), 해상도(10비트, 12비트, 14비트, 16비트 및 기타), 변환기 속도(최대 50Msps, 51~100Msps, 101~200Msps, 201~500Msps, 501Msps~1Gsps 및 1Gsps 이상), 최종 사용자(자동차, 통신, 가전제품, 산업, 의료 및 기타) 및 지역별
- 상태 : 게시됨
- 보고서 코드 : TIPTE100001014
- 범주 : 전자 및 반도체
- 페이지 수 : 171
- 사용 가능한 보고서 형식 :


- 최종 업데이트 일자 : May 21, 2026

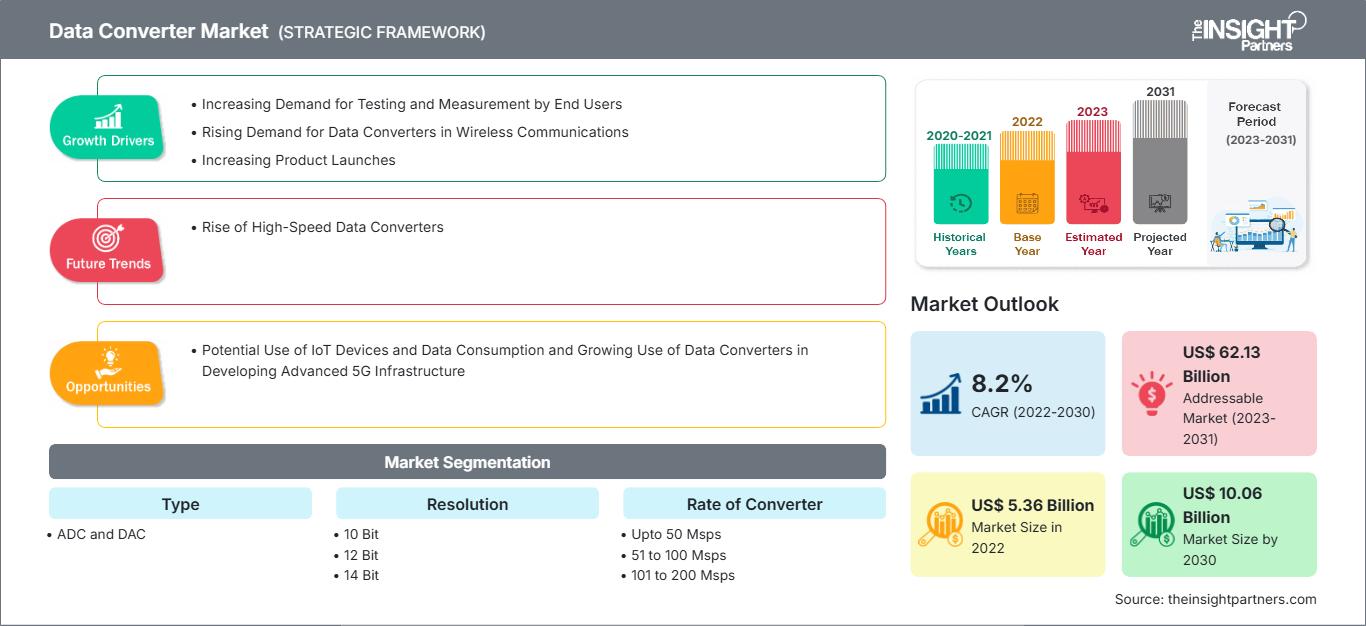
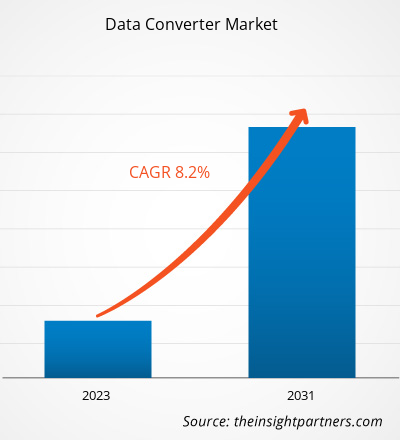
데이터 변환기 시장 규모는 2022년 53억 6천만 달러에서 2030년에는 100억 6천만 달러에 이를 것으로 전망됩니다. 2022년부터 2030년까지 연평균 성장률 8.2%를 기록할 것으로 예상됩니다. 온도 센서의 소형화는 시장의 주요 트렌드로 남을 것으로 보입니다.
데이터 변환기 시장 분석
지난 몇 년 동안 데이터 변환기 시장은 최종 사용자의 테스트 및 측정 수요 증가, 무선 통신용 데이터 변환기 수요 증가, 그리고 제품 출시 증가 등의 요인으로 빠르게 성장했습니다. IoT 기기의 잠재적 활용 및 데이터 소비 증가, 그리고 첨단 5G 인프라 구축에 있어 데이터 변환기의 활용 증가는 데이터 변환기 시장의 성장 기회를 제공하는 요인 중 일부입니다.
데이터 변환기 시장 개요
데이터 변환기는 전자 회로입니다. 데이터를 한 형식에서 다른 형식으로 변환하는 장치, 즉 디지털-아날로그 변환기(ADC) 또는 아날로그-디지털 변환기(DAC)입니다. 아날로그 신호로 작동하는 회로는 아날로그이고, 디지털 신호로 작동하는 회로는 디지털 회로입니다. 고속 ADC는 산업 계측, 인프라, 통신 시스템, 산업 공정 제어, 데이터 수집, 측정 및 제어 시스템, 기타 센서 기반 시스템에 적합합니다. 또한 DAC는 의료/테스트 계측 및 장비, 통신 시스템, 비디오 애플리케이션에도 적합합니다.
통신 및 프로토콜 변환, 산업 제어 및 측정, 5G, 무선 통신, 유선 통신, LiDAR 및 RADAR, 자동차 이더넷, 이미지 센서는 데이터 변환기가 사용되는 주요 응용 분야입니다. 이러한 응용 분야에서 실시간 정보에 대한 수요가 증가함에 따라 데이터 변환기에 대한 수요는 향후 몇 년 동안 계속 증가할 것입니다. 데이터 변환기는 높은 정밀도와 편의성으로 고속 작업을 지원할 수 있는 잠재력을 가지고 있으며, 이는 산업, 통신, 가전제품, 의료 분야에서의 수요를 증가시킵니다. 또한 정확도를 높이고, 전력을 낮추고, 대역폭을 늘리고, 비용을 절감하는 동시에 시스템 설계를 간소화합니다.
요구 사항에 맞게 이 보고서를 사용자 정의하십시오.
이 보고서의 일부, 국가 수준 분석, Excel 데이터 팩을 포함하여 모든 보고서에 대한 사용자 정의를 무료로 받을 수 있을 뿐만 아니라 스타트업 및 대학을 위한 훌륭한 제안 및 할인을 이용할 수 있습니다
데이터 변환기 시장: 전략적 통찰력
-
이 보고서의 주요 주요 시장 동향을 확인하세요.이 무료 샘플에는 시장 동향부터 추정 및 예측에 이르기까지 데이터 분석이 포함됩니다.
데이터 변환기 시장 성장 동력 및 기회
최종 사용자의 테스트 및 측정 수요 증가로 시장 선호도 증가
제품 품질, 규정 준수 및 효율성 보장은 전 세계 기업의 최우선 과제입니다. 테스트 및 측정(T&M) 솔루션은 수많은 전자 제품의 품질과 성능을 보장하는 전자 시스템 설계 및 제조(ESDM) 부문의 핵심 요소입니다. 통신 산업에서 향상된 음성 품질과 데이터 서비스는 고급 변조 및 안테나 기술의 결과입니다. 라우터, 리피터, 연결 장치 등 다양한 네트워크 구성 요소를 종합적으로 테스트하려면 무선 주파수(RF) 신호 분석 장비, 로직 분석기, 신호 발생기, 케이블 테스터, 네트워크 분석기 및 기타 테스트 및 측정 도구가 필요합니다. 아날로그-디지털 변환기(ADC)와 디지털-아날로그 변환기(DAC)는 신호 변환 장비에 자주 사용됩니다. 통신 테스트 장비에서 ADC와 DAC 사용이 증가함에 따라 데이터 컨버터 시장 성장이 촉진되고 있습니다.
첨단 5G 인프라 개발에서 데이터 컨버터 사용 증가
많은 국가 정부가 5G 인프라 확충을 위한 이니셔티브를 추진하고 있습니다. 2023년 9월, 미국 국립과학재단(NSF) 기술·혁신·파트너십국(TIP)은 5개 융합팀을 NSF 융합 1단계에서 2단계로 발전시키기 위해 2,500만 달러를 투자하여 5G 통신 인프라 및 운영상의 과제를 해결한다고 발표했습니다. NSF는 트랙 G 1단계에 16개 팀을 선정했습니다. 향후 2년 동안 2단계 팀은 기술 개발, 지적 재산권, 재무 관리 및 계획, 지속가능성 계획, 커뮤니케이션 및 홍보를 포함하는 혁신 및 기업가 정신 교육 과정에 참여하게 됩니다. 2023년 4월, 지나 M. 라이몬도 미국 상무장관은 개방적이고 상호운용 가능한 네트워크 개발에 15억 달러를 투자하는 것을 목표로 하는 공공 무선 공급망 혁신 기금(Public Wireless Supply Chain Innovation Fund)의 설립을 발표했습니다. 2022년 제정된 CHIPS 및 과학법(CHIPS and Science Act)에 따라 자금이 지원되는 이 투자는 바이든-해리스 행정부의 '미국 투자(Investing in America)' 정책의 일환으로, 무선 혁신을 촉진하고 경쟁을 촉진하며 공급망 복원력을 강화하는 것을 목표로 합니다. 따라서 5G 인프라 개발에 데이터 컨버터 사용이 증가하고 정부 정책이 확대됨에 따라 향후 몇 년 동안 데이터 컨버터 시장에 상당한 기회가 제공될 것으로 예상됩니다.
데이터 컨버터 시장 보고서 세분화 분석
데이터 컨버터 시장 분석 도출에 기여한 주요 세그먼트는 유형, 해상도, 컨버터 속도, 최종 사용자입니다.
- 데이터 컨버터 시장은 유형에 따라 ADC와 DAC로 구분됩니다. ADC 부문은 2022년에 상당한 시장 점유율을 차지할 것으로 예상됩니다.
- 해상도 기준으로 시장은 10비트, 12비트, 14비트, 16비트 및 기타로 구분됩니다. 기타 부문은 2022년에 가장 큰 시장 점유율을 기록했습니다.
- 변환 속도 기준으로 시장은 최대 50Msps, 51~100Msps, 101~200Msps, 201~500Msps, 501Msps~1Gsps, 그리고 1Gsps 이상으로 구분됩니다. 501Msps~1Gsps 부문은 2022년에 가장 큰 시장 점유율을 기록했습니다.
- 최종 사용자 기준으로 시장은 자동차, 통신, 가전제품, 산업, 의료 및 기타로 구분됩니다. 2022년에는 통신 부문이 가장 큰 시장 점유율을 기록했습니다.
지역별 데이터 변환기 시장 점유율 분석
데이터 변환기 시장 보고서의 지리적 범위는 주로 북미, 아시아 태평양, 유럽, 중동 및 아프리카, 중남미의 5개 지역으로 나뉩니다.
매출 측면에서는 북미가 2022년 시장을 주도했습니다. 북미 데이터 변환기 시장은 미국, 캐나다, 멕시코로 세분화됩니다. 이 지역의 시장 성장은 의료 분야에서 고해상도 이미지에 대한 수요 증가에 기인합니다. 향상된 이미지 품질은 모든 질병의 신속한 진단 및 치료를 가능하게 하여 의사의 생산성을 향상시킵니다. 기술적으로 진보된 데이터 수집 시스템에서 데이터 변환기 도입이 증가함에 따라 북미 시장 성장이 더욱 가속화되고 있습니다. 전자 산업은 유연한 소프트웨어와 모듈식 하드웨어를 결합하는 추세로 전환되고 있습니다. 또한, 북미에는 주요 데이터 변환기 제조업체의 입지가 상당하며 시장 성장을 견인하고 있습니다. 북미의 일부 데이터 변환기 제조업체로는 Texas Instruments Incorporated, Analog Devices, Inc., Omni Design Technologies, Inc., Synopsys, Inc., Microchip Technology, Inc. 등이 있습니다.
데이터 컨버터 시장 지역별 통찰력
The Insight Partners의 분석가들은 예측 기간 동안 데이터 변환기 시장에 영향을 미치는 지역별 동향과 요인을 면밀히 분석했습니다. 이 섹션에서는 북미, 유럽, 아시아 태평양, 중동 및 아프리카, 중남미 지역의 데이터 변환기 시장 부문 및 지역별 현황도 살펴봅니다.
데이터 변환기 시장 보고서 범위
| 보고서 속성 | 세부 |
|---|---|
| 시장 규모 2022 | US$ 5.36 Billion |
| 시장규모별 2030 | US$ 10.06 Billion |
| 글로벌 CAGR (2022 - 2030) | 8.2% |
| 이전 데이터 | 2020-2021 |
| 예측 기간 | 2023-2031 |
| 다루는 세그먼트 |
By 유형
|
| 포함된 지역 및 국가 |
북미
|
| 시장 선도 기업 및 주요 회사 프로필 |
|
데이터 변환기 시장 참여자 밀도: 비즈니스 역학에 미치는 영향 이해
데이터 변환기 시장은 소비자 선호도 변화, 기술 발전, 그리고 제품 이점에 대한 인식 제고 등의 요인으로 인한 최종 사용자 수요 증가에 힘입어 빠르게 성장하고 있습니다. 수요 증가에 따라 기업들은 제품 및 서비스 확장, 소비자 니즈 충족을 위한 혁신, 그리고 새로운 트렌드를 적극 활용하며 시장 성장을 더욱 가속화하고 있습니다.
- 을 얻으세요 데이터 변환기 시장 주요 주요 플레이어 개요
데이터 변환기 시장 뉴스 및 최근 동향
데이터 변환기 시장은 1차 및 2차 조사 후 주요 기업 간행물, 협회 데이터, 데이터베이스 등 정성적 및 정량적 데이터를 수집하여 평가합니다. 데이터 변환기 시장의 몇 가지 동향은 다음과 같습니다.
- STMicroelectronics는 위성 전자 회로의 핵심 기능을 수행하는 저가 플라스틱 패키지의 방사선 내성 전력, 아날로그 및 로직 IC 신제품군을 출시했습니다. 이 시리즈의 첫 9개 제품은 데이터 변환기, 전압 조정기, 라인 드라이버, LVDS 트랜시버, 그리고 발전 및 배전, 원격 측정 별 추적기, 온보드 컴퓨터, 트랜시버 등 다양한 시스템에 사용되는 5개의 로직 게이트로 구성되었습니다. (출처: STMicroelectronics, 보도자료, 2022년 3월)
- 르네사스 일렉트로닉스(Renesas Electronics Corp)는 32비트 마이크로컨트롤러 제품군에 하이엔드 산업용 센서 시스템용 새로운 RX 디바이스를 추가했습니다. 이 새로운 MCU는 최대 변환 속도가 125kSPS(초당 125,000개 샘플)인 24비트 델타-시그마 A/D 컨버터를 탑재했으며, RX23E-A보다 8배 빠릅니다. (출처: 르네사스 일렉트로닉스, 보도자료, 2023년 11월)
데이터 컨버터 시장 보고서 범위 및 결과
“데이터 컨버터 시장 규모 및 예측(2020~2030년)” 보고서는 다음 영역을 포괄하는 시장에 대한 자세한 분석을 제공합니다.
- 범위에 포함된 모든 주요 시장 부문에 대한 글로벌, 지역 및 국가 수준의 데이터 변환기 시장 규모 및 예측
- 데이터 변환기 시장 동향 및 추진 요인, 제약 및 주요 기회와 같은 시장 역학
- 자세한 PEST/포터의 5가지 힘 및 SWOT 분석
- 주요 시장 동향, 글로벌 및 지역 프레임워크, 주요 업체, 규정 및 최근 시장 동향을 포괄하는 데이터 변환기 시장 분석
- 시장 집중도, 히트맵 분석, 주요 업체 및 데이터 변환기 시장의 최근 동향을 포괄하는 산업 환경 및 경쟁 분석
- 자세한 회사 프로필

나빈은 맞춤형, 신디케이트 및 컨설팅 프로젝트 전반에 걸쳐 9년 이상의 전문 지식을 보유한 시장 조사 및 컨설팅 전문가입니다. 현재 부사장으로 재직 중이며, 프로젝트 가치 사슬 전반의 이해관계자들을 성공적으로 관리해 왔으며, 100편 이상의 연구 보고서와 30건 이상의 컨설팅 업무를 수행했습니다. 그는 산업 및 정부 프로젝트 전반에 걸쳐 다양한 업무를 수행하며 고객 성공과 데이터 기반 의사 결정에 크게 기여하고 있습니다.
나빈은 카르나타카주 VTU에서 전자통신 공학 학위를, 마니팔 대학교에서 마케팅 및 운영 MBA를 취득했습니다. 그는 9년 동안 IEEE 회원으로 활발하게 활동하며 컨퍼런스, 기술 심포지엄에 참여하고 지역 및 지역 차원에서 자원봉사 활동을 해왔습니다. 현재 직책을 맡기 전에는 IndustryARC에서 준전략 컨설턴트로, 휴렛팩커드(HP Global)에서 산업용 서버 컨설턴트로 근무했습니다.
- 포괄적인 시장 규모 산정 및 전망 분석
- 상세 시장 세분화 분석
- 심층적인 시장 동향 및 요인 분석
- 지역 및 국가별 인사이트
- 경쟁 구도 및 기업 벤치마킹
- 전략적 비즈니스 인텔리전스
사용 후기
Insight Partners의 SCADA 시스템 시장 보고서는 포괄적이며, 현재 동향과 미래 전망에 대한 귀중한 통찰력을 제공합니다. 팀은 매우 전문적이고, 신속하게 대응하며, 처음부터 끝까지 지원해 주었습니다. 저희는 매우 만족하며 Insight Partners의 서비스를 적극 추천합니다.
란 케뎀 파트너, Reali Technologies LTDs아주 구체적인 소프트웨어 시장에 대한 보고서를 요청했는데, 팀에서 며칠 만에 보고서를 작성해 주셨습니다. 정보는 매우 관련성이 높고 잘 정리되어 있었습니다. 그 후 보고서에 몇 가지 수정과 추가 사항을 요청했습니다. 팀원들의 응답도 매우 빨랐고, 일주일도 채 되지 않아 최종 보고서를 받았습니다.
장-에르브 젠 의장, 퓨처 애널리티카The Insight Partners와 함께 중요한 시장 조사 및 예측 작업을 진행했습니다. Insight Partners는 기회와 위험에 대한 명확한 통찰력을 제공하여 계획을 세우는 데 큰 도움이 되었습니다. The Insight Partners의 조사는 사용하기 쉬웠고, 탄탄한 데이터를 기반으로 했습니다. 덕분에 현명하고 자신 있는 결정을 내릴 수 있었습니다. The Insight Partners를 강력 추천합니다.
피유시 나그팔 수석 부사장, 하이빔 글로벌Insight Partners는 탄탄한 분야 전문성을 바탕으로 통찰력 있고 체계적인 시장 조사를 제공했습니다. Insight Partners 팀은 처음부터 끝까지 전문적이고 신속하게 대응했습니다. 사용자 친화적인 웹사이트 덕분에 업계 보고서에 쉽게 접근할 수 있었습니다. 신뢰할 수 있고 고품질의 조사 서비스를 원하신다면 Insight Partners를 강력 추천합니다.
아다치 유키히코 대표이사, 딥블루 주식회사The Insight Partners에서 시장 보고서를 구매한 것은 이번이 처음입니다. 처음에는 확신이 없었지만, 웹사이트를 방문하고 나서 위험을 감수하고 시장 보고서를 구매하는 것이 더 편하다는 것을 알게 되었습니다. 보고서의 품질과 고객 서비스에 매우 만족합니다. 처음 보고서를 보고 몇 가지 질문과 의견이 있었지만, 분석가와 이메일로 몇 차례 대화를 나눈 후, 전략 기획 과정에 참고할 수 있는 보고서를 확보했다고 생각합니다. 시간을 내어 긍정적인 경험을 선사해 주셔서 정말 감사합니다. 다른 사람들에게도 귀사의 서비스를 적극 추천할 것이며, 추가적인 시장 데이터가 필요할 때면 가장 먼저 귀사에 연락하겠습니다.
존 스즈키 사장 겸 최고 경영자, 이사회 이사, BK 테크놀로지스나이지리아 감염성 질환 IVD 시장 관련 정보 요청에 응해 주신 귀사의 지원과 전문성에 감사드립니다. 귀사의 인내심과 지도, 그리고 할인 혜택을 기꺼이 제공해 주셔서 결국 계약을 성사시킬 수 있었습니다. 첫 만남을 통해 귀사가 저에게 심어주신 좋은 인상을 바탕으로 앞으로도 The Insight Partners와 함께할 수 있기를 기대합니다.
치지오케 박사 오니아 전무이사, 파인크레스트 헬스케어 유한회사구매 이유
- 정보에 기반한 의사 결정
- 시장 역학 이해
- 경쟁 분석
- 고객 인사이트
- 시장 예측
- 위험 완화
- 전략 기획
- 투자 타당성 분석
- 신흥 시장 파악
- 마케팅 전략 강화
- 운영 효율성 향상
- 규제 동향에 발맞춰 대응


