가스 파이프라인 인프라 시장 개요, 성장, 동향, 분석, 연구 보고서(2022-2030)
이전 데이터 : 2020-2021 | 기준 연도 : 2022 | 예측 기간 : 2022-2030가스 파이프라인 인프라 시장 규모 및 예측(2020-2030), 글로벌 및 지역별 점유율, 추세 및 성장 기회 분석 보고서 범위: 운영(송전 및 배전), 장비(파이프라인, 압축기 스테이션, 계량 스키드 및 기타), 응용 분야(육상 및 해상) 및 지역별
- 상태 : 게시됨
- 보고서 코드 : TIPRE00029705
- 범주 : 에너지와 전력
- 페이지 수 : 177
- 사용 가능한 보고서 형식 :


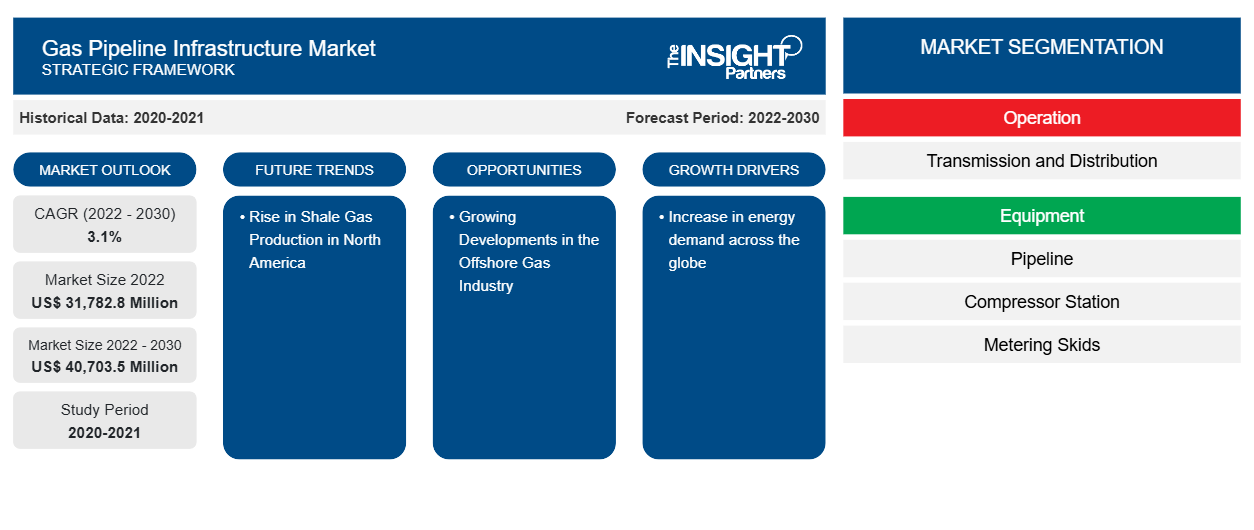
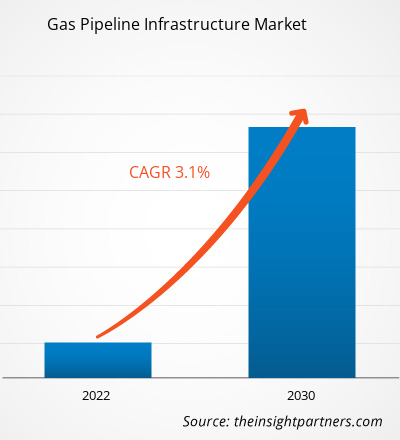
가스 파이프라인 인프라 시장 규모는 2022년 31,782.8백만 달러에서 2030년까지 40,703.5백만 달러에 도달할 것으로 예상됩니다. 이 시장은 2022~2030년에 3.1%의 CAGR을 기록할 것으로 예상됩니다.CAGR of 3.1% in 2022–2030.
가스 파이프라인 인프라 시장 분석
천연가스 시장은 매우 역동적이며 효과적으로 기능하려면 유동성, 유연성, 투명성이 필요합니다. 따라서 여러 공급원, 여러 사용자, 송전 및 유통을 위한 포괄적인 인프라가 필요합니다. 천연가스 시장은 미국, 유럽, 아시아 태평양 지역에서 상당히 발전했으며, 이는 향후 가스 수요 증가와 함께 가스 파이프라인 인프라의 성장을 주도할 것으로 예상됩니다.
가스 파이프라인 인프라 시장 개요
가스 파이프라인 인프라 생태계에는 지하 저장소에서 천연 가스를 추출하는 생산 단계가 포함됩니다. 탐사 및 생산 회사는 시추 기술을 사용하여 원시 천연 가스를 추출합니다. 추출된 가스는 일반적으로 불순물을 제거하기 위해 처리한 다음 운송을 위해 압축합니다. 생산 단계에는 지질학적 요인, 추출 기술 및 환경 영향 평가가 고려됩니다. 천연 가스 생산에 참여하는 주요 업체는 Royal Dutch Shell, ExxonMobil Corporation, Gazprom, ConocoPhillips 및 TotalEnergie입니다. 가스 파이프라인 전송 네트워크의 주요 업체로는 Kinder Morgan Inc., Enbridge Inc., TC Energy Corporation, Pembina Pipeline Corporation 및 Texas Gas Transmission LLC 등이 있습니다.
귀하의 요구 사항에 맞게 이 보고서를 사용자 정의하세요
이 보고서의 일부 또는 국가 수준 분석, Excel 데이터 팩을 포함하여 모든 보고서에 대한 사용자 정의를 무료로 받을 수 있으며 신생 기업 및 대학을 위한 훌륭한 혜택과 할인 혜택을 이용할 수 있습니다.
가스 파이프라인 인프라 시장: 전략적 통찰력
-
이 보고서의 주요 시장 동향을 알아보세요.이 무료 샘플에는 시장 동향부터 추정 및 예측까지 다양한 데이터 분석이 포함됩니다.
가스 파이프라인 인프라 시장 동인 및 기회
전 세계 에너지 수요 증가는 가스 파이프라인 인프라 시장의 주요 원동력이 될 것으로 예상됩니다.
인구 증가와 도시화 증가는 전 세계적으로 에너지 소비를 증가시키는 몇 가지 요인입니다. 천연 가스는 전기 생산에 잠재적으로 적용 가능하여 수요가 증가합니다. 게다가 러시아-우크라이나 전쟁으로 인해 유럽의 에너지 불확실성이 커지면서 여러 국가의 정부도 천연 가스 사용을 확대하고 있습니다. 따라서 에너지 수요 증가는 가스 파이프라인 인프라 시장 의 성장을 촉진합니다.
북미 셰일가스 생산 증가
북미는 전 세계 주요 셰일가스 생산국 중 하나로서 입지를 굳혔습니다. 캐나다는 전 세계에서 5번째로 큰 생산국이자 4번째로 큰 천연가스 수출국입니다. 주요 캐나다 셰일가스 플레이에는 브리티시 컬럼비아 북동부의 Horn River Basin과 Montney 셰일, 퀘벡의 Utica 셰일, 앨버타와 서스캐처원의 Colorado Group, 뉴브런즈윅과 노바스코샤의 Horton Bluff 셰일이 있습니다. 지정학적 혼란으로 인한 에너지 불확실성이 북미의 셰일가스 생산을 촉진하고 있으며, 이는 향후 몇 년 동안 가스 파이프라인 인프라 시장 성장에 큰 기회를 창출할 가능성이 높습니다.
가스 파이프라인 인프라 시장 보고서 세분화 분석
가스 파이프라인 인프라 시장 분석에 기여한 주요 부문은 운영, 장비 및 응용 분야입니다.
- 운영에 따라 가스 파이프라인 인프라 시장은 송전과 배분으로 구분되었습니다. 배분 부문은 2022년에 더 큰 시장 점유율을 차지했습니다.
- 장비 측면에서 시장은 파이프라인, 압축기 스테이션, 계량 스키드 등으로 세분화되었습니다. 파이프라인 세그먼트는 2022년에 시장을 지배했습니다.
- 응용 프로그램 측면에서 시장은 육상 및 해상으로 세분화되었습니다. 육상 세그먼트는 2022년에 시장을 지배했습니다.
지역별 가스 파이프라인 인프라 시장 점유율 분석
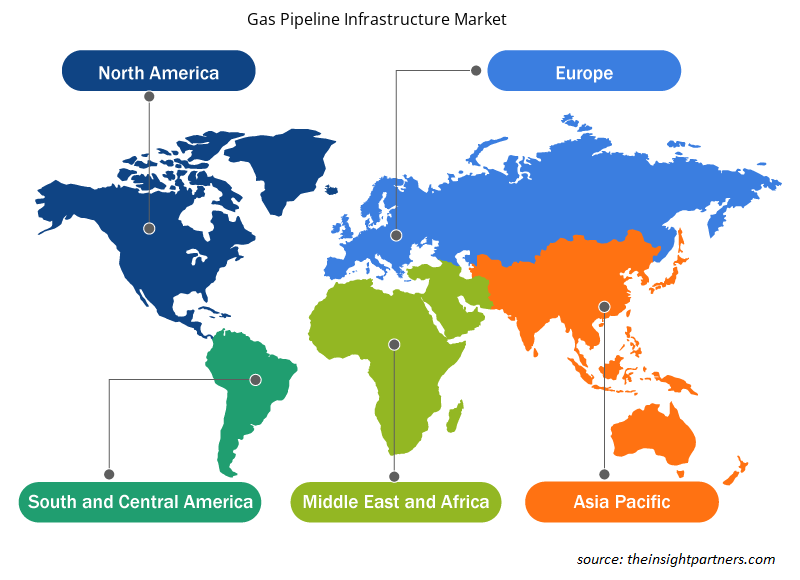
가스 파이프라인 인프라 시장 보고서의 지리적 범위는 주로 북미, 유럽, 아시아 태평양, 중동 및 아프리카, 남미의 5개 지역으로 나뉩니다.
북미는 주요 가스 수출국 중 하나입니다. 에너지에 대한 수요 증가와 천연 가스의 증가하는 적용은 북미의 가스 파이프라인 인프라 시장 개발을 촉진하고 있습니다. 2022년에 미국은 가장 높은 천연 가스 생산 용량을 보였고, 그 뒤를 캐나다와 멕시코가 이었습니다. Ixachi, Coulomb Phase 2, Quesqui, Nejo(IEPC), Leo, May, Koban, Powerball은 북미의 몇몇 천연 가스 생산 분야입니다. Ixachi 공장은 멕시코 베라크루스에 있으며, 2022년에 618.09mmcfd(1일 100만 입방 피트)를 생산했습니다. 또한 가스 파이프라인 인프라 개발을 위한 정부 이니셔티브와 자금 지원이 증가함에 따라 예측 기간 동안 가스 파이프라인 인프라 시장이 활성화될 것으로 예상됩니다.
가스 파이프라인 인프라 시장 지역 통찰력
Insight Partners의 분석가들은 예측 기간 동안 가스 파이프라인 인프라 시장에 영향을 미치는 지역적 추세와 요인을 철저히 설명했습니다. 이 섹션에서는 북미, 유럽, 아시아 태평양, 중동 및 아프리카, 남미 및 중미의 가스 파이프라인 인프라 시장 세그먼트와 지리에 대해서도 설명합니다.
- 가스 파이프라인 인프라 시장에 대한 지역별 특정 데이터 얻기
가스 파이프라인 인프라 시장 보고서 범위
| 보고서 속성 | 세부 |
|---|---|
| 2022년 시장 규모 | 31,782.8백만 달러 |
| 2030년까지 시장 규모 | 40,703.5백만 달러 |
| 글로벌 CAGR (2022-2030) | 3.1% |
| 역사적 데이터 | 2020-2021 |
| 예측 기간 | 2022-2030 |
| 다루는 세그먼트 |
운영에 따라
|
| 포함된 지역 및 국가 |
북아메리카
|
| 시장 선도 기업 및 주요 회사 프로필 |
|
가스 파이프라인 인프라 시장 참여자 밀도: 비즈니스 역학에 미치는 영향 이해
가스 파이프라인 인프라 시장 시장은 소비자 선호도의 변화, 기술 발전, 제품의 이점에 대한 인식 증가와 같은 요인으로 인해 최종 사용자 수요가 증가함에 따라 빠르게 성장하고 있습니다. 수요가 증가함에 따라 기업은 제품을 확장하고, 소비자의 요구를 충족하기 위해 혁신하고, 새로운 트렌드를 활용하여 시장 성장을 더욱 촉진하고 있습니다.
시장 참여자 밀도는 특정 시장이나 산업 내에서 운영되는 회사나 기업의 분포를 말합니다. 주어진 시장 공간에 얼마나 많은 경쟁자(시장 참여자)가 존재하는지 그 규모나 전체 시장 가치에 비해 나타냅니다.
가스 파이프라인 인프라 시장에서 운영되는 주요 회사는 다음과 같습니다.
- 엔브리지 주식회사
- 킨더모건 주식회사
- TC에너지코퍼레이션
- 펨비나 파이프라인 코퍼레이션
- 시노펙 그룹
- 파이프라인 인프라 유한회사
면책 조항 : 위에 나열된 회사는 어떤 특별한 순서에 따라 순위가 매겨지지 않았습니다.
- 가스 파이프라인 인프라 시장 주요 주요 업체 개요를 알아보세요
가스 파이프라인 인프라 시장 뉴스 및 최근 개발
가스 파이프라인 인프라 시장은 1차 및 2차 조사 이후의 정성적, 정량적 데이터를 수집하여 평가합니다. 여기에는 중요한 기업 간행물, 협회 데이터 및 데이터베이스가 포함됩니다. 다음은 가스 파이프라인 인프라 시장 시장 및 전략에 대한 시장의 개발 목록입니다.
- 2023년 2월, Enagas SA는 Reganosa와 계약을 체결했으며, Enagas는 Reganosa에 5,814만 달러를 지불하여 130km의 천연가스 파이프라인 네트워크를 조달했습니다. 이베리아 가스 시장의 효율적인 운영과 공급 보안은 이 네트워크에 달려 있습니다. (출처: Enagas SA, 보도자료/회사 웹사이트/뉴스레터)
- 2022년 8월, TC Energy Corp와 멕시코 국유 전기 회사인 CFE가 전략적 협정을 체결하여 중부와 남동부 지역의 천연 가스 인프라 개발을 촉진하기로 했습니다. 멕시코 중부의 천연 가스 파이프라인 자산과 관련하여 TC Energy와 CFE는 TC Energy의 멕시코 자회사인 TGNH와 CFE가 보증한 이전의 인수 또는 지불 계약(TSA)을 2055년까지 미국 달러로 가격이 책정된 단일 인수 또는 지불 계약으로 통합하기로 결정했습니다. CFE와 협력하여 계획 중인 관련 신규 인프라 프로젝트도 이 새로운 TSA에 따라 관리됩니다. (출처: TC Energy, 보도 자료/회사 웹사이트/뉴스레터)
가스 파이프라인 인프라 시장 보고서 범위 및 제공물
"가스 파이프라인 인프라 시장 규모 및 예측(2020-2030)" 보고서는 아래 영역을 포괄하는 시장에 대한 자세한 분석을 제공합니다.
- 범위에 포함된 모든 주요 시장 세그먼트에 대한 글로벌, 지역 및 국가 수준의 시장 규모 및 예측
- 동인, 제약 및 주요 기회와 같은 시장 역학
- 주요 미래 트렌드
- 자세한 PEST 분석
- 주요 시장 동향, 주요 업체, 규정 및 최근 시장 동향을 포괄하는 글로벌 및 지역 시장 분석
- 시장 집중도, 히트맵 분석, 유명 기업 및 최근 개발 사항을 포함하는 산업 환경 및 경쟁 분석
- SWOT 분석을 통한 자세한 회사 프로필

니베디타는 시장 조사 및 비즈니스 컨설팅 분야에서 9년 이상의 경력을 보유한 뛰어난 리서치 전문가입니다. 현재 The Insight Partners에서 ICT 분야 프로젝트 매니저로 재직 중인 그녀는 다양한 기술 분야에서 신디케이트, 맞춤형, 구독 기반 및 컨설팅 리서치 과제를 관리하고 수행하는 데 있어 심도 있는 전문 지식을 보유하고 있습니다.
데이터 기반 분석과 실행 가능한 인사이트를 제공하는 데 있어 입증된 실적을 바탕으로 니베디타는 여러 주요 프로젝트에 핵심적인 기여를 해왔습니다. 그녀의 업무는 고객 목표 파악, 시장 동향 분석, 전략적 권고 도출에 이르기까지 프로젝트 전반의 실행을 포함합니다. 그녀는 주요 ICT 기업들과 폭넓게 협력하여 시장 기회를 발굴하고 산업 변화를 헤쳐나가는 데 도움을 주었습니다.
니베디타는 데라둔에 위치한 IMS에서 경영학 MBA 학위를 취득했습니다. The Insight Partners에 합류하기 전에는 푸네에 위치한 MarketsandMarkets와 Future Market Insights에서 다양한 리서치 업무를 수행하며 산업 분석 및 고객 참여에 대한 탄탄한 기반을 다지는 귀중한 경험을 쌓았습니다.
- 과거 분석(2년), 기준 연도, CAGR을 포함한 예측(7년)
- PEST 및 SWOT 분석
- 시장 규모 가치/거래량 - 글로벌, 지역, 국가
- 산업 및 경쟁 환경
- Excel 데이터세트
사용 후기
Insight Partners의 SCADA 시스템 시장 보고서는 포괄적이며, 현재 동향과 미래 전망에 대한 귀중한 통찰력을 제공합니다. 팀은 매우 전문적이고, 신속하게 대응하며, 처음부터 끝까지 지원해 주었습니다. 저희는 매우 만족하며 Insight Partners의 서비스를 적극 추천합니다.
란 케뎀 파트너, Reali Technologies LTDs아주 구체적인 소프트웨어 시장에 대한 보고서를 요청했는데, 팀에서 며칠 만에 보고서를 작성해 주셨습니다. 정보는 매우 관련성이 높고 잘 정리되어 있었습니다. 그 후 보고서에 몇 가지 수정과 추가 사항을 요청했습니다. 팀원들의 응답도 매우 빨랐고, 일주일도 채 되지 않아 최종 보고서를 받았습니다.
장-에르브 젠 의장, 퓨처 애널리티카The Insight Partners와 함께 중요한 시장 조사 및 예측 작업을 진행했습니다. Insight Partners는 기회와 위험에 대한 명확한 통찰력을 제공하여 계획을 세우는 데 큰 도움이 되었습니다. The Insight Partners의 조사는 사용하기 쉬웠고, 탄탄한 데이터를 기반으로 했습니다. 덕분에 현명하고 자신 있는 결정을 내릴 수 있었습니다. The Insight Partners를 강력 추천합니다.
피유시 나그팔 수석 부사장, 하이빔 글로벌Insight Partners는 탄탄한 분야 전문성을 바탕으로 통찰력 있고 체계적인 시장 조사를 제공했습니다. Insight Partners 팀은 처음부터 끝까지 전문적이고 신속하게 대응했습니다. 사용자 친화적인 웹사이트 덕분에 업계 보고서에 쉽게 접근할 수 있었습니다. 신뢰할 수 있고 고품질의 조사 서비스를 원하신다면 Insight Partners를 강력 추천합니다.
아다치 유키히코 대표이사, 딥블루 주식회사The Insight Partners에서 시장 보고서를 구매한 것은 이번이 처음입니다. 처음에는 확신이 없었지만, 웹사이트를 방문하고 나서 위험을 감수하고 시장 보고서를 구매하는 것이 더 편하다는 것을 알게 되었습니다. 보고서의 품질과 고객 서비스에 매우 만족합니다. 처음 보고서를 보고 몇 가지 질문과 의견이 있었지만, 분석가와 이메일로 몇 차례 대화를 나눈 후, 전략 기획 과정에 참고할 수 있는 보고서를 확보했다고 생각합니다. 시간을 내어 긍정적인 경험을 선사해 주셔서 정말 감사합니다. 다른 사람들에게도 귀사의 서비스를 적극 추천할 것이며, 추가적인 시장 데이터가 필요할 때면 가장 먼저 귀사에 연락하겠습니다.
존 스즈키 사장 겸 최고 경영자, 이사회 이사, BK 테크놀로지스나이지리아 감염성 질환 IVD 시장 관련 정보 요청에 응해 주신 귀사의 지원과 전문성에 감사드립니다. 귀사의 인내심과 지도, 그리고 할인 혜택을 기꺼이 제공해 주셔서 결국 계약을 성사시킬 수 있었습니다. 첫 만남을 통해 귀사가 저에게 심어주신 좋은 인상을 바탕으로 앞으로도 The Insight Partners와 함께할 수 있기를 기대합니다.
치지오케 박사 오니아 전무이사, 파인크레스트 헬스케어 유한회사구매 이유
- 정보에 기반한 의사 결정
- 시장 역학 이해
- 경쟁 분석
- 고객 인사이트
- 시장 예측
- 위험 완화
- 전략 기획
- 투자 타당성 분석
- 신흥 시장 파악
- 마케팅 전략 강화
- 운영 효율성 향상
- 규제 동향에 발맞춰 대응


 무료 샘플 받기 - 가스 파이프라인 인프라 시장