고속 카메라 시장 개요, 성장, 동향, 분석, 연구 보고서(2018-2027)
이전 데이터 : 2016-2017 | 기준 연도 : 2018 | 예측 기간 : 2019-20272027년까지의 고속 카메라 시장 - 구성 요소(이미지 센서, 렌즈, 배터리, 이미지 프로세서, 팬 및 냉각 시스템, 메모리 시스템 및 기타)별 글로벌 분석 및 예측; 해상도(2MP, 2~5MP, 5MP 이상), 프레임 속도(1,000~5,000, 5,000~20,000, 20,000~100,000 및 100,000 이상) 및 응용 분야(자동차 및 운송, 산업 제조, 식음료, 가전 제품, 미디어 및 엔터테인먼트, 스포츠, 의료 및 기타)별
- 상태 : 게시됨
- 보고서 코드 : TIPTE00002539
- 범주 : 전자 및 반도체
- 페이지 수 : 226
- 사용 가능한 보고서 형식 :


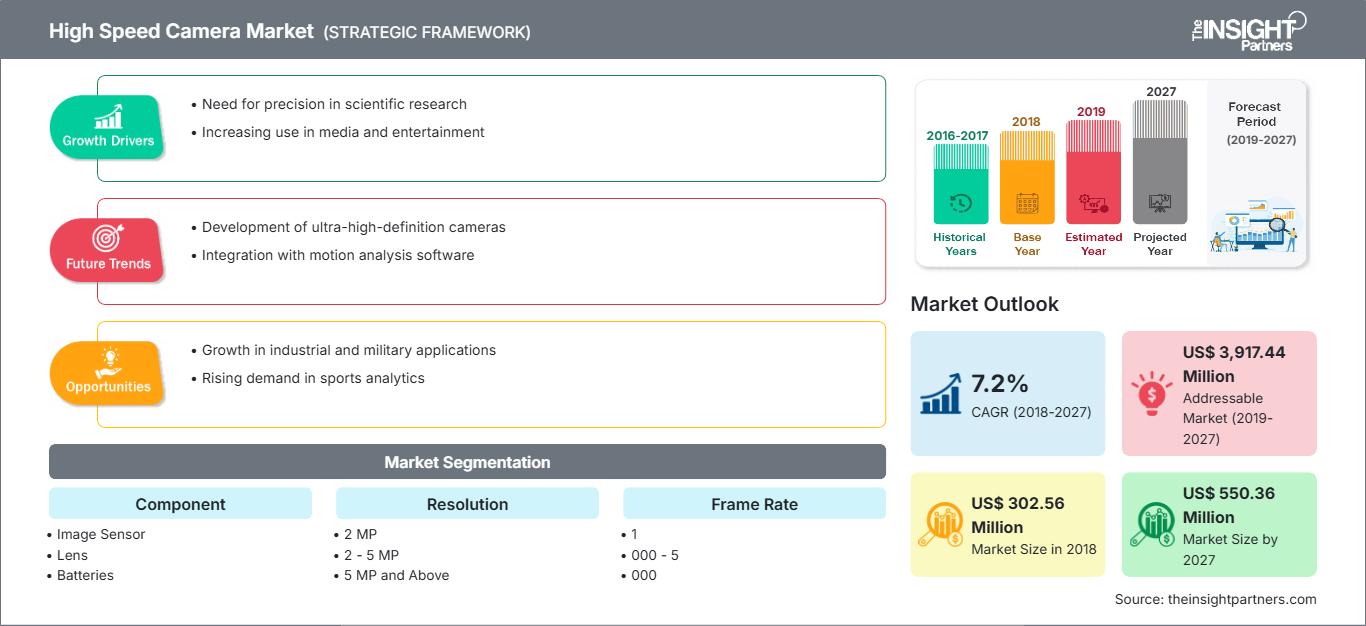
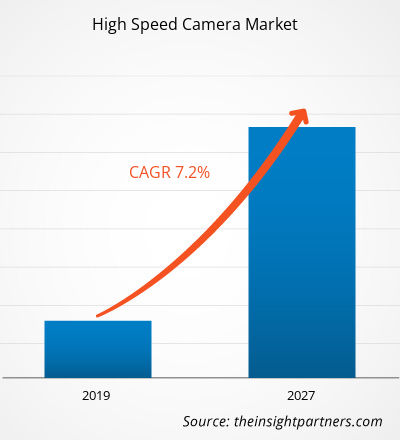
고속 카메라 시장은 2018년 3억 256만 달러 규모였으며, 2027년에는 5억 5,036만 달러에 이를 것으로 예상됩니다. 2019년부터 2027년까지 연평균 7.2% 성장할 것으로 예상됩니다.
고속 카메라는 슬로우 모션 영상 촬영에 사용됩니다. 수천 장의 버스트 이미지를 촬영하고 이를 합성하여 부드러운 영상을 만들어냅니다. 슬로우 모션 영상을 분석하고 육안으로는 볼 수 없는 효과를 포착하는 데 사용됩니다. 고속 센서 기술의 발전은 고속 카메라 개발의 가능성을 제시했습니다. 더욱 향상된 해상도는 노이즈가 적은 더욱 선명한 이미지를 가능하게 하여, 이전에는 볼 수 없었던 사건의 측면을 사용자가 더 잘 볼 수 있도록 합니다. 고속 카메라를 사용하면 육안으로는 보기 힘든 매우 빠른 속도의 사건도 분석하고 포착할 수 있습니다. 고객의 요구를 충족하고 고속 카메라의 여러 핵심 응용 분야를 활용하기 위해 1989년 이후 고속 디지털 이미징 기술이 개발되었습니다.
슬로우 모션 영상을 제공하려면 표준 제작 프레임 속도보다 1,000배 빠른 이미지를 수집하는 카메라를 사용하는 것이 당연합니다. 이렇게 하면 화질 저하 없이 영상 속도를 더욱 낮출 수 있습니다. 고속 카메라는 일반적으로 두 가지 유형으로 분류됩니다.
- 슈퍼 모션 또는 슈퍼 슬로모션: 표준 프레임 속도의 2배(100~120fps)에서 10배(500~600fps) 속도로 작동하는 카메라입니다.
- 하이퍼 모션: 1,000fps 이상의 속도로 작동하며 짧은 버스트 영상을 카메라 내부 메모리에 녹화합니다.
고속 카메라에 대한 수요가 증가하고 있습니다. 다양한 산업 분야에서 슬로우 모션 이벤트를 더 효과적으로 분석하기 위해 이러한 카메라를 선택하고 있습니다. 수요 증가에 따라 카메라 생산량 또한 증가할 것이며, 이는 고속 카메라 부품 비용 절감으로 이어질 것입니다. 고속 카메라 제조에는 맞춤형 부품이 필요한데, 이는 스튜디오 카메라 소비자와는 완전히 다른 문제입니다. 이러한 카메라의 고속 셔터 속도는 맞춤형 이미지 센서, 데이터 저장 장치, 연결 솔루션, 배터리, 열 관리, 더 빠른 이미지 프로세서, 그리고 차세대 저장 기술을 요구합니다. 이러한 모든 맞춤형 부품은 추가 비용을 발생시켜 시장 성장을 저해해 왔습니다. 그러나 전 세계적으로 다양한 산업 분야의 수요가 증가함에 따라 생산량도 증가할 것입니다. 앞서 언급했듯이 규모의 경제가 실현되어 고속 카메라 가격이 하락할 것입니다. 따라서 카메라 생산량 증가로 규모의 경제가 실현되어 전체 카메라 가격이 하락할 것입니다. 가격 하락으로 고속 카메라 수요는 더욱 증가할 것으로 예상됩니다.
이 보고서의 일부, 국가 수준 분석, Excel 데이터 팩을 포함하여 모든 보고서에 대한 사용자 정의를 무료로 받을 수 있을 뿐만 아니라 스타트업 및 대학을 위한 훌륭한 제안 및 할인을 이용할 수 있습니다
고속 카메라 시장: 전략적 통찰력
-
이 보고서의 주요 주요 시장 동향을 확인하세요.이 무료 샘플에는 시장 동향부터 추정 및 예측에 이르기까지 데이터 분석이 포함됩니다.
최근 고속 카메라는 다양한 해상도로 제공됩니다. 일반적으로 해상도는 1~5메가픽셀(MP)입니다. 고속 카메라의 시야가 넓거나 연구해야 할 고속 이벤트의 세부 사항이 많아 최소한의 공간 해상도가 예상되는 경우 더 높은 해상도가 필요합니다. 카메라의 해상도가 높을수록 최대 프레임 속도가 약해지는 것은 보편적인 사실입니다. 5MP 카메라의 경우 1MP 카메라보다 처리해야 할 픽셀이 5배 더 많습니다. 따라서 고해상도 카메라로 저해상도 카메라와 동일한 프레임 속도를 달성하는 것은 불가능합니다. 이미지 센서와 이미지 프로세서 처리 능력이 발전함에 따라 앞으로는 5MP 카메라로 1MP 카메라와 동일한 프레임 속도를 달성할 수 있습니다. 따라서 2019년부터 예측 기간 동안 - 2027년에는 기술 발전으로 더 높은 해상도에서 더 높은 프레임 속도를 제공할 것입니다.
부품 부문 분석
고속 카메라 시장은 부품별로 이미지 센서, 렌즈, 배터리, 이미지 프로세서, 팬 및 냉각 시스템, 메모리 시스템 등으로 구분됩니다. 이미지 센서 부문은 기업 및 일반 기업에서 광범위하게 사용되고 있어 고속 카메라 시장에서 가장 큰 시장 점유율을 차지할 것으로 예상됩니다. 고속 카메라에는 센서, 프로세서, 렌즈, 메모리 시스템, 팬 및 냉각 시스템, 메모리 시스템 등 여러 핵심 부품이 포함됩니다. 모든 고속 카메라는 이러한 핵심 부품에 대한 신뢰성을 바탕으로 최상의 결과를 제공합니다. 부품의 형태는 고속 카메라의 종류에 따라 다릅니다. 고속 카메라는 이러한 부품들을 특징으로 하며, 용도에 따라 다양한 수준의 맞춤 설정이 가능합니다. 고속 카메라 부품은 이러한 제품이 사용되는 모든 산업에서 중요한 역할을 합니다.
해상도 세그먼트 분석
고속 카메라 시장은 해상도를 기준으로 2MP, 2~5MP, 5MP 이상으로 구분됩니다. 고속 카메라의 픽셀 해상도는 구매 전 고려해야 할 중요한 요소입니다. 고속 카메라는 다양한 해상도로 제공됩니다. 고해상도 카메라는 카메라의 시야각이 넓거나 고속 이벤트에서 수많은 미세한 디테일을 포착하기 위해 매우 낮은 공간 해상도가 필요한 경우에 적합합니다.
프레임 속도 세그먼트 분석
고속 카메라 시장은 해상도를 기준으로 1,000~5,000, 5,000~20,000, 20,000~100,000, 100,000 이상으로 구분됩니다. 고속 카메라 구매 시 고려해야 할 주요 요소는 프레임 속도입니다. 대부분의 고속 카메라는 픽셀 해상도가 낮아질수록 점점 더 높은 프레임 속도로 작동할 수 있습니다. 그러나 프레임 속도 증가는 해상도 감소와 완전히 비례하지 않으며, 일반적으로 해상도 감소에 따라 선택해야 하는 수평 및/또는 수직 픽셀 수에 제한이 따릅니다. 고속 카메라는 성능 수준과 가격 범위가 매우 다양합니다.
응용 분야 분석
응용 분야별로 고속 카메라 시장은 자동차 및 운송, 산업 제조, 식음료, 가전제품, 미디어 및 엔터테인먼트, 스포츠, 의료 등으로 구분됩니다. 고속 카메라는 거의 모든 산업 분야에서 다양한 용도로 널리 사용됩니다. 이러한 시스템은 자동 품질 보증 및 고속 작업을 위한 강력한 방법을 제공합니다. 고속 카메라는 주로 자동차 부문과 제조 부문에서 사용됩니다. 이러한 카메라는 제조 기반 용도뿐만 아니라 운송 및 물류 서비스에서도 유용한 도구로 활용됩니다.
시장 참여자들은 경쟁사와의 경쟁을 위해 첨단 기술과 기능을 제품에 통합하여 신제품 혁신 및 개발에 집중합니다.
2019년: NEC Corporation은 이시카와 세노오 연구실, 도쿄대학교, 정보과학기술대학원 등의 파트너와 협력하여 고속 카메라 객체 인식 시스템을 개발했습니다. 이 카메라는 인공지능(AI)을 사용하여 초당 1,000프레임의 속도로 작동하는 고속 카메라로 촬영한 대량의 이미지를 즉시 검토합니다. 2019년: AOS Technologies는 M-VIT 카메라 지원, OSD 로고 지원, 자동 다운로드 기능, 동영상 내보내기 해상도 조정 기능, 전역 삭제 버퍼 모드 등의 기능을 갖춘 New Imaging Studio v4를 출시했습니다.
글로벌 고속 카메라 시장은 다음과 같이 세분화됩니다.
고속 카메라 시장 지역별 통찰력
The Insight Partners의 분석가들은 예측 기간 동안 고속 카메라 시장에 영향을 미치는 지역별 동향과 요인들을 면밀히 분석했습니다. 이 섹션에서는 북미, 유럽, 아시아 태평양, 중동 및 아프리카, 그리고 중남미 지역의 고속 카메라 시장 부문 및 지역별 현황도 살펴봅니다.
고속 카메라 시장 보고서 범위
| 보고서 속성 | 세부 |
|---|---|
| 시장 규모 2018 | US$ 302.56 Million |
| 시장규모별 2027 | US$ 550.36 Million |
| 글로벌 CAGR (2018 - 2027) | 7.2% |
| 이전 데이터 | 2016-2017 |
| 예측 기간 | 2019-2027 |
| 다루는 세그먼트 |
By 구성 요소
|
| 포함된 지역 및 국가 |
북미
|
| 시장 선도 기업 및 주요 회사 프로필 |
|
고속 카메라 시장 참여자 밀도: 비즈니스 역학에 미치는 영향 이해
고속 카메라 시장은 소비자 선호도 변화, 기술 발전, 그리고 제품 장점에 대한 인식 제고 등의 요인으로 인한 최종 사용자 수요 증가에 힘입어 빠르게 성장하고 있습니다. 수요가 증가함에 따라 기업들은 제품 라인업을 확장하고, 소비자 니즈를 충족하기 위한 혁신을 추진하며, 새로운 트렌드를 적극 활용하고 있으며, 이는 시장 성장을 더욱 가속화하고 있습니다.
- 을 얻으세요 고속 카메라 시장 주요 주요 플레이어 개요
- 이미지 센서
- 렌즈
- 배터리
- 이미지 프로세서
- 팬 및 냉각 시스템
- 메모리 시스템
- 기타
글로벌 고속 카메라 시장 - 해상도별
- 2MP
- 2~5MP
- 5MP 이상
글로벌 고속 카메라 시장 - 프레임 속도별
- 1,000~5,000
- 5,000~20,000
- 20,000~ 100,000
- 100,000 이상
글로벌 고속 카메라 시장 - 응용 분야별
- 자동차 및 운송
- 산업 제조
- 가전 제품
- 미디어 및 엔터테인먼트
- 스포츠
- 헬스케어
- 기타
글로벌 고속 카메라 시장 - 지역별
-
북부 미국
- 미국
- 캐나다
- 멕시코
-
유럽
- 프랑스
- 독일
- 이탈리아
- 영국
- 러시아
- 나머지 국가 유럽
-
아시아 태평양(APAC)
- 중국
- 대한민국
- 인도
- 일본
- 호주
- 나머지 아시아 태평양
-
중동 및amp; 아프리카(MEA)
- 사우디아라비아
- UAE
- 남아프리카공화국
- 기타 중동 및amp; 아프리카
-
남아메리카
- 브라질
- 아르헨티나
- 남아메리카 기타 지역
글로벌 고속 카메라 시장 - 회사 프로필
- AOS Technologies AG
- Edgertronic
- Fastec Imaging
- 통합 설계 도구
- Mega Speed USA
- Mikrotron GmBH
- NAC Image Technology
- NEC Corporation
- Optronis GmBH
- PCO AG
- Photron
- 슬로모션 카메라 회사
- Vision Research

나빈은 맞춤형, 신디케이트 및 컨설팅 프로젝트 전반에 걸쳐 9년 이상의 전문 지식을 보유한 시장 조사 및 컨설팅 전문가입니다. 현재 부사장으로 재직 중이며, 프로젝트 가치 사슬 전반의 이해관계자들을 성공적으로 관리해 왔으며, 100편 이상의 연구 보고서와 30건 이상의 컨설팅 업무를 수행했습니다. 그는 산업 및 정부 프로젝트 전반에 걸쳐 다양한 업무를 수행하며 고객 성공과 데이터 기반 의사 결정에 크게 기여하고 있습니다.
나빈은 카르나타카주 VTU에서 전자통신 공학 학위를, 마니팔 대학교에서 마케팅 및 운영 MBA를 취득했습니다. 그는 9년 동안 IEEE 회원으로 활발하게 활동하며 컨퍼런스, 기술 심포지엄에 참여하고 지역 및 지역 차원에서 자원봉사 활동을 해왔습니다. 현재 직책을 맡기 전에는 IndustryARC에서 준전략 컨설턴트로, 휴렛팩커드(HP Global)에서 산업용 서버 컨설턴트로 근무했습니다.
- 과거 분석(2년), 기준 연도, CAGR을 포함한 예측(7년)
- PEST 및 SWOT 분석
- 시장 규모 가치/거래량 - 글로벌, 지역, 국가
- 산업 및 경쟁 환경
- Excel 데이터세트
사용 후기
Insight Partners의 SCADA 시스템 시장 보고서는 포괄적이며, 현재 동향과 미래 전망에 대한 귀중한 통찰력을 제공합니다. 팀은 매우 전문적이고, 신속하게 대응하며, 처음부터 끝까지 지원해 주었습니다. 저희는 매우 만족하며 Insight Partners의 서비스를 적극 추천합니다.
란 케뎀 파트너, Reali Technologies LTDs아주 구체적인 소프트웨어 시장에 대한 보고서를 요청했는데, 팀에서 며칠 만에 보고서를 작성해 주셨습니다. 정보는 매우 관련성이 높고 잘 정리되어 있었습니다. 그 후 보고서에 몇 가지 수정과 추가 사항을 요청했습니다. 팀원들의 응답도 매우 빨랐고, 일주일도 채 되지 않아 최종 보고서를 받았습니다.
장-에르브 젠 의장, 퓨처 애널리티카The Insight Partners와 함께 중요한 시장 조사 및 예측 작업을 진행했습니다. Insight Partners는 기회와 위험에 대한 명확한 통찰력을 제공하여 계획을 세우는 데 큰 도움이 되었습니다. The Insight Partners의 조사는 사용하기 쉬웠고, 탄탄한 데이터를 기반으로 했습니다. 덕분에 현명하고 자신 있는 결정을 내릴 수 있었습니다. The Insight Partners를 강력 추천합니다.
피유시 나그팔 수석 부사장, 하이빔 글로벌Insight Partners는 탄탄한 분야 전문성을 바탕으로 통찰력 있고 체계적인 시장 조사를 제공했습니다. Insight Partners 팀은 처음부터 끝까지 전문적이고 신속하게 대응했습니다. 사용자 친화적인 웹사이트 덕분에 업계 보고서에 쉽게 접근할 수 있었습니다. 신뢰할 수 있고 고품질의 조사 서비스를 원하신다면 Insight Partners를 강력 추천합니다.
아다치 유키히코 대표이사, 딥블루 주식회사The Insight Partners에서 시장 보고서를 구매한 것은 이번이 처음입니다. 처음에는 확신이 없었지만, 웹사이트를 방문하고 나서 위험을 감수하고 시장 보고서를 구매하는 것이 더 편하다는 것을 알게 되었습니다. 보고서의 품질과 고객 서비스에 매우 만족합니다. 처음 보고서를 보고 몇 가지 질문과 의견이 있었지만, 분석가와 이메일로 몇 차례 대화를 나눈 후, 전략 기획 과정에 참고할 수 있는 보고서를 확보했다고 생각합니다. 시간을 내어 긍정적인 경험을 선사해 주셔서 정말 감사합니다. 다른 사람들에게도 귀사의 서비스를 적극 추천할 것이며, 추가적인 시장 데이터가 필요할 때면 가장 먼저 귀사에 연락하겠습니다.
존 스즈키 사장 겸 최고 경영자, 이사회 이사, BK 테크놀로지스나이지리아 감염성 질환 IVD 시장 관련 정보 요청에 응해 주신 귀사의 지원과 전문성에 감사드립니다. 귀사의 인내심과 지도, 그리고 할인 혜택을 기꺼이 제공해 주셔서 결국 계약을 성사시킬 수 있었습니다. 첫 만남을 통해 귀사가 저에게 심어주신 좋은 인상을 바탕으로 앞으로도 The Insight Partners와 함께할 수 있기를 기대합니다.
치지오케 박사 오니아 전무이사, 파인크레스트 헬스케어 유한회사구매 이유
- 정보에 기반한 의사 결정
- 시장 역학 이해
- 경쟁 분석
- 고객 인사이트
- 시장 예측
- 위험 완화
- 전략 기획
- 투자 타당성 분석
- 신흥 시장 파악
- 마케팅 전략 강화
- 운영 효율성 향상
- 규제 동향에 발맞춰 대응


 무료 샘플 받기 - 고속 카메라 시장