2028년 규모, 점유율, 성장, 동향에 따른 높은 처리량 스크리닝 시장 분석 및 예측
이전 데이터 : 2019-2020 | 기준 연도 : 2021 | 예측 기간 : 2022-20282028년까지의 고처리량 스크리닝 시장 전망 - COVID-19 영향 및 제품 및 서비스(소모품, 기기, 액세서리, 소프트웨어 및 서비스), 기술(세포 기반 분석, 랩온어칩, 초고처리량 스크리닝, 생물정보학 및 라벨 없는 기술), 응용 분야(신약 발견, 생화학 스크리닝, 생명 과학 연구 및 기타 응용 분야), 최종 사용자(제약 및 생명공학 회사, 학계 및 정부 기관, 계약 연구 기관(CRO) 및 기타)별 글로벌 분석
- 상태 : 게시됨
- 보고서 코드 : TIPBT00002085
- 범주 : 생명과학
- 페이지 수 : 246
- 사용 가능한 보고서 형식 :


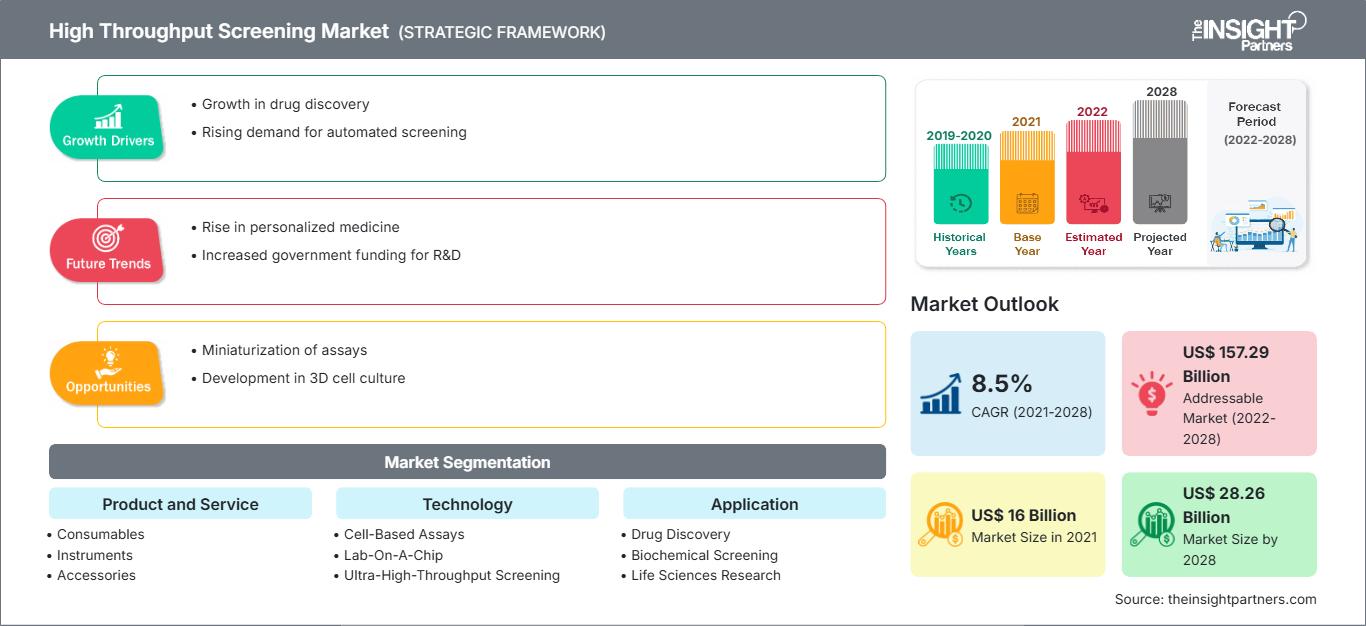
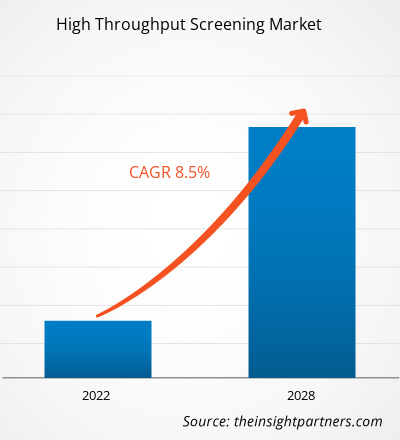
고처리량 스크리닝 시장은 2021년 159억 9,747만 달러에서 2028년에는 282억 5,571만 달러에 이를 것으로 예상됩니다. 이 시장은 2021년부터 2028년까지 연평균 성장률 8.5%로 성장할 것으로 예상됩니다.
고처리량 스크리닝(HTS)은 특정 생물학적 표적에 대한 다양한 화학 또는 생물학적 화합물의 자동화된 검사를 가능하게 하는 약물 발굴 방법입니다. 고처리량 스크리닝 방법은 제약 산업에서 널리 사용되고 있으며, 로봇 공학과 자동화를 활용하여 다수의 분자, 특히 약물의 생물학적 또는 생화학적 활성을 신속하게 검사합니다. 대규모 화합물 라이브러리를 비용 효율적으로 스크리닝할 수 있으므로 표적 분석 속도가 빨라집니다. HTS는 약리학적 표적을 평가하고, 수용체(예: GPCR) 및 효소에 대한 작용제 및 길항제의 약리학적 프로파일링을 위한 귀중한 도구입니다. 연구 및 제약 및 생명공학 산업의 발전과 고처리량 스크리닝 시장에 기술적으로 진보된 제품들이 도입됨에 따라 향후 시장 성장이 촉진될 것으로 예상됩니다. 그러나 고처리량 스크리닝의 높은 비용, 숙련된 전문가 부족, 그리고 분석법 개발의 복잡성은 향후 몇 년간 시장 성장을 저해할 가능성이 높습니다.
시장 분석
제약 및 생명공학 산업의 연구 개발 투자 증가
제약 및 생명공학 기업의 연구 개발(R&D) 지출 증가와 심혈관 질환, 암, 면역 질환, 대사 질환, 신경 질환 등 다양한 만성 질환 치료를 위한 중요한 약물 파이프라인은 고처리량 스크리닝 시장의 주요 성장 동력입니다. 여러 크고 작은 제약 회사들이 생명을 위협하는 여러 질병에 대한 새로운 분자를 개발하고 생산하고 있습니다. 이로 인해 끊임없이 증가하는 약물 표적 분자의 수요를 충족하기 위해 방대한 화학 라이브러리를 스크리닝하는 자동화된 고처리량 스크리닝(HTS) 방법이 선택되고 있습니다. 예를 들어, 자동화된 고처리량 스크리닝 시스템은 하루에 약 10,000개에서 100,000개의 표적 화합물을 스크리닝할 수 있습니다. 제약 및 바이오테크 기업들은 지난 10년 동안 고처리량 스크리닝 기술에 상당한 투자를 해왔습니다. 예를 들어, 밀레니엄 파마슈티컬스(Millennium Pharmaceuticals, Inc.)와 바이엘(Bayer AG)의 유명한 제휴는 18개의 신약 표적을 성공적으로 발굴하고 그중 4개를 단 8개월 만에 고처리량 스크리닝에 포함시켰습니다. 이 제휴는 유전체학 연구에 기반한 새로운 생산 방식을 채택하여 분자를 최대한 빨리 임상 시험에 투입합니다. 고처리량 스크리닝은 신약 개발 과정에서 필수적인 기술로 여겨져 왔습니다. 예를 들어, 베링거 인겔하임의 완전 개발된 리드 구조 최적화 프로그램의 60% 이상이 HTS의 성공적인 구현에 기인합니다. 미국에서만 HTS 제품과 HTS 서비스에 매년 25억 달러 이상이 지출되고 있습니다. 대형 제약 회사들은 스크리닝 기술에 매년 최대 3,500만 달러를 투자합니다. 이러한 투자의 상당 부분은 새로운 분석법 개발에 사용됩니다.
이 보고서의 일부, 국가 수준 분석, Excel 데이터 팩을 포함하여 모든 보고서에 대한 사용자 정의를 무료로 받을 수 있을 뿐만 아니라 스타트업 및 대학을 위한 훌륭한 제안 및 할인을 이용할 수 있습니다
고처리량 스크리닝 시장: 전략적 통찰력
-
이 보고서의 주요 주요 시장 동향을 확인하세요.이 무료 샘플에는 시장 동향부터 추정 및 예측에 이르기까지 데이터 분석이 포함됩니다.
신약 발견 및 개발에 사용되는 스크리닝 대상 약물의 증가와 정부 및 연구 기관의 투자 증가는 HTS 기술 도입을 더욱 촉진할 것입니다. 예를 들어, 2020년 12월, 영국에 본사를 둔 독립적인 통합 신약 발견 및 전임상 임상시험 수탁기관인 시그네이처 디스커버리(Sygnature Discovery)는 고속 처리 스크리닝(HTS) 및 중개 종양학 서비스 강화를 위해 약 412만 달러를 투자했습니다. 또한, 미국 FDA, 환경보호청(EPA), 미국 국립보건원(NIH)의 합작 투자 사업인 "21세기 독성학(Toxicology in the 21st Century)"과 같은 프로그램은 화학물질, 제형 및 환경 약물 검사, 광범위한 독성 검사, 그리고 질병과 관련된 특정 경로를 개발하여 독성 수치를 예측하는 데 자동화된 HTS를 활용하고 있습니다. 이러한 사업은 고속 처리 스크리닝 시장의 확산을 뒷받침할 것입니다.
제품 및 서비스 기반 인사이트
고처리량 스크리닝 시장은 제품 및 서비스를 기준으로 소모품, 장비, 액세서리, 소프트웨어 및 서비스로 분류됩니다. 2021년에는 소모품 부문이 시장 점유율이 가장 높았으며, 예측 기간 동안 가장 빠른 연평균 성장률(CAGR)을 기록할 것으로 예상됩니다.
보고서 기술 기반 인사이트
고처리량 스크리닝 시장은 기술 기준으로 세포 기반 분석, 랩온어칩(Lab-on-a-Chip), 초고처리량 스크리닝, 생물정보학, 무표지 기술로 세분화됩니다. 2021년에는 세포 기반 분석 분야가 시장 점유율 1위를 차지했으며, 랩온어칩 분야는 예측 기간 동안 가장 빠른 CAGR로 성장할 것으로 예상됩니다.
응용 분야 기반 인사이트
응용 분야를 기준으로 고처리량 스크리닝 시장은 신약 개발, 생화학 스크리닝, 생명과학 연구 및 기타 분야로 세분화됩니다. 2021년에는 신약 개발 분야가 시장 점유율 1위를 차지했으며 예측 기간 동안 가장 빠른 CAGR로 성장할 것으로 예상됩니다.
최종 사용자 기반 인사이트
최종 사용자 기반 고처리량 스크리닝 시장은 제약 및 생명공학 기업, 학계 및 정부 기관, 임상시험수탁기관(CRO) 등으로 세분화됩니다. 2021년에는 제약 및 생명공학 기업 부문이 시장 점유율이 가장 높았으며, 임상시험수탁기관(CRO) 부문은 예측 기간 동안 가장 빠른 CAGR로 성장할 것으로 예상됩니다.
고처리량 스크리닝 시장에서 활동하는 다양한 기업들은 제품 출시, 인수합병, 협업, 제품 혁신, 제품 포트폴리오 확장 등의 전략을 채택하여 전 세계적으로 입지를 확장하고, 브랜드 인지도를 유지하며, 최종 사용자의 증가하는 수요를 충족하고 있습니다.
고처리량 스크리닝 시장 지역별 통찰력
The Insight Partners의 분석가들은 예측 기간 동안 고처리량 스크리닝 시장에 영향을 미치는 지역별 동향과 요인들을 면밀히 분석했습니다. 이 섹션에서는 북미, 유럽, 아시아 태평양, 중동 및 아프리카, 그리고 중남미 지역의 고처리량 스크리닝 시장 부문 및 지역별 현황도 살펴봅니다.
고처리량 스크리닝 시장 보고서 범위
| 보고서 속성 | 세부 |
|---|---|
| 시장 규모 2021 | US$ 16 Billion |
| 시장규모별 2028 | US$ 28.26 Billion |
| 글로벌 CAGR (2021 - 2028) | 8.5% |
| 이전 데이터 | 2019-2020 |
| 예측 기간 | 2022-2028 |
| 다루는 세그먼트 |
By 제품 및 서비스
|
| 포함된 지역 및 국가 |
북미
|
| 시장 선도 기업 및 주요 회사 프로필 |
|
고처리량 스크리닝 시장 참여자 밀도: 비즈니스 역학에 미치는 영향 이해
고처리량 스크리닝 시장은 소비자 선호도 변화, 기술 발전, 그리고 제품 효능에 대한 인식 제고 등의 요인으로 인한 최종 사용자 수요 증가에 힘입어 빠르게 성장하고 있습니다. 수요가 증가함에 따라 기업들은 제품 및 서비스를 확장하고, 소비자 니즈를 충족하기 위한 혁신을 추진하며, 새로운 트렌드를 적극 활용하고 있으며, 이는 시장 성장을 더욱 가속화하고 있습니다.
- 을 얻으세요 고처리량 스크리닝 시장 주요 주요 플레이어 개요
고처리량 스크리닝 시장 - 제품 및 서비스별
- 소모품
- 시약 및 분석 키트
- 실험실 장비
- 기기
- 액체 취급 시스템
- 검출 시스템
- 액세서리
- 소프트웨어
- 서비스
고처리량 스크리닝 시장 - 기술별
- 세포 기반 분석
- 랩온어칩
- 초고처리량 스크리닝
- 생물정보학
- 무표지 기술
- 표면 플라스몬 공명
- 반사 간섭법
- 등온 적정 열량측정법
- 시차 주사 열량측정법
- 마이크로캔틸레버
- 탄소 나노튜브
- 광자 결정
- 기타
응용 분야별 고처리량 스크리닝 시장
- 신약 발견
- 생화학 스크리닝
- 생명 과학 연구
- 기타 응용 분야
고처리량 스크리닝 시장 - 최종 사용자별
- 제약 및 생명공학 회사
- 학계 및 정부 기관
- 계약 연구 기관(CRO)
- 기타
고처리량 스크리닝 시장 - 지역별
-
북미
- 미국
- 캐나다
- 멕시코
-
유럽
- 프랑스
- 독일
- 이탈리아
- 영국
- 스페인
- 나머지 유럽
-
아시아 태평양(APAC)
- 중국
- 인도
- 대한민국
- 일본
- 호주
- 나머지 아시아 태평양
-
중동 및amp; 아프리카(MEA)
- 남아프리카
- 사우디아라비아
- UAE
- 중동 및 기타 지역 및amp; 아프리카
-
남아메리카(SAM)
- 브라질
- 아르헨티나
- 남아메리카 및 중미 지역
회사 프로필
- Agilent Technologies, Inc.
- Axxam SPA
- Eurofins Scientific
- Corning Incorporated
- Molecular Devices, LLC.
- Hamilton Company
- Merck Group
- Perkinelmer, Inc.
- Tecan Group
- Thermo Fisher Scientific Inc.

Mrinal은 생명 과학 시장 정보 분석 및 컨설팅 분야에서 8년 이상의 경력을 보유한 노련한 리서치 분석가입니다. 전략적 사고방식과 탁월함을 향한 확고한 의지를 바탕으로 제약 예측, 시장 기회 평가, 업계 벤치마크 개발 분야에서 심도 있는 전문 지식을 쌓아 왔습니다. 그녀의 업무는 고객이 정보에 기반한 전략적 의사 결정을 내릴 수 있도록 실질적인 통찰력을 제공하는 데 중점을 두고 있습니다.
Mrinal의 핵심 강점은 복잡한 정량적 데이터 세트를 의미 있는 비즈니스 인텔리전스로 변환하는 것입니다. 그녀의 분석적 통찰력은 제약 및 의료기기 분야의 시장 진출(GTM) 전략을 수립하고 성장 기회를 발굴하는 데 중요한 역할을 합니다. 신뢰할 수 있는 컨설턴트로서, 그녀는 고객의 워크플로 프로세스를 간소화하고 모범 사례를 구축하는 데 지속적으로 집중하여 혁신과 운영 효율성을 향상시킵니다.
- 과거 분석(2년), 기준 연도, CAGR을 포함한 예측(7년)
- PEST 및 SWOT 분석
- 시장 규모 가치/거래량 - 글로벌, 지역, 국가
- 산업 및 경쟁 환경
- Excel 데이터세트
사용 후기
Insight Partners의 SCADA 시스템 시장 보고서는 포괄적이며, 현재 동향과 미래 전망에 대한 귀중한 통찰력을 제공합니다. 팀은 매우 전문적이고, 신속하게 대응하며, 처음부터 끝까지 지원해 주었습니다. 저희는 매우 만족하며 Insight Partners의 서비스를 적극 추천합니다.
란 케뎀 파트너, Reali Technologies LTDs아주 구체적인 소프트웨어 시장에 대한 보고서를 요청했는데, 팀에서 며칠 만에 보고서를 작성해 주셨습니다. 정보는 매우 관련성이 높고 잘 정리되어 있었습니다. 그 후 보고서에 몇 가지 수정과 추가 사항을 요청했습니다. 팀원들의 응답도 매우 빨랐고, 일주일도 채 되지 않아 최종 보고서를 받았습니다.
장-에르브 젠 의장, 퓨처 애널리티카The Insight Partners와 함께 중요한 시장 조사 및 예측 작업을 진행했습니다. Insight Partners는 기회와 위험에 대한 명확한 통찰력을 제공하여 계획을 세우는 데 큰 도움이 되었습니다. The Insight Partners의 조사는 사용하기 쉬웠고, 탄탄한 데이터를 기반으로 했습니다. 덕분에 현명하고 자신 있는 결정을 내릴 수 있었습니다. The Insight Partners를 강력 추천합니다.
피유시 나그팔 수석 부사장, 하이빔 글로벌Insight Partners는 탄탄한 분야 전문성을 바탕으로 통찰력 있고 체계적인 시장 조사를 제공했습니다. Insight Partners 팀은 처음부터 끝까지 전문적이고 신속하게 대응했습니다. 사용자 친화적인 웹사이트 덕분에 업계 보고서에 쉽게 접근할 수 있었습니다. 신뢰할 수 있고 고품질의 조사 서비스를 원하신다면 Insight Partners를 강력 추천합니다.
아다치 유키히코 대표이사, 딥블루 주식회사The Insight Partners에서 시장 보고서를 구매한 것은 이번이 처음입니다. 처음에는 확신이 없었지만, 웹사이트를 방문하고 나서 위험을 감수하고 시장 보고서를 구매하는 것이 더 편하다는 것을 알게 되었습니다. 보고서의 품질과 고객 서비스에 매우 만족합니다. 처음 보고서를 보고 몇 가지 질문과 의견이 있었지만, 분석가와 이메일로 몇 차례 대화를 나눈 후, 전략 기획 과정에 참고할 수 있는 보고서를 확보했다고 생각합니다. 시간을 내어 긍정적인 경험을 선사해 주셔서 정말 감사합니다. 다른 사람들에게도 귀사의 서비스를 적극 추천할 것이며, 추가적인 시장 데이터가 필요할 때면 가장 먼저 귀사에 연락하겠습니다.
존 스즈키 사장 겸 최고 경영자, 이사회 이사, BK 테크놀로지스나이지리아 감염성 질환 IVD 시장 관련 정보 요청에 응해 주신 귀사의 지원과 전문성에 감사드립니다. 귀사의 인내심과 지도, 그리고 할인 혜택을 기꺼이 제공해 주셔서 결국 계약을 성사시킬 수 있었습니다. 첫 만남을 통해 귀사가 저에게 심어주신 좋은 인상을 바탕으로 앞으로도 The Insight Partners와 함께할 수 있기를 기대합니다.
치지오케 박사 오니아 전무이사, 파인크레스트 헬스케어 유한회사구매 이유
- 정보에 기반한 의사 결정
- 시장 역학 이해
- 경쟁 분석
- 고객 인사이트
- 시장 예측
- 위험 완화
- 전략 기획
- 투자 타당성 분석
- 신흥 시장 파악
- 마케팅 전략 강화
- 운영 효율성 향상
- 규제 동향에 발맞춰 대응


 무료 샘플 받기 - 고처리량 스크리닝 시장