
스마트 제조 시장 동향, 수요 및 성장 전망 (2034년까지)
스마트 제조 시장 규모 및 전망(2021~2034), 글로벌 및 지역별 점유율, 트렌드 및 성장 기회 분석 보고서 범위: 최종 사용자(개별 제조 산업 및 공정 산업), 구성 요소(하드웨어 및 소프트웨어), 지역(북미, 유럽, 아시아 태평양, 남미 및 중미)별
- 상태 : 데이터 공개
- 보고서 코드 : TIPTE100000174
- 범주 : 기술, 미디어 및 통신
- 페이지 수 : 150
- 사용 가능한 보고서 형식 :


- 최종 업데이트 일자 : June 10, 2026

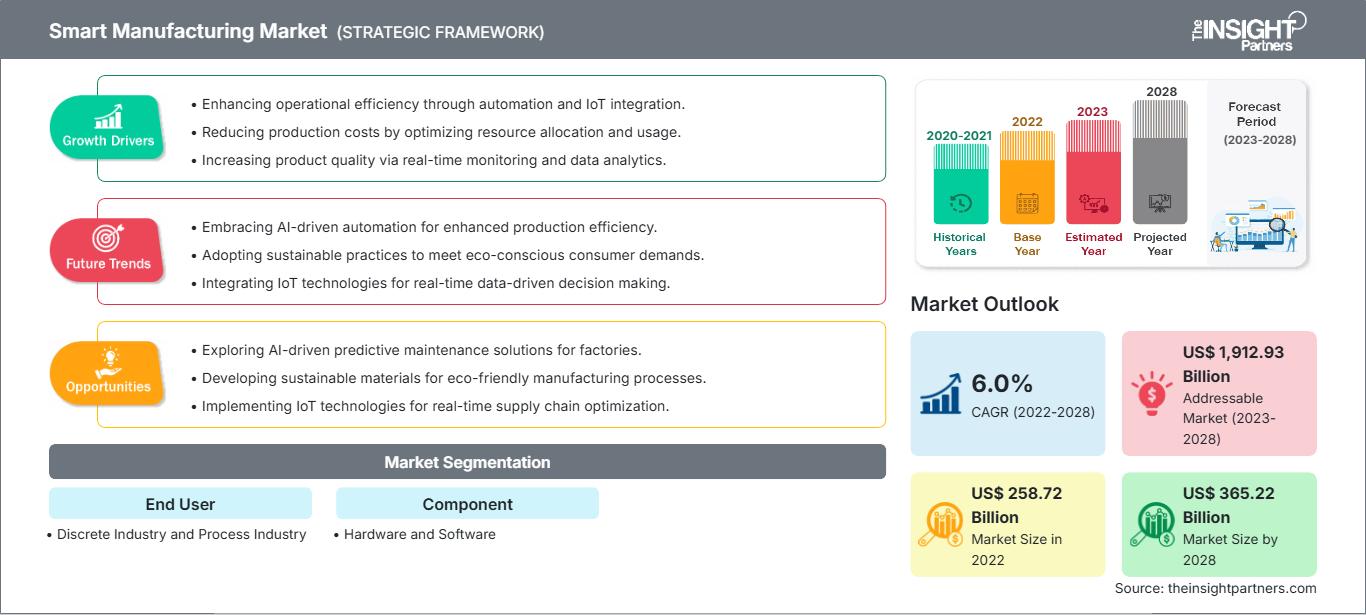
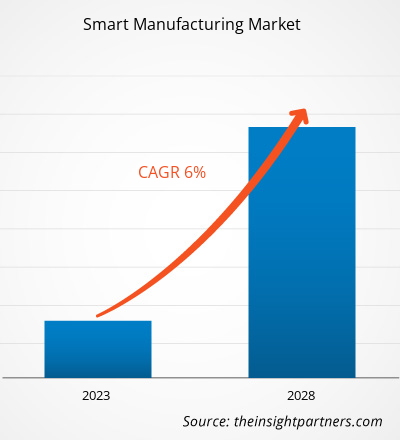
전 세계 스마트 제조 시장 규모는 2025년 3,413억 9천만 달러에서 2034년 1조 963억 5천만 달러에 이를 것으로 예상됩니다. 이 시장은 2026년부터 2034년까지 연평균 13.84%의 성장률을 기록할 것으로 전망됩니다.
주요 시장 동향으로는 인더스트리 4.0 이니셔티브에 대한 전 세계적인 관심 증가, 실시간 데이터 분석에 대한 산업 수요 증가, 자율 생산 시스템으로의 상당한 전환 등이 있습니다. 또한, 디지털 트윈의 인기 상승, 신흥 경제국 전반에 걸친 5G 산업 연결성 확대, 예측 유지보수 및 공급망 최적화와 같은 고부가가치 분야에 인공지능(AI) 및 머신러닝이 점차 도입됨에 따라 시장이 성장할 것으로 예상됩니다.
스마트 제조 시장 분석
스마트 제조 시장 분석에 따르면 제조업체들이 운영 민첩성과 자원 최적화를 우선시함에 따라 소프트웨어 정의 생산으로의 전환이 가속화되고 있습니다. 시장은 하드웨어 집약적인 로봇 자동화와 고성장 AI 전용 소프트웨어 플랫폼으로 이동하고 있습니다. 클라우드 기반 제조 실행 시스템(MES)과 산업용 엣지 컴퓨팅 분야에서 전략적 기회가 창출되고 있는데, 실시간 처리는 기존의 사일로화된 시스템에 비해 확실한 경쟁 우위를 제공합니다. 시장 확장은 연결된 공장의 사이버 보안 무결성과 다양한 IoT 생태계를 위한 상호 운용성 표준에 달려 있습니다. 지속 가능성, 탄소 발자국 감소, 생산 수명 주기 전반에 걸친 에너지 소비 추적 기능을 강조하는 디지털 전환 로드맵이 이제 경쟁 우위를 확보하는 핵심 요소가 되었습니다. 이러한 접근 방식은 기술 제공업체가 진입 장벽이 높은 시장에서 장기 계약을 확보하는 데 도움이 됩니다.
스마트 제조 시장 개요
제조 시스템은 틈새 시장의 자동화 셀에서 상호 연결된 생태계로 진화했습니다. 스마트 제조에는 협업 로봇, 적층 제조, 블록체인 기반 물류 등이 포함됩니다. 글로벌 기술 대기업과 산업용 사물 인터넷(IIoT) 전문 스타트업 모두 디지털 트윈, 증강 현실, 엣지 인텔리전스와 같은 기술을 활용하여 이 시장에서 경쟁하고 있습니다. 북미와 유럽의 첨단 산업에서 맞춤형 소량 생산에 대한 수요가 증가함에 따라 스마트 제조는 확장 가능한 산업 솔루션으로서 인기를 얻고 있습니다. 북미는 잘 구축된 연구 개발 인프라 덕분에 매출 면에서 선두를 달리고 있으며, 아시아 태평양 지역은 대규모 하드웨어 구축과 정부 주도의 자동화 도입을 통해 성장하고 있습니다. 미국 시장은 실험적 도입 단계를 거쳐 핵심 산업 인프라로 전환되었습니다. 연방 정부의 국내 복귀 정책과 견고한 항공우주 및 자동차 산업에 힘입어 디지털 우선 공장 아키텍처에 집중하고 있습니다. 첨단 기술 허브에서는 지역 회복력을 강화하기 위해 에이전트형 AI, 디지털 트윈, 안전한 데이터 파이프라인 구축을 우선시하고 있습니다.
이 보고서를 귀하의 요구사항에 맞게 맞춤 설정하십시오.
무료 맞춤 제작 서비스를 받으세요스마트 제조 시장: 전략적 통찰
-
이 보고서에서 주요 시장 동향을 확인하세요.이 무료 샘플에는 시장 동향부터 추정치 및 예측에 이르기까지 다양한 데이터 분석이 포함됩니다.
스마트 제조 시장 동인 및 기회
시장 동인:
- 인더스트리 4.0 및 IIoT 도입: 센서와 연결된 장치의 통합을 통해 공장 전체에 걸쳐 원활한 데이터 흐름이 가능해지며, 제조업체는 예측 분석을 통해 가동 중지 시간을 줄이고 생산량을 향상시킬 수 있습니다.
- 효율성 및 비용 절감에 대한 수요: 상승하는 인건비와 폐기물 감소의 필요성으로 인해 자동화 설비에 대한 수요가 지속적으로 높아지고 있습니다. 기업들이 스마트 공장으로 전환함에 따라 운영 오류 감소는 장기적인 투자 수익률(ROI) 향상에 기여합니다.
- 정부 정책 및 보조금: Manufacturing USA 및 Made in China 2025와 같은 전략적 프로그램은 중소기업의 기존 재정적 장벽을 제거했습니다. 이는 특히 아시아 태평양 및 북미 지역에서 자동화가 빠르게 도입되는 데서 두드러지게 나타납니다.
시장 기회:
- 3D 프린팅의 주류 생산 확대: 시제품 제작을 넘어, 적층 제조 기술은 자동차 및 의료 분야에서 주문형 예비 부품 생산과 경량 부품 설계에 상당한 기회를 제공합니다.
- 재생에너지 제조 부문의 성장: 기술 공급업체와 친환경 에너지 기업 간의 전략적 파트너십 구축은 정밀도가 매우 중요한 태양광 및 풍력 터빈 생산과 같은 고수익 시장 부문에 대한 접근을 용이하게 할 수 있습니다.
- 사이버 보안 및 데이터 무결성 서비스: 유럽 시장의 최근 주요 디지털 전환 프로젝트에서 볼 수 있듯이, 전문 산업 사이버 보안 인증을 통해 제조 부문을 공략할 수 있는 기회가 점점 커지고 있습니다.
스마트 제조 시장 보고서 세분화 분석
스마트 제조 시장 점유율은 시장 구조, 성장 잠재력 및 신흥 트렌드를 보다 명확하게 이해하기 위해 다양한 부문에 걸쳐 분석됩니다. 아래는 대부분의 산업 보고서에서 사용되는 표준 시장 세분화 방식입니다.
구성 요소별:
- 하드웨어: 전 세계적인 하드웨어 기반 자동화 추세에 발맞춰 빠르게 성장하는 틈새 시장입니다. 물리적인 로봇 팔, 센서, 3D 프린팅 장비 등을 도입하여 공장 현장을 현대화하려는 기업들이 점점 더 선호하는 분야입니다.
- 소프트웨어: 특히 AI, 클라우드 기반 MES 및 예측 분석 통합 분야에서, 디지털 공급망 구축 및 운영 효율성 향상으로 인해 판매량 증가를 주도하는 주요 동력입니다.
최종 사용자 기준:
- 개별 산업: 자동차, 항공우주 및 전자 제품을 포함합니다. 고속 조립 라인과 협업 로봇의 확대로 혜택을 받으며 스마트 제조의 주요 채널로 남아 있습니다.
- 공정 산업: 스마트 솔루션의 가장 빠르게 성장하는 분야로, 특히 석유 및 가스, 화학, 제약 산업에서 지속적인 모니터링과 안전한 위험 물질 취급을 가능하게 합니다.
지리학별:
- 북아메리카
- 유럽
- 아시아 태평양
- 남미 및 중앙아메리카
- 중동 및 아프리카
스마트 제조 시장 보고서 범위
| 보고서 속성 | 세부 |
|---|---|
| 2025년 시장 규모 | 3413억 9천만 달러 |
| 2034년 시장 규모 | 1조 963억 5천만 달러 |
| 글로벌 연평균 성장률(2026년~2034년) | 13.84% |
| 역사적 데이터 | 2021-2024 |
| 예측 기간 | 2026-2034 |
| 포함되는 부문 |
최종 사용자에 의해
|
| 대상 지역 및 국가 |
북아메리카
|
| 시장 선도 기업 및 주요 기업 프로필 |
|
스마트 제조 시장 참여자 밀도: 비즈니스 역학에 미치는 영향 이해
스마트 제조 시장은 소비자 선호도 변화, 기술 발전, 제품 이점 인식 제고 등 여러 요인으로 인한 최종 사용자 수요 증가에 힘입어 빠르게 성장하고 있습니다. 수요가 증가함에 따라 기업들은 제품 및 서비스 범위를 확장하고, 소비자 요구를 충족하기 위한 혁신을 추진하며, 새로운 트렌드를 활용하여 시장 성장을 더욱 촉진하고 있습니다.
지역별 스마트 제조 시장 점유율 분석
아시아 태평양 지역은 향후 몇 년 동안 가장 빠른 성장세를 보일 것으로 예상됩니다. 남미 및 중미, 중동, 아프리카의 신흥 시장 또한 산업 자동화 공급업체와 소프트웨어 개발업체가 확장할 수 있는 많은 잠재력을 가지고 있습니다.
스마트 제조 시장은 전통적인 수작업에서 고부가가치 디지털 운영으로의 전환이라는 중요한 변화를 겪고 있습니다. 이러한 성장은 자원 효율성 증대에 대한 요구, 스마트 팩토리 수요 급증, 그리고 고급 하이테크 산업의 확장에 힘입어 이루어지고 있습니다. 아래는 지역별 시장 점유율 및 동향에 대한 요약입니다.
1. 북미
- 시장 점유율: 탄탄한 연구 개발 인프라와 항공우주 및 방위 산업에 대한 막대한 투자를 바탕으로 전 세계에서 가장 큰 시장 점유율을 차지하고 있습니다.
-
주요 동인:
- 첨단 기술과 맞춤형 제품을 유연한 생산 시스템을 통해 생산하는 것에 대한 소비자 선호도가 높아지고 있습니다.
- 고급 자동차 및 방산 식료품 체인에 디지털 트윈과 산업용 AI를 주류화하는 방안.
- 5G 산업용 연결 기술 도입이 증가하고 있으며, 동시에 미국 현지에서 개발된 스마트 공장들이 등장하고 있습니다.
- 동향: 클라우드 기반 제조 실행 시스템(MES)의 확장과 안전을 중시하는 고객층의 관심을 끌기 위한 특수 사이버 보안 인증의 성공적인 도입.
2. 유럽
- 시장 점유율: 독일, 프랑스, 이탈리아, 영국에 깊이 뿌리내린 산업 4.0 생태계를 기반으로 지배적인 시장 점유율을 확보하고 있습니다.
-
주요 동인:
- 상징적인 정밀 엔지니어링 제품과 고급 기계류의 국내 소비가 높다.
- 잘 구축된 가공 인프라와 엄격한 규제 체계를 통해 친환경 제조 및 탄소 중립을 실현합니다.
- REPowerEU와 같은 사업 및 전략적 디지털화 보조금을 통한 강력한 정부 차원의 디지털화 지원.
- 동향: 수익성이 높은 예측 유지보수 서비스를 위해 하드웨어보다 소프트웨어 기반의 밀크 풀을 우선시하는 전략적 변화가 나타나고 있습니다. 또한, 환경을 중시하는 유럽 소비자들의 요구에 부응하기 위해 유기농 및 지속 가능한 에너지 관리에도 점점 더 많은 관심이 쏠리고 있습니다.
3. 아시아 태평양
- 시장 점유율: 가장 빠르게 성장하는 지역으로, 중국, 일본, 인도가 특히 산업용 로봇 분야에서 아프리카 대륙 전체의 주요 시장 역할을 하고 있습니다.
-
주요 동인:
- 중국과 동남아시아에는 고급 전자제품과 첨단 소비재에 대한 수요가 매우 높은 거대한 소비자층이 존재합니다.
- 정부 지원 산업 이니셔티브 및 스마트 제조 역량 센터.
- 급속한 도시화와 가처분 소득 증가로 인해 서구화된 고급 기술 제품에 대한 선호도가 높아지고 있다.
- 동향: 반도체 및 뷰티테크 산업에서 사용되는 고급 스마트 제조 소프트웨어에 대한 전자상거래 플랫폼 및 B2B 계약 의존도가 높아지고 있습니다.
4. 남미 및 중앙아메리카
- 시장 점유율: 브라질, 칠레 등에서 수공업 및 산업 부문이 성장하고 있는 신흥 시장.
-
주요 동인:
- 근본적인 비용 절감과 공급망 탄력성 확보 측면에서 스마트 시스템의 운영 우수성에 대한 인식이 높아지고 있습니다.
- 소규모 공장을 현대화하여 도시 지역에 공급할 수 있는 상업용 유제품 생산 시설로 전환.
- 중상위 소득층 사이에서 지중해식 고효율 생산 식단에 대한 관심이 높아지고 있다.
- 트렌드: 농장에서 식탁까지 이어지는 자동화 시스템을 갖춘 부티크 브랜드의 성장과, 기존의 수작업 중심 시장과의 차별화를 위해 스마트 센서가 도입되고 있습니다.
5. 중동 및 아프리카
- 시장 점유율: 전통 산업에 깊은 문화적 뿌리를 두고 있으며, 공식화된 상업적 스마트 생산으로 전환 중인 개발 도상 시장.
-
주요 동인:
- 석유 및 가스 중공업 분야에서 전통적인 입지를 구축해 온 기업이 디지털 전환을 모색하고 있습니다.
- 건조하고 척박한 산업 환경에서 보관이 용이하고 원격 모니터링이 가능한 제품에 대한 수요가 높습니다.
- 에너지 안보를 강화하기 위한 첨단 산업 단지에 대한 전략적 투자.
- 동향: 비공식 산업 시장을 공식화하기 위해 최신 감지 및 냉장 기술을 데이터에 적용하는 것과 더불어 에너지 부문을 위한 고영양 디지털 분말에 대한 관심이 높아지고 있습니다.
높은 시장 밀도와 경쟁
지멘스, 록웰 오토메이션, ABB와 같은 기존 선두 기업들의 존재로 경쟁이 더욱 치열해지고 있습니다. 지역 전문가와 틈새시장 공략 업체, 그리고 혁신 기업들이 어우러져 다양하고 빠르게 확장되는 시장 환경을 조성하고 있습니다.
이러한 경쟁 환경으로 인해 공급업체는 다음과 같은 방식으로 차별화를 꾀하게 됩니다.
- 디지털 통합: 건강을 중시하는 소비자를 위해 높은 정밀도, 안전성 및 실시간 연결성을 강조함으로써 스마트 시스템을 수작업보다 우월한 대안으로 자리매김합니다.
- 다양한 제품 포트폴리오: 스마트 제조 제품은 이제 하드웨어만을 포함하는 것이 아닙니다. 기업들은 클라우드 서비스, 예측 유지보수 모듈, 그리고 고급 사이버 보안 계층을 제공합니다.
- 수직적 관리: 생산자는 센서 생산부터 클라우드 처리까지 전체 디지털 공급망을 관리합니다. 이러한 접근 방식은 품질과 투명성을 보장하고 윤리적 데이터 기준을 충족합니다.
기회와 전략적 움직임
- 고급 소매 채널 및 전자상거래 플랫폼과 파트너십을 맺으세요: 아시아 태평양 및 북미 시장에서 급증하는 기술 기반 및 장인 정신이 깃든 산업 제품에 대한 수요를 활용하십시오.
- 지속 가능한 농업 및 생산 방식을 도입하십시오: 재생 가능한 산업 인증을 활용하여 윤리적이고 지속 가능한 제조 대안을 찾는 환경 의식이 높은 밀레니얼 세대와 Z세대 소비자에게 어필하십시오.
스마트 제조 시장에서 활동하는 주요 기업은 다음과 같습니다.
- 요코가와 전기 주식회사
- 시스코 시스템즈 주식회사
- 허니웰 인터내셔널 주식회사
- 3D 시스템즈 주식회사
- 다이후쿠(주)
- 제너럴 일렉트릭
- IBM 주식회사
- 오라클 코퍼레이션
- 지멘스 AG
- 슈나이더 일렉트릭 SE
면책 조항: 위에 나열된 회사들은 특정 순서대로 순위가 매겨진 것이 아닙니다.
스마트 제조 시장 뉴스 및 최근 동향
- 2026년 4월, 3D Systems는 고객이 높은 처리량, 신뢰성, 반복성 및 공정 제어가 요구되는 생산 환경으로 적층 제조를 확장할 수 있도록 지원하는 새로운 하드웨어, 소프트웨어 및 애플리케이션을 발표했습니다. 이 회사는 차세대 듀얼 레이저 생산 시스템인 SLA® 825 Dual을 전 세계에 출시하여 경쟁 시스템 대비 20% 이상 더 큰 빌드 볼륨과 최대 30% 더 빠른 인쇄 속도를 제공함으로써 정밀 생산 애플리케이션의 처리량을 향상시켰습니다. 또한 3D Systems는 적층 제조를 위한 고급 통합 소프트웨어 플랫폼인 AddiTrak™을 출시하여 안전한 온프레미스 실시간 장비 모니터링, 공정 제어, 데이터 수집 및 맞춤형 분석 기능을 제공합니다.
- 2026년 4월, 요코가와 전기 주식회사는 자사의 오픈 프로세스 자동화(OPA) 시스템용 OpreX™ 오픈 자동화 SI 키트가 오픈 프로세스 자동화 표준(O-PAS™*1)의 OPC 통합 아키텍처(OPC UA) 프로파일 인증을 획득했다고 발표했습니다. 이는 공정 산업 분야에서 최초의 사례입니다. OPA는 오픈 그룹 오픈 프로세스 자동화 포럼(OPAF)의 이니셔티브로, 다양한 제조업체의 장치와 소프트웨어를 유연하게 조합할 수 있도록 개방적이고 안전하며 상호 운용 가능한 공정 제어 아키텍처의 도입을 촉진합니다.
스마트 제조 시장 보고서 범위 및 제공 내용
스마트 제조 시장 규모 및 전망(2021~2034) 보고서는 다음과 같은 영역을 포함하여 시장에 대한 자세한 분석을 제공합니다.
- 본 보고서는 스마트 제조 시장의 규모 및 전망을 글로벌, 지역 및 국가별로 분석하며, 주요 시장 부문을 모두 포함합니다.
- 스마트 제조 시장의 트렌드와 더불어 시장 동향, 제약 요인, 주요 기회 등을 살펴봅니다.
- 상세한 PEST 및 SWOT 분석
- 스마트 제조 시장 분석은 주요 시장 동향, 글로벌 및 지역별 시장 환경, 주요 업체, 규제 및 최근 시장 발전을 다룹니다.
- 스마트 제조 시장의 시장 집중도, 히트맵 분석, 주요 업체 및 최근 동향을 포함하는 산업 환경 및 경쟁 분석.
- 상세 기업 프로필

안키타는 기술, 미디어, 정보통신기술(ICT), 전자 및 반도체 분야에서 8년 이상의 경력을 보유한 역동적인 시장 조사 및 컨설팅 전문가입니다. Microsoft, Oracle, NEC Corporation, SAP, KPMG, Expeditors International 등 글로벌 고객을 대상으로 100건 이상의 컨설팅 및 조사 업무를 성공적으로 이끌고 수행했습니다. 그녀의 핵심 역량은 시장 평가, 데이터 분석, 예측, 전략 수립, 경쟁 정보 분석, 보고서 작성입니다.
안키타는 사전 판매 제안서 설계 및 고객 논의부터 실행 가능한 인사이트의 사후 판매까지 전체 프로젝트 주기를 능숙하게 처리합니다. 또한, 여러 부서의 팀을 관리하고, 복잡한 조사 모듈을 구성하며, 고객별 비즈니스 목표에 맞춰 솔루션을 조정하는 데 능숙합니다. 뛰어난 의사소통, 리더십, 그리고 프레젠테이션 능력을 바탕으로 빠르게 변화하는 시장 환경에서도 가치 중심의 성과를 꾸준히 달성해 왔습니다.
- 포괄적인 시장 규모 산정 및 전망 분석
- 상세 시장 세분화 분석
- 심층적인 시장 동향 및 요인 분석
- 지역 및 국가별 인사이트
- 경쟁 구도 및 기업 벤치마킹
- 전략적 비즈니스 인텔리전스
사용 후기
Insight Partners의 SCADA 시스템 시장 보고서는 포괄적이며, 현재 동향과 미래 전망에 대한 귀중한 통찰력을 제공합니다. 팀은 매우 전문적이고, 신속하게 대응하며, 처음부터 끝까지 지원해 주었습니다. 저희는 매우 만족하며 Insight Partners의 서비스를 적극 추천합니다.
란 케뎀 파트너, Reali Technologies LTDs아주 구체적인 소프트웨어 시장에 대한 보고서를 요청했는데, 팀에서 며칠 만에 보고서를 작성해 주셨습니다. 정보는 매우 관련성이 높고 잘 정리되어 있었습니다. 그 후 보고서에 몇 가지 수정과 추가 사항을 요청했습니다. 팀원들의 응답도 매우 빨랐고, 일주일도 채 되지 않아 최종 보고서를 받았습니다.
장-에르브 젠 의장, 퓨처 애널리티카The Insight Partners와 함께 중요한 시장 조사 및 예측 작업을 진행했습니다. Insight Partners는 기회와 위험에 대한 명확한 통찰력을 제공하여 계획을 세우는 데 큰 도움이 되었습니다. The Insight Partners의 조사는 사용하기 쉬웠고, 탄탄한 데이터를 기반으로 했습니다. 덕분에 현명하고 자신 있는 결정을 내릴 수 있었습니다. The Insight Partners를 강력 추천합니다.
피유시 나그팔 수석 부사장, 하이빔 글로벌Insight Partners는 탄탄한 분야 전문성을 바탕으로 통찰력 있고 체계적인 시장 조사를 제공했습니다. Insight Partners 팀은 처음부터 끝까지 전문적이고 신속하게 대응했습니다. 사용자 친화적인 웹사이트 덕분에 업계 보고서에 쉽게 접근할 수 있었습니다. 신뢰할 수 있고 고품질의 조사 서비스를 원하신다면 Insight Partners를 강력 추천합니다.
아다치 유키히코 대표이사, 딥블루 주식회사The Insight Partners에서 시장 보고서를 구매한 것은 이번이 처음입니다. 처음에는 확신이 없었지만, 웹사이트를 방문하고 나서 위험을 감수하고 시장 보고서를 구매하는 것이 더 편하다는 것을 알게 되었습니다. 보고서의 품질과 고객 서비스에 매우 만족합니다. 처음 보고서를 보고 몇 가지 질문과 의견이 있었지만, 분석가와 이메일로 몇 차례 대화를 나눈 후, 전략 기획 과정에 참고할 수 있는 보고서를 확보했다고 생각합니다. 시간을 내어 긍정적인 경험을 선사해 주셔서 정말 감사합니다. 다른 사람들에게도 귀사의 서비스를 적극 추천할 것이며, 추가적인 시장 데이터가 필요할 때면 가장 먼저 귀사에 연락하겠습니다.
존 스즈키 사장 겸 최고 경영자, 이사회 이사, BK 테크놀로지스나이지리아 감염성 질환 IVD 시장 관련 정보 요청에 응해 주신 귀사의 지원과 전문성에 감사드립니다. 귀사의 인내심과 지도, 그리고 할인 혜택을 기꺼이 제공해 주셔서 결국 계약을 성사시킬 수 있었습니다. 첫 만남을 통해 귀사가 저에게 심어주신 좋은 인상을 바탕으로 앞으로도 The Insight Partners와 함께할 수 있기를 기대합니다.
치지오케 박사 오니아 전무이사, 파인크레스트 헬스케어 유한회사구매 이유
- 정보에 기반한 의사 결정
- 시장 역학 이해
- 경쟁 분석
- 고객 인사이트
- 시장 예측
- 위험 완화
- 전략 기획
- 투자 타당성 분석
- 신흥 시장 파악
- 마케팅 전략 강화
- 운영 효율성 향상
- 규제 동향에 발맞춰 대응


