
시각화 및 3D 렌더링 소프트웨어 시장 성장, 규모, 점유율, 동향, 주요 업체 분석 및 2030년까지 예측
시각화 및 3D 렌더링 소프트웨어 시장 규모 및 예측(2020~2030년), 글로벌 및 지역별 점유율, 추세 및 성장 기회 분석 보고서 범위: 애플리케이션별(교육 시뮬레이션, 마케팅 및 광고, 비디오 게임, 제품 시각화, 건축 시각화), 배포별(온프레미스 및 클라우드), 최종 사용자별(미디어 및 엔터테인먼트, 건축 및 건설, 디자인 및 엔지니어링, 의료 등)
- 상태 : 게시됨
- 보고서 코드 : TIPTE100000188
- 범주 : 기술, 미디어 및 통신
- 페이지 수 : 191
- 사용 가능한 보고서 형식 :


- 최종 업데이트 일자 : June 12, 2024

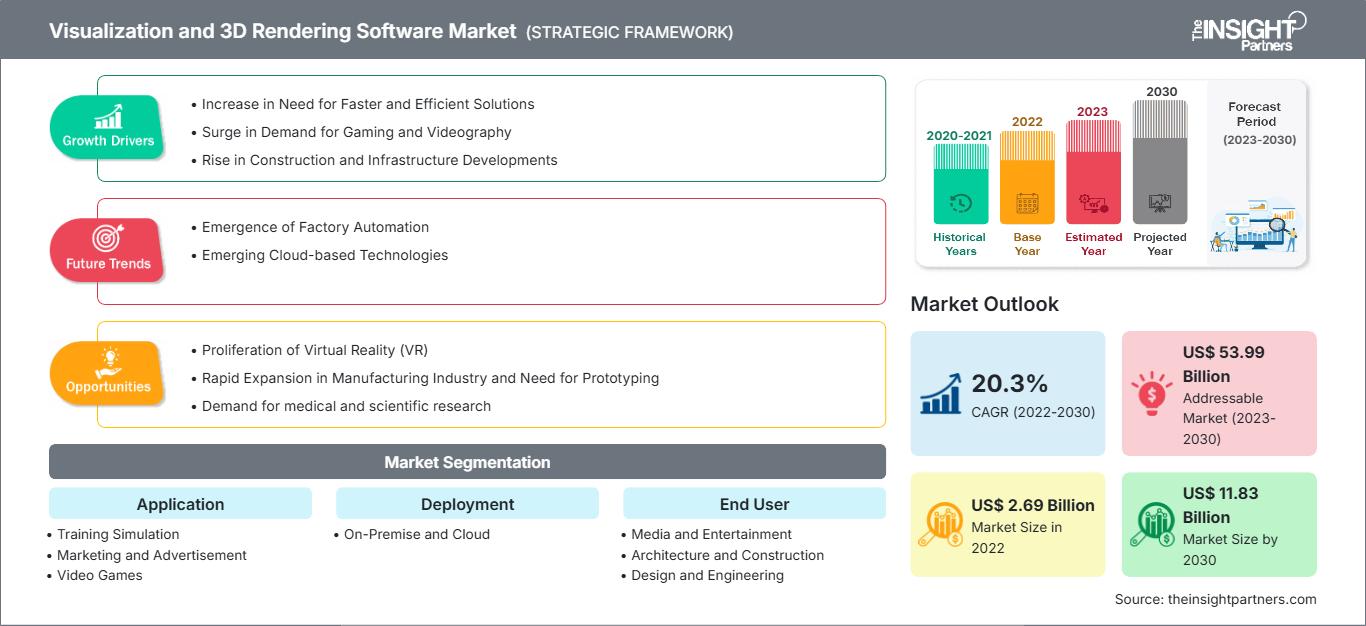
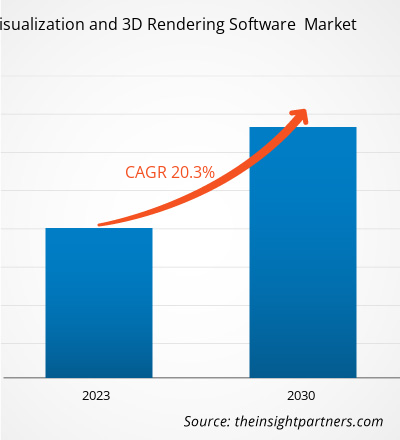
[연구 보고서] 시각화 및 3D 렌더링 소프트웨어 시장은 2022년 26억 9천만 달러에서 2030년 118억 3천만 달러로 성장할 것으로 예상됩니다. 시각화 및 3D 렌더링 소프트웨어 시장은 2022년부터 2030년까지 연평균 20.3% 성장할 것으로 예상됩니다.
시각화 및 3D 렌더링 소프트웨어 시장 분석가 관점:
시각화 및 3D 렌더링 소프트웨어 시장은 사실적인 시각적 표현이 필수적인 다양한 산업과 애플리케이션을 포괄합니다. 이 시장은 기술 발전, 몰입형 경험에 대한 수요 증가, 그리고 시각적 커뮤니케이션에 의존하는 산업의 확장으로 꾸준한 성장을 경험해 왔습니다. 건축가, 인테리어 디자이너, 도시 계획가는 3D 렌더링 소프트웨어를 사용하여 건물, 인테리어, 도시 공간을 사실적으로 시각화합니다. 이는 고객이 디자인 컨셉트를 이해하고 정보에 기반한 결정을 내리는 데 도움이 됩니다. 예를 들어, Autodesk의 3ds Max와 Trimble의 SketchUp과 같은 소프트웨어는 건축 시각화에 널리 사용됩니다. 영화, 애니메이션, 게임 산업은 놀라운 비주얼을 제작하기 위해 3D 렌더링 소프트웨어에 크게 의존합니다. Pixar의 영화 렌더링용 RenderMan과 Epic Games의 실시간 게임 그래픽용 Unreal Engine이 그 예입니다. 또한, 부동산 중개인은 3D 렌더링 소프트웨어를 사용하여 가상 부동산 투어를 제작하여 잠재 구매자가 원격으로 부동산을 둘러볼 수 있도록 합니다. Matterport는 3D 부동산 투어 제작에 인기 있는 플랫폼입니다.
3D 애니메이션 수요 증가, AR 및 VR 기술 발전, 3D 콘텐츠 수요 증가, 그리고 3D 디스플레이 장치의 성장은 전 세계 시각화 및 3D 렌더링 소프트웨어 시장을 견인하고 있습니다. 더 나아가, 3D 콘텐츠의 정확도를 높이기 위해 시각화 및 3D 렌더링 소프트웨어에 인공지능 및 머신러닝과 같은 기술의 도입 및 통합이 확대되면서 시장 성장이 더욱 가속화되고 있습니다. 이러한 모든 요인은 예측 기간 동안 시장 참여자들에게 풍부한 성장 기회를 제공할 것으로 예상됩니다.
시각화 및 3D 렌더링 소프트웨어 시장 개요:
시각화 및 3D 렌더링 소프트웨어 도구는 사용자가 기본적인 3차원 객체 모델을 설계하는 데 도움을 줍니다. 3D 렌더링 기술은 제품 설계, 실시간 마케팅, 교육 및 기타 여러 기능을 지원합니다. 전 세계 기업과 개인 사용자는 시각화 및 3D 렌더링 소프트웨어 도구를 사용하여 문제 영역과 개선이 필요한 부분을 파악함으로써 운영을 개선하고, 생산성을 높이며, 자원 사용을 최적화하고 있습니다. 이러한 도구는 엔지니어링 및 건설, 제조, 운송 및 물류와 같은 토지 중심 산업과 미디어 및 엔터테인먼트, 의료, 교육과 같은 기타 산업에서 널리 사용되고 있습니다.
요구 사항에 맞게 이 보고서를 사용자 정의하십시오.
이 보고서의 일부, 국가 수준 분석, Excel 데이터 팩을 포함하여 모든 보고서에 대한 사용자 정의를 무료로 받을 수 있을 뿐만 아니라 스타트업 및 대학을 위한 훌륭한 제안 및 할인을 이용할 수 있습니다
시각화 및 3D 렌더링 소프트웨어 시장: 전략적 통찰력
-
이 보고서의 주요 주요 시장 동향을 확인하세요.이 무료 샘플에는 시장 동향부터 추정 및 예측에 이르기까지 데이터 분석이 포함됩니다.
시각화 및 3D 렌더링 소프트웨어 시장 성장 동력:
더 빠르고 효율적인 솔루션에 대한 수요 증가로 시각화 및 3D 렌더링 소프트웨어 시장 성장 가속화
기존의 3D 모델 설계 방식은 시간과 비용이 많이 소요됩니다. 따라서 시각화와 시뮬레이션은 신제품 출시를 원하는 기업에게 핵심 요소가 되었습니다.
3D 렌더링 도구는 다양한 산업 분야에서 높은 도입률을 보이고 있습니다. 사용자는 3D 렌더링 도구를 통해 빠르고 사실적인 이미지를 제작하고, 프로토타입을 설계하고, 실제 제품을 제작하기 전에 공간에 대한 완벽한 시각화와 심층적인 이해를 얻을 수 있습니다. 또한 기업이 사용 가능한 공간과 자원을 최적화하는 데 도움이 됩니다. 더 나아가, 실제 제품 제작 전에 오류를 사전에 방지하고 더 나은 설계를 확보할 수 있도록 지원합니다. 3D 렌더링 소프트웨어는 고객 프레젠테이션 및 기타 활동을 위한 사용 가능한 공간을 더욱 효과적으로 시각화할 수 있으므로 기업 마케팅 도구로 효과적입니다.
3D 모델은 2D 또는 기타 모델보다 가상 사이트나 구조물을 빠르게 생성하고 많은 오류를 제거하여 시간을 절약할 수 있도록 도와줍니다. 엔지니어와 건축가는 프로젝트 설계에 소요되는 시간을 줄이고 다른 시각화 및 제품 설계 작업에 더 많은 시간을 할애할 수 있습니다. 또한, 전문가들은 사전에 문제를 파악하여 일정 변경이나 예산 증액으로부터 벗어날 수 있습니다.
현재 시중에는 다양한 산업 분야 및 도메인의 요구 사항에 맞춰 특별히 설계된 다양한 3D 시각화 소프트웨어가 출시되어 있습니다. 이러한 소프트웨어는 기업의 기존 워크플로우에 쉽게 통합될 수 있으며, 실시간 상호작용 및 최적화 기능을 갖춘 매우 사실적인 디스플레이를 제공합니다. 또한, 기업이 전체 제품 엔지니어링 프로세스의 설계를 개선하고 의사 결정 능력을 향상시키는 데 도움을 줍니다.
애니메이션 개발 및 빠른 시각화를 지원하는 이 소프트웨어는 애니메이션, 이미지 처리 및 그래픽 설계 전체 프로세스를 가속화하는 데 도움이 됩니다. 또한, 추가 모델이 필요하지 않습니다. 이러한 모든 요인이 시각화 및 3D 렌더링 소프트웨어 시장을 주도하고 있습니다.
보고서 세분화 및 범위:
시각화 및 3D 렌더링 소프트웨어 시장은 애플리케이션, 배포, 최종 사용자, 지역을 기준으로 세분화됩니다. 애플리케이션 기준으로 시각화 및 3D 렌더링 소프트웨어 시장은 교육 시뮬레이션, 마케팅 및 광고, 비디오 게임, 제품 시각화, 건축 시각화로 세분화됩니다. 배포 기준으로 시각화 및 3D 렌더링 소프트웨어 시장은 온프레미스와 클라우드로 세분화됩니다. 최종 사용자 기준으로 시각화 및 3D 렌더링 소프트웨어 시장은 미디어 및 엔터테인먼트, 건축 및 건설, 설계 및 엔지니어링, 의료 등으로 세분화됩니다. 지역 기준으로 시각화 및 3D 렌더링 소프트웨어 시장은 북미, 유럽, 아시아 태평양, 중동 및 기타로 세분화됩니다. 아프리카 및 남미.
세분화 분석:
구축 방식을 기준으로 시각화 및 3D 렌더링 소프트웨어 시장은 다음과 같이 구분됩니다.
- 온프레미스
- 클라우드
온프레미스 부문은 2022년 시각화 및 3D 렌더링 소프트웨어 시장 점유율이 더 높았으며, 2022년부터 2030년까지 더 높은 연평균 성장률(CAGR)을 기록할 것으로 예상됩니다. 온프레미스 구축 방식에서는 하드웨어와 소프트웨어가 회사 내에 설치 및 유지 관리됩니다. 온프레미스 솔루션은 기업이 모든 비즈니스 프로세스와 현재 내부 시스템(사용 중인 제조 방식 및 기술 등)을 그대로 유지하고, 데이터 보안 표준을 구현하며, 자체적인 제한 범위 내에서 전체 프로세스를 제어할 수 있도록 지원하여 상당한 이점을 제공합니다. 따라서 이러한 기업들은 시각화 및 3D 렌더링을 자체적인 관리 하에 구현하고 유지 관리하는 것을 선호합니다. 또한, 온프레미스 구축 방식은 이러한 시스템 유지 관리에 막대한 자본을 투자할 수 있는 대기업과 유력 기업들이 주로 채택하고 있습니다.
지역 분석:
시각화 및 3D 렌더링 소프트웨어 시장은 북미, 유럽, 아시아 태평양(APAC), 중동 및 아프리카(MEA), 남미의 5개 주요 지역으로 크게 구분됩니다. 북미는 2022년 시각화 및 3D 렌더링 소프트웨어 시장 점유율 1위를 차지했습니다. 이 지역의 시장 성장은 우호적인 정부 정책과 신기술 도입에 대한 긍정적인 전망에 기인합니다. 또한, 견고한 디지털 인프라와 주요 시장 참여 기업들의 존재는 북미에서 시각화 및 3D 렌더링 소프트웨어 시장이 성장할 수 있는 토대를 마련했습니다. 더욱이, 이 지역은 최신 디자인 및 애니메이션 도구를 활용하여 향상된 그래픽 콘텐츠를 제작하는 세계 최대 규모의 미디어 및 엔터테인먼트 산업의 본거지입니다. 대규모 디자인 및 R&D 센터를 포함하여 전 세계 포춘 500대 기업의 대부분이 이 지역에 위치하고 있습니다. 제조업체들은 시장에서 경쟁력 있는 제품을 제공하기 위해 시각화 및 3D 렌더링 도구와 같은 설계 도구에 막대한 투자를 하고 있습니다. 또한, 방대한 제조 부문의 존재는 북미 물류 산업을 보완하는 역할을 합니다. 물류 업계는 자원 최적화에 중점을 두고 시각화 및 3D 렌더링 도구를 포함한 첨단 기술에 적극적으로 투자하여 창고 시설 활용도를 극대화하고 있습니다.
주요 업체 분석:
보고서에 소개된 주요 시각화 및 3D 렌더링 소프트웨어 시장 업체는 Autodesk Inc, Christie Digital Systems Inc, Dassault Systemes SE, NVIDIA Corp, Chaos Group, Luxion Inc, OTOY Inc, Next Limit, Act-3D, 그리고 Altair의 Thea Render입니다.
시각화 및 3D 렌더링 소프트웨어 시장 지역별 통찰력
The Insight Partners의 분석가들은 예측 기간 동안 시각화 및 3D 렌더링 소프트웨어 시장에 영향을 미치는 지역별 동향과 요인을 면밀히 분석했습니다. 이 섹션에서는 북미, 유럽, 아시아 태평양, 중동 및 아프리카, 중남미 지역의 시각화 및 3D 렌더링 소프트웨어 시장 부문과 지역별 시장 규모에 대해서도 다룹니다.
시각화 및 3D 렌더링 소프트웨어 시장 보고서 범위
| 보고서 속성 | 세부 |
|---|---|
| 시장 규모 2022 | US$ 2.69 Billion |
| 시장규모별 2030 | US$ 11.83 Billion |
| 글로벌 CAGR (2022 - 2030) | 20.3% |
| 이전 데이터 | 2020-2021 |
| 예측 기간 | 2023-2030 |
| 다루는 세그먼트 |
By 응용 프로그램
|
| 포함된 지역 및 국가 |
북미
|
| 시장 선도 기업 및 주요 회사 프로필 |
|
시각화 및 3D 렌더링 소프트웨어 시장 참여자 밀도: 비즈니스 역학에 미치는 영향 이해
시각화 및 3D 렌더링 소프트웨어 시장은 소비자 선호도 변화, 기술 발전, 그리고 제품의 이점에 대한 인식 제고 등의 요인으로 인한 최종 사용자 수요 증가에 힘입어 빠르게 성장하고 있습니다. 수요가 증가함에 따라 기업들은 제품 및 서비스를 확장하고, 소비자 니즈를 충족하기 위한 혁신을 추진하며, 새로운 트렌드를 적극 활용하고 있으며, 이는 시장 성장을 더욱 가속화하고 있습니다.
- 을 얻으세요 시각화 및 3D 렌더링 소프트웨어 시장 주요 주요 플레이어 개요
최근 동향:
시각화 및 3D 렌더링 소프트웨어 시장 참여자들은 무기적 및 유기적 전략을 적극적으로 채택하고 있습니다. 최근 주요 시장 동향은 다음과 같습니다.
- 2022년, Autodesk는 뉴질랜드에 본사를 둔 Moxion 인수를 발표했습니다. Moxion은 유명 영화 제작자가 사용하는 강력한 클라우드 기반 디지털 데일리 플랫폼 개발사입니다.
- 2022년, Jaguar Land Rover와 NVIDIA는 고객 경험에 지능을 접목하여 현대적인 럭셔리를 재정의하고 있습니다. 또한 DRIVE IX 소프트웨어 스택을 활용하여 운전자 및 탑승자 모니터링, 고급 시각화 등 차량 내 AI 기능을 제공할 예정입니다.
- 2022년, Chaos와 Enscape가 합병하여 TA Associates와 LEA 파트너의 지원을 받을 예정입니다. 기술 중심 사모펀드인 Enscape는 건축, 엔지니어링 및 건설 분야를 위한 실시간 렌더링 및 설계 워크플로 기술 분야의 선도적인 개발사입니다.

안키타는 기술, 미디어, 정보통신기술(ICT), 전자 및 반도체 분야에서 8년 이상의 경력을 보유한 역동적인 시장 조사 및 컨설팅 전문가입니다. Microsoft, Oracle, NEC Corporation, SAP, KPMG, Expeditors International 등 글로벌 고객을 대상으로 100건 이상의 컨설팅 및 조사 업무를 성공적으로 이끌고 수행했습니다. 그녀의 핵심 역량은 시장 평가, 데이터 분석, 예측, 전략 수립, 경쟁 정보 분석, 보고서 작성입니다.
안키타는 사전 판매 제안서 설계 및 고객 논의부터 실행 가능한 인사이트의 사후 판매까지 전체 프로젝트 주기를 능숙하게 처리합니다. 또한, 여러 부서의 팀을 관리하고, 복잡한 조사 모듈을 구성하며, 고객별 비즈니스 목표에 맞춰 솔루션을 조정하는 데 능숙합니다. 뛰어난 의사소통, 리더십, 그리고 프레젠테이션 능력을 바탕으로 빠르게 변화하는 시장 환경에서도 가치 중심의 성과를 꾸준히 달성해 왔습니다.
- 포괄적인 시장 규모 산정 및 전망 분석
- 상세 시장 세분화 분석
- 심층적인 시장 동향 및 요인 분석
- 지역 및 국가별 인사이트
- 경쟁 구도 및 기업 벤치마킹
- 전략적 비즈니스 인텔리전스
사용 후기
Insight Partners의 SCADA 시스템 시장 보고서는 포괄적이며, 현재 동향과 미래 전망에 대한 귀중한 통찰력을 제공합니다. 팀은 매우 전문적이고, 신속하게 대응하며, 처음부터 끝까지 지원해 주었습니다. 저희는 매우 만족하며 Insight Partners의 서비스를 적극 추천합니다.
란 케뎀 파트너, Reali Technologies LTDs아주 구체적인 소프트웨어 시장에 대한 보고서를 요청했는데, 팀에서 며칠 만에 보고서를 작성해 주셨습니다. 정보는 매우 관련성이 높고 잘 정리되어 있었습니다. 그 후 보고서에 몇 가지 수정과 추가 사항을 요청했습니다. 팀원들의 응답도 매우 빨랐고, 일주일도 채 되지 않아 최종 보고서를 받았습니다.
장-에르브 젠 의장, 퓨처 애널리티카The Insight Partners와 함께 중요한 시장 조사 및 예측 작업을 진행했습니다. Insight Partners는 기회와 위험에 대한 명확한 통찰력을 제공하여 계획을 세우는 데 큰 도움이 되었습니다. The Insight Partners의 조사는 사용하기 쉬웠고, 탄탄한 데이터를 기반으로 했습니다. 덕분에 현명하고 자신 있는 결정을 내릴 수 있었습니다. The Insight Partners를 강력 추천합니다.
피유시 나그팔 수석 부사장, 하이빔 글로벌Insight Partners는 탄탄한 분야 전문성을 바탕으로 통찰력 있고 체계적인 시장 조사를 제공했습니다. Insight Partners 팀은 처음부터 끝까지 전문적이고 신속하게 대응했습니다. 사용자 친화적인 웹사이트 덕분에 업계 보고서에 쉽게 접근할 수 있었습니다. 신뢰할 수 있고 고품질의 조사 서비스를 원하신다면 Insight Partners를 강력 추천합니다.
아다치 유키히코 대표이사, 딥블루 주식회사The Insight Partners에서 시장 보고서를 구매한 것은 이번이 처음입니다. 처음에는 확신이 없었지만, 웹사이트를 방문하고 나서 위험을 감수하고 시장 보고서를 구매하는 것이 더 편하다는 것을 알게 되었습니다. 보고서의 품질과 고객 서비스에 매우 만족합니다. 처음 보고서를 보고 몇 가지 질문과 의견이 있었지만, 분석가와 이메일로 몇 차례 대화를 나눈 후, 전략 기획 과정에 참고할 수 있는 보고서를 확보했다고 생각합니다. 시간을 내어 긍정적인 경험을 선사해 주셔서 정말 감사합니다. 다른 사람들에게도 귀사의 서비스를 적극 추천할 것이며, 추가적인 시장 데이터가 필요할 때면 가장 먼저 귀사에 연락하겠습니다.
존 스즈키 사장 겸 최고 경영자, 이사회 이사, BK 테크놀로지스나이지리아 감염성 질환 IVD 시장 관련 정보 요청에 응해 주신 귀사의 지원과 전문성에 감사드립니다. 귀사의 인내심과 지도, 그리고 할인 혜택을 기꺼이 제공해 주셔서 결국 계약을 성사시킬 수 있었습니다. 첫 만남을 통해 귀사가 저에게 심어주신 좋은 인상을 바탕으로 앞으로도 The Insight Partners와 함께할 수 있기를 기대합니다.
치지오케 박사 오니아 전무이사, 파인크레스트 헬스케어 유한회사구매 이유
- 정보에 기반한 의사 결정
- 시장 역학 이해
- 경쟁 분석
- 고객 인사이트
- 시장 예측
- 위험 완화
- 전략 기획
- 투자 타당성 분석
- 신흥 시장 파악
- 마케팅 전략 강화
- 운영 효율성 향상
- 규제 동향에 발맞춰 대응


