
Decoy Flares Market Segments and Growth by 2031
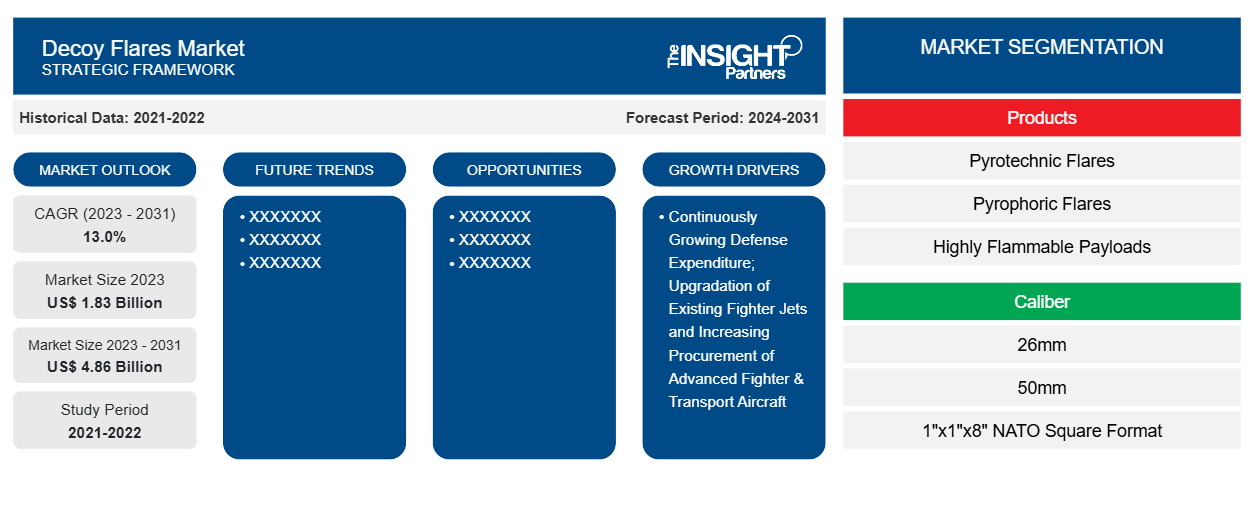
Decoy Flares Market Size and Forecast (2021–2031), Global and Regional Share, Trend, and Growth Opportunity Analysis Report Coverage: By Products (Pyrotechnic Flares, Pyrophoric Flares, Highly Flammable Payloads); Caliber (26mm, 50mm, 1”x1”x8” NATO Square Format, 2”x1”x8” NATO Square Format); Application (Fixed Wing, Rotary Wing); and Geography
Historic Data: 2021-2022 | Base Year: 2023 | Forecast Period: 2024-2031- Status : Data Released
- Report Code : TIPRE00012715
- Category : Aerospace and Defense
- No. of Pages : 150
- Available Report Formats :


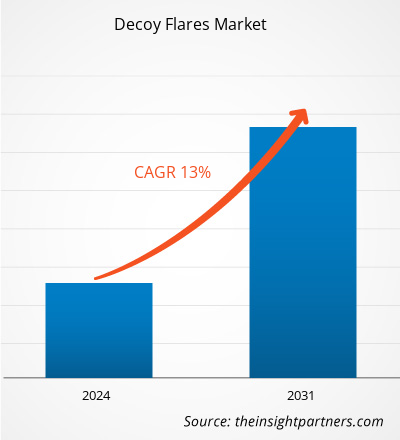
The Decoy Flares Market size is projected to reach US$ 4.86 billion by 2031 from US$ 1.83 billion in 2023. The market is expected to register a CAGR of 13.0% in 2023–2031. The introduction of smart decoy flares and missile jamming decoys is one of the major trends likely to drive the market for decoy flares in the coming years. Several countries have been integrating the same into their respective armed forces for advancing their weaponries.
Decoy Flares Market Analysis
The 1x1x8 inches NATO square format decoy flares are among the most widely accepted decoy flare calibers. This is due to the versatility of the caliber to integrate itself onto various aircraft models. The North American and European (except Russia) aircraft manufacturers highly prefer integrating 1x1x8 inches NATO square format decoy flares. Some of the aircraft models that are capable of carrying 1x1x8 inches NATO square format decoy flares include; Apache AH-64, F-16, A-10, Ch-47 Chinook, C-130, and A400M. The production volumes of the above-mentioned aircraft models continue to surge each year, which reflects the rise in demand for 1x1x8 inches NATO square format decoy flares, which drives the decoy flares market.
Decoy Flares Market Overview
The key stakeholders in the decoy flare market are raw material suppliers, decoy flare manufactures, and end users. The manufacturers of decoy flares constantly procure raw material from the suppliers in order to produce increased volumes of decoy flare with an objective to meet the demands from the customers. The raw materials used in production of decoy flare include chemical energy substance (pyrotechnic components), and shells. The availability of large number of raw material suppliers enable the decoy flares market players to choose the appropriate supplier. This enhances the supply chain of the decoy flare market. Upon procuring raw materials, the decoy flare market players produce significant volumes of decoy flare with varied calibers, thereby, meeting respective customer demands. The end users in the decoy flares market include aircraft/helicopters manufacturers and the defense forces. These end users require significant volumes of decoy flare in order to integrate the same on the newer aircraft models as well as existing fleets.
Market Research Highlights
- Global market for Decoy Flares was valued at US$ 1.83 Billion in 2023
- Annual market size is expected to reach US$ 4.86 Billion by 2031
- Total addressable market (TAM) during 2024-2031 is projected to reach approximately US$ 26.38 Billion
- Market is anticipated to register a CAGR of 13% during the forecast period
- The United States represents a key market, supported by Continuously Growing Defense Expenditure; Upgradation of Existing Fighter Jets and Increasing Procurement of Advanced Fighter & Transport Aircraft, as well as evolving industry dynamics
- Market analysis covers North America, Europe, Asia-Pacific, South and Central America, Middle East and Africa, with growth evaluated across the forecast period
- Market opportunities such as are expected to influence market dynamics and addressable market
- Report profiles industry participants, including Armtec Defense Technologies, Chemring Group PLC, TARA Aerospace AD, TransDigm Group Incorporated, Elbit Systems Ltd., LACROIX, Mechanical and Chemical Industry Corporation, Mil-Spec Industries Corporation, Owen International, Premier Explosives Limited, Rheinmetall AG, Rosoboronexport, Ordtech, MBDA, while analyzing competitive strategies and innovation developments
Customize This Report To Suit Your Requirement
Get FREE CUSTOMIZATIONDecoy Flares Market: Strategic Insights
-
Get Top Key Market Trends of this report.This FREE sample will include data analysis, ranging from market trends to estimates and forecasts.
Decoy Flares Market Drivers and Opportunities
Rising Procurement of Combat Aircraft & Helicopters
The rising procurement of military combat aircraft and combat helicopters across the world is one of the major factors driving the installation of decoy flares across different regions. For instance, in April 2023, the US DoD awarded a contract worth US$ 7.8 billion to Lockheed Martin Corporation for the modification of 126 units of F-35 multi-role aircraft. Similarly, in December 2023, the German Bundeswehr and Airbus Helicopters signed a contract for the purchase of up to 82 multi-role H145M helicopters (62 firm orders plus 20 options). Additionally, in June 2022, Spain ordered 20 Eurofighter jets from Airbus under landmark contract to modernise its combat aircraft fleet. Such contracts have been pushing the deployment of decoy flares into the military aircraft and helicopter platforms.
Deployment of Combat UAVs to Drive the Market Growth in The Coming Years
The rising procurement of military drones for ISR & combat operations is another major factor likely to generate new opportunities for decoy flare market vendors in the coming years. Several countries have started deploying combat drones into their respective military fleets to advance their warfare capabilities which is driving the market for different types of weapons and countermeasure systems as well. Further, as per several defense sector sources, Russia recently (in 2024) have deployed decoy flares-based missile into Ukraine’s territory to surpass the Ukrainian radars. Such emerging applications are likely to generate new opportunities for market vendors during the forecast period.
Decoy Flares Market Report Segmentation Analysis
Key segments that contributed to the derivation of the Decoy Flares Market analysis are products, caliber, application, and geography.
- Based on products, the Decoy Flares Market has been segmented into pyrotechnic flares, pyrophoric flares, highly flammable payloads. The highly flammable payloads segment held a larger market share in 2023.
- By caliber, the Decoy Flares Market has been segmented into 26mm, 50mm, 1”x1”x8” NATO square format, 2”x1”x8” NATO square format. The 1”x1”x8” NATO square format segment held the largest share of the market in 2023.
- Based on application, the Decoy Flares Market has been bifurcated into fixed wing and rotary wing. The fixed wing segment held a larger market share in 2023.
Decoy Flares Market Share Analysis by Geography
The geographic scope of the Decoy Flares Market report is mainly divided into five regions: North America, Europe, Asia Pacific, Middle East & Africa, and South America.
North America has dominated the Decoy Flares Market in 2023, whereas, Asia Pacific region is likely to witness a significant growth during the forecast period. Geographically, North America is the major investor in the decoy flares market, due to presence of large number of military aircraft OEMs in the region. The players include companies such as Lockheed Martin Corporation, Boeing, General Dynamics, and Airbus. Further, the demand for decoy flares in North America is also driven by the presence of the US which is the largest military spending country across the world and has largest fleet of military aircraft and helicopters compared to any other country globally. Such factors have been driving the growth of decoy flares market in the North America region.
Decoy Flares Market Report Scope
| Report Attribute | Details |
|---|---|
| Market size in 2023 | US$ 1.83 Billion |
| Market Size by 2031 | US$ 4.86 Billion |
| Global CAGR (2023 - 2031) | 13.0% |
| Historical Data | 2021-2022 |
| Forecast period | 2024-2031 |
| Segments Covered |
By Products
|
| Regions and Countries Covered |
North America
|
| Market leaders and key company profiles |
|
Decoy Flares Market Players Density: Understanding Its Impact on Business Dynamics
The Decoy Flares Market is growing rapidly, driven by increasing end-user demand due to factors such as evolving consumer preferences, technological advancements, and greater awareness of the product's benefits. As demand rises, businesses are expanding their offerings, innovating to meet consumer needs, and capitalizing on emerging trends, which further fuels market growth.
Decoy Flares Market News and Recent Developments
The Decoy Flares Market is evaluated by gathering qualitative and quantitative data post primary and secondary research, which includes important corporate publications, association data, and databases. The following is a list of developments in the market for decoy flares market and strategies:
- In January 2024, Rheinmetall secured a contract (2024-2029) worth US$ 54.4 million to supply aircraft decoy flares for the German armed forces under which Rheinmetall will be supplying 470,000 decoy flares to the Berlin forces. (Source: Rheinmetall, Press Release/Company Website/Newsletter)
- In October 2021, Chemring Australia received an US$ 18.69 million contract modification (including US$ 2.67 million in FMS funds) from Naval Air Systems Command to produce and deliver 9,728 MJU-68/B IR flare countermeasures: 7,256 for the US Navy and 1,152 for the US Air Force; 528 for Norway; 336 for Japan; 312 for the Netherlands; and 144 for Italy. (Source: Chemring Group, Press Release/Company Website/Newsletter)
Decoy Flares Market Report Coverage and Deliverables
The “Decoy Flares Market Size and Forecast (2021–2031)” report provides a detailed analysis of the market covering below areas:
- Market size and forecast at global, regional, and country levels for all the key market segments covered under the scope
- Market dynamics such as drivers, restraints, and key opportunities
- Key future trends
- Detailed Porter’s Five Forces analysis
- Global and regional market analysis covering key market trends, major players, regulations, and recent market developments
- Industry landscape and competition analysis covering market concentration, heat map analysis, prominent players, and recent developments
- Detailed company profiles with SWOT analysis

- Historical Analysis (2 Years), Base Year, Forecast (7 Years) with CAGR
- PEST and SWOT Analysis
- Market Size Value / Volume - Global, Regional, Country
- Industry and Competitive Landscape
- Excel Dataset
Recent Reports
Testimonials
The Insight Partners' SCADA System Market report is comprehensive, with valuable insights on current trends and future forecasts. The team was highly professional, responsive, and supportive throughout. We are very satisfied and highly recommend their services.
RAN KEDEM Partner, Reali Technologies LTDsI requested a report on a very specific software market and the team produced the report in a few days. The information was very relevant and well presented. I then requested some changes and additions to the report. The team was again very responsive and I got the final report in less than a week.
JEAN-HERVE JENN Chairman, Future AnalyticaWe worked with The Insight Partners for an important market study and forecast. They gave us clear insights into opportunities and risks, which helped shape our plans. Their research was easy to use and based on solid data. It helped us make smart, confident decisions. We highly recommend them.
PIYUSH NAGPAL Sr. Vice President, High Beam GlobalThe Insight Partners delivered insightful, well-structured market research with strong domain expertise. Their team was professional and responsive throughout. The user-friendly website made accessing industry reports seamless. We highly recommend them for reliable, high-quality research services
YUKIHIKO ADACHI CEO, Deep Blue, LLC.This is the first time I have purchased a market report from The Insight Partners.While I was unsure at first, I visited their web site and felt more comfortable to take the risk and purchase a market report.I am completely satisfied with the quality of the report and customer service. I had several questions and comments with the initial report, but after a couple of dialogs over email with their analyst I believe I have a report that I can use as input to our strategic planning process.Thank you so much for taking the extra time and making this a positive experience.I will definitely recommend your service to others and you will be my first call when we need further market data.
JOHN SUZUKI President and Chief Executive Officer, Board Director, BK TechnologiesI wish to appreciate your support and the professionalism you displayed in the course of attending to my request for information regarding to infectious disease IVD market in Nigeria. I appreciate your patience, your guidance, and the fact that you were willing to offer a discount, which eventually made it possible for us to close a deal. I look forward to engaging The Insight Partners in the future, all thanks to the impression you have created in me as a result of this first encounter.
DR CHIJIOKE ONYIA MANAGING DIRECTOR, PineCrest Healthcare Ltd.Reason to Buy
- Informed Decision-Making
- Understanding Market Dynamics
- Competitive Analysis
- Identifying Emerging Markets
- Customer Insights
- Market Forecasts
- Risk Mitigation
- Boosting Operational Efficiency
- Strategic Planning
- Investment Justification
- Tracking Industry Innovations
- Aligning with Regulatory Trends
Unlock Exclusive Report Discounts
Enquire Now


 Get Free Sample For