North America Gas Engine Market Analysis and Forecast by Size, Share, Growth, Trends 2031
North America Gas Engine Market Size and Forecast (2021 - 2031), Regional Share, Trend, and Growth Opportunity Analysis Report Coverage: By Fuel Type (Natural Gas and Special Gas), Power Output (100-300 kW, 300-500 kW, 0.5-1 MW, 1-2 MW, 2-5 MW, 5-10 MW, and 10-15MW), and End-User [Remote (Mining, Drilling, Others), Mid-Stream Oil and Gas, Heavy Industries (Chemicals, Paper, Metals, Food and Beverages, Others), Light Manufacturing, Utilities (Grid, IPP, Others), Biogas, Datacenters, MUSH, and Commercial]
- Status : Published
- Report Code : TIPRE00027719
- Category : Energy and Power
- No. of Pages : 250
- Available Report Formats :


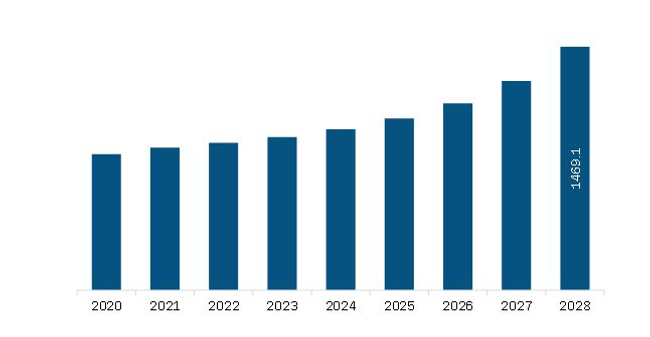
The North America gas engine market size is expected to reach US$ 1,785.15 million by 2031 from US$ 1,134.92 million in 2024. The market is estimated to record a CAGR of 6.8% from 2025-2031.
Executive Summary and North America Gas Engine Market Analysis:Technological advancements have led to a highly competitive market in the region as the population with high spending power gets attracted to technological developments. With the increasing production of natural gas, the power generation industry is constantly blooming in the region. Gas engines, Gensets, and gas turbines have found a broad user base in North America. Gas engine enables a customer to meet new emission regulation standards through cleaner burn of gases, low emissions, and improved electrical efficiency. Besides, the rising adoption of special gases creates ample opportunities for the market players to develop advanced gas engines with strong power output and efficiency. Natural gas is one of the major contributors to the US electricity production. Almost one-third of electricity in the US is produced using natural gas. The country is further enhancing its power generation capacities with natural gas and renewable energy sources. For instance, the US Energy Information Administration (EIA) stated that natural gas consumption in the US would increase to 35.7 trillion cubic feet (Tcf), and production would increase to 43.0 Tcf by 2050. Also, natural gas consumption in the industrial sector would increase by 3.6 Tcf, or 35%, from 2020 to 2050. According to the EIA, industrial use and export of natural gas are among the key factors driving the market.
Customize Research To Suit Your Requirement
We can optimize and tailor the analysis and scope which is unmet through our standard offerings. This flexibility will help you gain the exact information needed for your business planning and decision making.
North America Gas Engine Market: Strategic Insights

Naveen
Have a question?
Naveen will walk you through a 15-minute call to present the report’s content and answer all queries if you have any.
 Speak to Analyst
Key segments that contributed to the derivation of the gas engine market analysis are fuel type, power output, and end user.
- By fuel type, the gas engine market is bifurcated into natural gas and special gas. The natural gas segment held a larger share of the market in 2024.
- By power output, the gas engine market is segmented into 100-300 KW, 300-500 KW, 0.5-1 MW, 1-2 MW, 2-5 MW, 5-10MW, and 10-15MW. The 5-10MW held the largest share of the market in 2024.
- By end user, the gas engine market is segmented into remote, mid-stream oil and gas, heavy industries, light manufacturing, utilities, biogas, datacenters, mush, and commercial. The heavy industries held the largest share of the market in 2024.
Several governments are imposing regulations to control the emissions of diesel and petrol engines, compelling engine manufacturers to opt for alternative fuel solutions such as natural gas. Gas engines release less emissions to generate a sufficient amount of power. The emission monitoring and regulatory bodies are imposing stringent regulations on using diesel engines and generators. Various industries are deploying gas engines and generators for power generation to meet these regulatory standards.
Cummins Inc. and Liberty Energy Inc. announced the launch of the industry's first natural gas variable-speed, large displacement engine to power Liberty's digiPrime hydraulic fracturing platform, set for deployment in the first half of 2025. This follows the strategic partnership formed between the two companies in June 2024, aimed at jointly developing innovative technology for the completions services market. The Cummins HSK78G natural gas engine, initially introduced in March 2019 as part of a fixed-speed generator set for the power generation sector, has demonstrated exceptional reliability in providing consistent power across varying natural gas sources and operational environments. The recent advancements for Liberty's digiPrime platform are built for the HSK78G engine to enhance its response time and load acceptance. This collaboration highlights a significant step in the ongoing growth of the gas engine market, which continues to innovate in areas of efficiency and operational performance, particularly within sectors such as hydraulic fracturing and energy production. Thus, the rise in such development of efficient fuel engines owing to stringent regulations related to gas engines is propelling the market growth.
North America Gas Engine Market Country InsightsBased on country, the North America gas engine market comprises the US, Canada, and Mexico. The US held the largest share in 2024.
The US is the world's largest economy with well-developed engine technology for varied industrial applications. Companies operating in the US adhere to the adoption of the latest technologies to improve the level of fuel consumption, fuel efficiency, and performance. Companies are developing advanced gas engines to meet emission standards with the rising production of natural gas. Further, the rising importance of natural gases in gas engines to effectively reduce carbon emissions is strengthening market penetration in the US. For instance, according to the American Gas Association, in 2023, the US experienced a notable decline in greenhouse gas emissions, primarily due to the expanded use of natural gas. This shift is contributing to immediate reductions in emissions, and the natural gas delivery infrastructure is expected to enhance these efforts through the adoption of innovative low-carbon fuels and improved efficiency in the coming years. This trend aligns with the growing demand for natural gas, which is expected to drive continued expansion in the US gas engine market as businesses and industries seek more sustainable energy solutions.
North America Gas Engine Market Company ProfilesSome of the key players operating in the market include Rolls-Royce Holdings Plc, Ningbo C.S.I. Power & Machinery Group Co., Ltd, Guascor Energy S.A.U, IHI Corp, MAN Energy Solutions SE, 2G ENERGY AG, Wartsila Corp, R Schmitt Enertec GmbH, Mitsubishi Heavy Industries Ltd, Liebherr, Kawasaki Heavy Industries Ltd, Fairbanks Morse, LLC, Cummins Inc, Caterpillar Inc, and INNIO Jenbacher GmbH & Co, among others. These players are adopting various strategies such as expansion, product innovation, and mergers and acquisitions to provide innovative products to their consumers and increase their market share.
North America Gas Engine Market Research Methodology :The following methodology has been followed for the collection and analysis of data presented in this report:
Secondary Research
The research process begins with comprehensive secondary research, utilizing both internal and external sources to gather qualitative and quantitative data for each market. Commonly referenced secondary research sources include, but are not limited to:
- Company websites, annual reports, financial statements, broker analyses, and investor presentations.
- Industry trade journals and other relevant publications.
- Government documents, statistical databases, and market reports.
- News articles, press releases, and webcasts specific to companies operating in the market.
All financial data included in the Company Profiles section has been standardized to USD. For companies reporting in other currencies, figures have been converted to USD using the relevant exchange rates for the corresponding year.
Primary Research
The Insight Partners conducts a significant number of primary interviews each year with industry stakeholders and experts to validate its data analysis, and gain valuable insights. These research interviews are designed to:
- Validate and refine findings from secondary research.
- Enhance the expertise and market understanding of the analysis team.
- Gain insights into market size, trends, growth patterns, competitive dynamics, and future prospects.
Primary research is conducted via email interactions and telephone interviews, encompassing various markets, categories, segments, and sub-segments across different regions. Participants typically include:
- Industry stakeholders: Vice Presidents, business development managers, market intelligence managers, and national sales managers
- External experts: Valuation specialists, research analysts, and key opinion leaders with industry-specific expertise

Report Coverage
Revenue forecast, Company Analysis, Industry landscape, Growth factors, and Trends

Segment Covered
This text is related
to segments covered.

Regional Scope
North America, Europe, Asia Pacific, Middle East & Africa, South & Central America

Country Scope
This text is related
to country scope.
1. Introduction
1.1 Report Guidance
1.2 Market Segmentation
2. Executive Summary
2.1 Key Insights
2.2 Market Attractiveness
3. Research Methodology
3.1 Secondary Research
3.2 Primary Research
3.2.1 Hypothesis formulation:
3.2.2 Macroeconomic factor analysis:
3.2.3 Developing base number:
3.2.4 Data Triangulation:
3.2.5 Country-level data:
4. Gas Engine Market Landscape
4.1 Overview
4.2 PEST Analysis
4.3 Ecosystem Analysis
4.3.1 List of Vendors in the Value Chain
4.4 Weighted Average Selling Price, 2024
4.5 Import-Export Analysis – Gas Engine Market
4.6 ESG Analysis
4.6.1 Environmental Factors
4.6.2 Social Factors
4.6.3 Governance Factors
5. North America Gas Engine Market – Key Market Dynamics
5.1 Market Drivers
5.1.1 Increasing Focus on the Development of Efficient Fuel Engines
5.1.2 Rising Production of Natural Gas
5.2 Market Restraints
5.2.1 Escalating Popularity of Renewable Energy Alternatives and Technological Drawbacks in Several Countries
5.3 Market Opportunities
5.3.1 Government Incentives for Clean Energy Transition
5.4 Future Trends
5.4.1 Technological Advancement in Gas Engine
5.5 Impact of Drivers and Restraints:
6. Gas Engine Market - North America Market Analysis
6.1 North America Gas Engine Market Volume (New Installation MW), 2021–2031
6.2 North America Gas Engine Market Volume Forecast and Analysis (New Installation MW)
6.3 North America Gas Engine Market Revenue (US$ Million), 2025–2031
6.4 North America Gas Engine Market Forecast and Analysis
7. North America Gas Engine Market Volume and Revenue Analysis – by Fuel Type
7.1 Natural Gas
7.1.1 Overview
7.1.2 Natural Gas: North America Gas Engine Market – Volume and Forecast, 2021–2031 (New Installation MW)
7.1.3 Natural Gas: North America Gas Engine Market – Revenue and Forecast, 2021–2031 (US$ Million)
7.2 Special Gas
7.2.1 Overview
7.2.2 Special Gas: North America Gas Engine Market – Volume and Forecast, 2021–2031 (New Installation MW)
7.2.3 Special Gas: North America Gas Engine Market – Revenue and Forecast, 2021–2031 (US$ Million)
8. North America Gas Engine Market Volume and Revenue Analysis – by Power Output
8.1-300 KW
8.1.1 Overview
8.1.2-300 KW: North America Gas Engine Market – Volume and Forecast, 2021–2031 (New Installation MW)
8.1.3-300 KW: North America Gas Engine Market – Revenue and Forecast, 2021–2031 (US$ Million)
8.2-500 KW
8.2.1 Overview
8.2.2-500 KW: North America Gas Engine Market – Volume and Forecast, 2021–2031 (New Installation MW)
8.2.3-500 KW: North America Gas Engine Market – Revenue and Forecast, 2021–2031 (US$ Million)
8.3 0.5-1 MW
8.3.1 Overview
8.3.2 0.5-1 MW: North America Gas Engine Market – Volume and Forecast, 2021–2031 (New Installation MW)
8.3.3 0.5-1 MW: North America Gas Engine Market – Revenue and Forecast, 2021–2031 (US$ Million)
8.4 1-2 MW
8.4.1 Overview
8.4.2 1-2 MW: North America Gas Engine Market – Volume and Forecast, 2021–2031 (New Installation MW)
8.4.3 1-2 MW: North America Gas Engine Market – Revenue and Forecast, 2021–2031 (US$ Million)
8.5 2-5 MW
8.5.1 Overview
8.5.2 2-5 MW: North America Gas Engine Market – Volume and Forecast, 2021–2031 (New Installation MW)
8.5.3 2-5 MW: North America Gas Engine Market – Revenue and Forecast, 2021–2031 (US$ Million)
8.6 5-10 MW
8.6.1 Overview
8.6.2 5-10 MW: North America Gas Engine Market – Volume and Forecast, 2021–2031 (New Installation MW)
8.6.3 5-10 MW: North America Gas Engine Market – Revenue and Forecast, 2021–2031 (US$ Million)
8.7-15 MW
8.7.1 Overview
8.7.2-15 MW: North America Gas Engine Market – Volume and Forecast, 2021–2031 (New Installation MW)
8.7.3-15 MW: North America Gas Engine Market – Revenue and Forecast, 2021–2031 (US$ Million)
9. North America Gas Engine Market Volume and Revenue Analysis – by End-user
9.1 Remote
9.1.1 Overview
9.1.2 Remote: North America Gas Engine Market – Volume and Forecast, 2021–2031 (New Installation MW)
9.1.3 Remote: North America Gas Engine Market – Revenue and Forecast, 2021–2031 (US$ Million)
9.2 Mid-Stream Oil and Gas
9.2.1 Overview
9.2.2 Mid-Stream Oil and Gas: North America Gas Engine Market – Volume and Forecast, 2021–2031 (New Installation MW)
9.2.3 Mid-Stream Oil and Gas: North America Gas Engine Market – Revenue and Forecast, 2021–2031 (US$ Million)
9.3 Heavy Industries
9.3.1 Overview
9.3.2 Heavy Industries: North America Gas Engine Market – Volume and Forecast, 2021–2031 (New Installation MW)
9.3.3 Heavy Industries: North America Gas Engine Market – Revenue and Forecast, 2021–2031 (US$ Million)
9.4 Light Manufacturing
9.4.1 Overview
9.4.2 Light Manufacturing: North America Gas Engine Market – Volume and Forecast, 2021–2031 (New Installation MW)
9.4.3 Light Manufacturing: North America Gas Engine Market – Revenue and Forecast, 2021–2031 (US$ Million)
9.5 Utilities
9.5.1 Overview
9.5.2 Utilities: North America Gas Engine Market – Volume and Forecast, 2021–2031 (New Installation MW)
9.5.3 Utilities: North America Gas Engine Market – Revenue and Forecast, 2021–2031 (US$ Million)
9.6 Biogas
9.6.1 Overview
9.6.2 Biogas: North America Gas Engine Market – Volume and Forecast, 2021–2031 (New Installation MW)
9.6.3 Biogas: North America Gas Engine Market – Revenue and Forecast, 2021–2031 (US$ Million)
9.7 Datacenters
9.7.1 Overview
9.7.2 Datacenters: North America Gas Engine Market – Volume and Forecast, 2021–2031 (New Installation MW)
9.7.3 Datacenters: North America Gas Engine Market – Revenue and Forecast, 2021–2031 (US$ Million)
9.8 MUSH
9.8.1 Overview
9.8.2 MUSH: North America Gas Engine Market – Volume and Forecast, 2021–2031 (New Installation MW)
9.8.3 MUSH: North America Gas Engine Market – Revenue and Forecast, 2021–2031 (US$ Million)
9.9 Commercial
9.9.1 Overview
9.9.2 Commercial: North America Gas Engine Market – Volume and Forecast, 2021–2031 (New Installation MW)
9.9.3 Commercial: North America Gas Engine Market – Revenue and Forecast, 2021–2031 (US$ Million)
10. North America Gas Engine Market Volume and Revenue Analysis – by Remote
10.1 Mining
10.1.1 Overview
10.1.2 Mining: North America Gas Engine Market – Volume and Forecast, 2021–2031 (New Installation MW)
10.1.3 Mining: North America Gas Engine Market – Revenue and Forecast, 2021–2031 (US$ Million)
10.2 Drilling
10.2.1 Overview
10.2.2 Drilling: North America Gas Engine Market – Volume and Forecast, 2021–2031 (New Installation MW)
10.2.3 Drilling: North America Gas Engine Market – Revenue and Forecast, 2021–2031 (US$ Million)
10.3 Others
10.3.1 Overview
10.3.2 Others: North America Gas Engine Market – Volume and Forecast, 2021–2031 (New Installation MW)
10.3.3 Others: North America Gas Engine Market – Revenue and Forecast, 2021–2031 (US$ Million)
11. North America Gas Engine Market Volume and Revenue Analysis – by Heavy Industries
11.1 Chemicals
11.1.1 Overview
11.1.2 Chemicals: North America Gas Engine Market – Volume and Forecast, 2021–2031 (New Installation MW)
11.1.3 Chemicals: North America Gas Engine Market – Revenue and Forecast, 2021–2031 (US$ Million)
11.2 Paper
11.2.1 Overview
11.2.2 Paper: North America Gas Engine Market – Volume and Forecast, 2021–2031 (New Installation MW)
11.2.3 Paper: North America Gas Engine Market – Revenue and Forecast, 2021–2031 (US$ Million)
11.3 Metals
11.3.1 Overview
11.3.2 Metals: North America Gas Engine Market – Volume and Forecast, 2021–2031 (New Installation MW)
11.3.3 Metals: North America Gas Engine Market – Revenue and Forecast, 2021–2031 (US$ Million)
11.4 Food and Beverages
11.4.1 Overview
11.4.2 Food and Beverages: North America Gas Engine Market – Volume and Forecast, 2021–2031 (New Installation MW)
11.4.3 Food and Beverages: North America Gas Engine Market – Revenue and Forecast, 2021–2031 (US$ Million)
11.5 Others
11.5.1 Overview
11.5.2 Others: North America Gas Engine Market – Volume and Forecast, 2021–2031 (New Installation MW)
11.5.3 Others: North America Gas Engine Market – Revenue and Forecast, 2021–2031 (US$ Million)
12. North America Gas Engine Market Volume and Revenue Analysis – by Utilities
12.1 Grid
12.1.1 Overview
12.1.2 Grid: North America Gas Engine Market – Volume and Forecast, 2021–2031 (New Installation MW)
12.1.3 Grid: North America Gas Engine Market – Revenue and Forecast, 2021–2031 (US$ Million)
12.2 IPP
12.2.1 Overview
12.2.2 IPP: North America Gas Engine Market – Volume and Forecast, 2021–2031 (New Installation MW)
12.2.3 IPP: North America Gas Engine Market – Revenue and Forecast, 2021–2031 (US$ Million)
12.3 Others
12.3.1 Overview
12.3.2 Others: North America Gas Engine Market – Volume and Forecast, 2021–2031 (New Installation MW)
12.3.3 Others: North America Gas Engine Market – Revenue and Forecast, 2021–2031 (US$ Million)
13. North America Gas Engine Market – Country Analysis
13.1 North America
13.1.1 North America Gas Engine Market Revenue and Forecast and Analysis – by Country
13.1.1.1 North America Gas Engine Market Volume and Forecast and Analysis – by Country
13.1.1.2 North America Gas Engine Market Revenue and Forecast and Analysis – by Country
13.1.1.3 US: North America Gas Engine Market – Revenue and Forecast, 2021–2031 (US$ Million)
13.1.1.3.1 US: North America Gas Engine Market Share – by Fuel Type
13.1.1.3.2 US: North America Gas Engine Market Share – by Power Output
13.1.1.3.3 US: North America Gas Engine Market Share – by End-user
13.1.1.3.4 US: North America Gas Engine Market Share – by Remote
13.1.1.3.5 US: North America Gas Engine Market Share – by Heavy Industries
13.1.1.3.6 US: North America Gas Engine Market Share – by Utilities
13.1.1.4 Canada: North America Gas Engine Market – Revenue and Forecast, 2021–2031 (US$ Million)
13.1.1.4.1 Canada: North America Gas Engine Market Share – by Fuel Type
13.1.1.4.2 Canada: North America Gas Engine Market Share – by Power Output
13.1.1.4.3 Canada: North America Gas Engine Market Share – by End-user
13.1.1.4.4 Canada: North America Gas Engine Market Share – by Remote
13.1.1.4.5 Canada: North America Gas Engine Market Share – by Heavy Industries
13.1.1.4.6 Canada: North America Gas Engine Market Share – by Utilities
13.1.1.5 Mexico: North America Gas Engine Market – Revenue and Forecast, 2021–2031 (US$ Million)
13.1.1.5.1 Mexico: North America Gas Engine Market Share – by Fuel Type
13.1.1.5.2 Mexico: North America Gas Engine Market Share – by Power Output
13.1.1.5.3 Mexico: North America Gas Engine Market Share – by End-user
13.1.1.5.4 Mexico: North America Gas Engine Market Share – by Remote
13.1.1.5.5 Mexico: North America Gas Engine Market Share – by Heavy Industries
13.1.1.5.6 Mexico: North America Gas Engine Market Share – by Utilities
14. Competitive Landscape
14.1 Heat Map Analysis by Key Players
14.2 Company Positioning and Concentration
15. Industry Landscape
15.1 Overview
15.2 Market Initiative
15.3 Product Development
15.4 Mergers & Acquisitions
16. Company Profiles
16.1 INNIO Jenbacher GmbH & Co
16.1.1 Key Facts
16.1.2 Business Description
16.1.3 Products and Services
16.1.4 Financial Overview
16.1.5 SWOT Analysis
16.1.6 Key Developments
16.2 Caterpillar Inc
16.2.1 Key Facts
16.2.2 Business Description
16.2.3 Products and Services
16.2.4 Financial Overview
16.2.5 SWOT Analysis
16.2.6 Key Developments
16.3 Cummins Inc
16.3.1 Key Facts
16.3.2 Business Description
16.3.3 Products and Services
16.3.4 Financial Overview
16.3.5 SWOT Analysis
16.3.6 Key Developments
16.4 Fairbanks Morse, LLC
16.4.1 Key Facts
16.4.2 Business Description
16.4.3 Products and Services
16.4.4 Financial Overview
16.4.5 SWOT Analysis
16.4.6 Key Developments
16.5 Kawasaki Heavy Industries Ltd
16.5.1 Key Facts
16.5.2 Business Description
16.5.3 Products and Services
16.5.4 Financial Overview
16.5.5 SWOT Analysis
16.5.6 Key Developments
16.6 Liebherr
16.6.1 Key Facts
16.6.2 Business Description
16.6.3 Products and Services
16.6.4 Financial Overview
16.6.5 SWOT Analysis
16.6.6 Key Developments
16.7 Mitsubishi Heavy Industries Ltd
16.7.1 Key Facts
16.7.2 Business Description
16.7.3 Products and Services
16.7.4 Financial Overview
16.7.5 SWOT Analysis
16.7.6 Key Developments
16.8 R Schmitt Enertec GmbH
16.8.1 Key Facts
16.8.2 Business Description
16.8.3 Products and Services
16.8.4 Financial Overview
16.8.5 SWOT Analysis
16.8.6 Key Developments
16.9 Wartsila Corp
16.9.1 Key Facts
16.9.2 Business Description
16.9.3 Products and Services
16.9.4 Financial Overview
16.9.5 SWOT Analysis
16.9.6 Key Developments
16.10 2G ENERGY AG
16.10.1 Key Facts
16.10.2 Business Description
16.10.3 Products and Services
16.10.4 Financial Overview
16.10.5 SWOT Analysis
16.10.6 Key Developments
16.11 MAN Energy Solutions SE
16.11.1 Key Facts
16.11.2 Business Description
16.11.3 Products and Services
16.11.4 Financial Overview
16.11.5 SWOT Analysis
16.11.6 Key Developments
16.12 IHI Corp
16.12.1 Key Facts
16.12.2 Business Description
16.12.3 Products and Services
16.12.4 Financial Overview
16.12.5 SWOT Analysis
16.12.6 Key Developments
16.13 Guascor Energy S.A.U.
16.13.1 Key Facts
16.13.2 Business Description
16.13.3 Products and Services
16.13.4 Financial Overview
16.13.5 SWOT Analysis
16.13.6 Key Developments
16.14 Ningbo C.S.I. Power & Machinery Group Co., Ltd.
16.14.1 Key Facts
16.14.2 Business Description
16.14.3 Products and Services
16.14.4 Financial Overview
16.14.5 SWOT Analysis
16.14.6 Key Developments
16.15 Rolls-Royce Holdings Plc
16.15.1 Key Facts
16.15.2 Business Description
16.15.3 Products and Services
16.15.4 Financial Overview
16.15.5 SWOT Analysis
16.15.6 Key Developments
17. Appendix
17.1 About The Insight Partners
List of Tables
Table 1. North America Gas Engine Market Segmentation
Table 1. List of Vendors
Table 2. Weighted Average Selling Price, 2024
Table 3. Import Export Analysis -Gas Engine Market
Table 4. North America Gas Engine Market – Volume and Forecast, 2021–2031 (New Installation MW)
Table 5. North America Gas Engine Market – Revenue and Forecast, 2021–2031 (US$ Million)
Table 6. North America Gas Engine Market – Volume and Forecast, 2021–2031 (New Installation MW) – by Fuel Type
Table 7. North America Gas Engine Market – Revenue and Forecast, 2021–2031 (US$ Million) – by Fuel Type
Table 8. North America Gas Engine Market – Volume and Forecast, 2021–2031 (New Installation MW) – by Power Output
Table 9. North America Gas Engine Market – Revenue and Forecast, 2021–2031 (US$ Million) – by Power Output
Table 10. North America Gas Engine Market – Volume and Forecast, 2021–2031 (New Installation MW) – by End-user
Table 11. North America Gas Engine Market – Revenue and Forecast, 2021–2031 (US$ Million) – by End-user
Table 12. North America Gas Engine Market – Volume and Forecast, 2021–2031 (New Installation MW) – by Remote
Table 13. North America Gas Engine Market – Revenue and Forecast, 2021–2031 (US$ Million) – by Remote
Table 14. North America Gas Engine Market – Volume and Forecast, 2021–2031 (New Installation MW) – by Heavy Industries
Table 15. North America Gas Engine Market – Revenue and Forecast, 2021–2031 (US$ Million) – by Heavy Industries
Table 16. North America Gas Engine Market – Volume and Forecast, 2021–2031 (New Installation MW) – by Utilities
Table 17. North America Gas Engine Market – Revenue and Forecast, 2021–2031 (US$ Million) – by Utilities
Table 18. North America Gas Engine Market – Volume and Forecast, 2021–2031 (New Installation MW) – by Country
Table 19. North America Gas Engine Market – Revenue and Forecast, 2021–2031 (US$ Million) – by Country
Table 20. US: North America Gas Engine Market – Volume and Forecast, 2021–2031 (New Installation MW) – by Fuel Type
Table 21. US: North America Gas Engine Market – Revenue and Forecast, 2021–2031 (US$ Million) – by Fuel Type
Table 22. US: North America Gas Engine Market – Volume and Forecast, 2021–2031 (New Installation MW) – by Power Output
Table 23. US: North America Gas Engine Market – Revenue and Forecast, 2021–2031 (US$ Million) – by Power Output
Table 24. US: North America Gas Engine Market – Volume and Forecast, 2021–2031 (New Installation MW) – by End-user
Table 25. US: North America Gas Engine Market – Revenue and Forecast, 2021–2031 (US$ Million) – by End-user
Table 26. US: North America Gas Engine Market – Volume and Forecast, 2021–2031 (New Installation MW) – by Remote
Table 27. US: North America Gas Engine Market – Revenue and Forecast, 2021–2031 (US$ Million) – by Remote
Table 28. US: North America Gas Engine Market – Volume and Forecast, 2021–2031 (New Installation MW) – by Heavy Industries
Table 29. US: North America Gas Engine Market – Revenue and Forecast, 2021–2031 (US$ Million) – by Heavy Industries
Table 30. US: North America Gas Engine Market – Volume and Forecast, 2021–2031 (New Installation MW) – by Utilities
Table 31. US: North America Gas Engine Market – Revenue and Forecast, 2021–2031 (US$ Million) – by Utilities
Table 32. Canada: North America Gas Engine Market – Volume and Forecast, 2021–2031 (New Installation MW) – by Fuel Type
Table 33. Canada: North America Gas Engine Market – Revenue and Forecast, 2021–2031 (US$ Million) – by Fuel Type
Table 34. Canada: North America Gas Engine Market – Volume and Forecast, 2021–2031 (New Installation MW) – by Power Output
Table 35. Canada: North America Gas Engine Market – Revenue and Forecast, 2021–2031 (US$ Million) – by Power Output
Table 36. Canada: North America Gas Engine Market – Volume and Forecast, 2021–2031 (New Installation MW) – by End-user
Table 37. Canada: North America Gas Engine Market – Revenue and Forecast, 2021–2031 (US$ Million) – by End-user
Table 38. Canada: North America Gas Engine Market – Volume and Forecast, 2021–2031 (New Installation MW) – by Remote
Table 39. Canada: North America Gas Engine Market – Revenue and Forecast, 2021–2031 (US$ Million) – by Remote
Table 40. Canada: North America Gas Engine Market – Volume and Forecast, 2021–2031 (New Installation MW) – by Heavy Industries
Table 41. Canada: North America Gas Engine Market – Revenue and Forecast, 2021–2031 (US$ Million) – by Heavy Industries
Table 42. Canada: North America Gas Engine Market – Volume and Forecast, 2021–2031 (New Installation MW) – by Utilities
Table 43. Canada: North America Gas Engine Market – Revenue and Forecast, 2021–2031 (US$ Million) – by Utilities
Table 44. Mexico: North America Gas Engine Market – Volume and Forecast, 2021–2031 (New Installation MW) – by Fuel Type
Table 45. Mexico: North America Gas Engine Market – Revenue and Forecast, 2021–2031 (US$ Million) – by Fuel Type
Table 46. Mexico: North America Gas Engine Market – Volume and Forecast, 2021–2031 (New Installation MW) – by Power Output
Table 47. Mexico: North America Gas Engine Market – Revenue and Forecast, 2021–2031 (US$ Million) – by Power Output
Table 48. Mexico: North America Gas Engine Market – Volume and Forecast, 2021–2031 (New Installation MW) – by End-user
Table 49. Mexico: North America Gas Engine Market – Revenue and Forecast, 2021–2031 (US$ Million) – by End-user
Table 50. Mexico: North America Gas Engine Market – Volume and Forecast, 2021–2031 (New Installation MW) – by Remote
Table 51. Mexico: North America Gas Engine Market – Revenue and Forecast, 2021–2031 (US$ Million) – by Remote
Table 52. Mexico: North America Gas Engine Market – Volume and Forecast, 2021–2031 (New Installation MW) – by Heavy Industries
Table 53. Mexico: North America Gas Engine Market – Revenue and Forecast, 2021–2031 (US$ Million) – by Heavy Industries
Table 54. Mexico: North America Gas Engine Market – Volume and Forecast, 2021–2031 (New Installation MW) – by Utilities
Table 55. Mexico: North America Gas Engine Market – Revenue and Forecast, 2021–2031 (US$ Million) – by Utilities
List of Figures
Figure 1. North America Gas Engine Market Segmentation – Country
Figure 2. PEST Analysis
Figure 3. North America Gas Engine Market – Key Market Dynamics
Figure 4. Impact Analysis of Drivers and Restraints
Figure 5. North America Gas Engine Market Volume (New Installation MW), 2021–2031
Figure 6. North America Gas Engine Market Revenue (US$ Million), 2025–2031
Figure 7. North America Gas Engine Market Share (%) – Fuel Type, 2024 and 2031
Figure 8. Natural Gas: North America Gas Engine Market – Volume and Forecast, 2021–2031 (New Installation MW)
Figure 9. Natural Gas: North America Gas Engine Market – Revenue and Forecast, 2021–2031 (US$ Million)
Figure 10. Special Gas: North America Gas Engine Market – Volume and Forecast, 2021–2031 (New Installation MW)
Figure 11. Special Gas: North America Gas Engine Market – Revenue and Forecast, 2021–2031 (US$ Million)
Figure 12. North America Gas Engine Market Share (%) – Power Output, 2024 and 2031
Figure 13.-300 KW: North America Gas Engine Market – Volume and Forecast, 2021–2031 (New Installation MW)
Figure 14.-300 KW: North America Gas Engine Market – Revenue and Forecast, 2021–2031 (US$ Million)
Figure 15.-500 KW: North America Gas Engine Market – Volume and Forecast, 2021–2031 (New Installation MW)
Figure 16.-500 KW: North America Gas Engine Market – Revenue and Forecast, 2021–2031 (US$ Million)
Figure 17. 0.5-1 MW: North America Gas Engine Market – Volume and Forecast, 2021–2031 (New Installation MW)
Figure 18. 0.5-1 MW: North America Gas Engine Market – Revenue and Forecast, 2021–2031 (US$ Million)
Figure 19. 1-2 MW: North America Gas Engine Market – Volume and Forecast, 2021–2031 (New Installation MW)
Figure 20. 1-2 MW: North America Gas Engine Market – Revenue and Forecast, 2021–2031 (US$ Million)
Figure 21. 2-5 MW: North America Gas Engine Market – Volume and Forecast, 2021–2031 (New Installation MW)
Figure 22. 2-5 MW: North America Gas Engine Market – Revenue and Forecast, 2021–2031 (US$ Million)
Figure 23. 5-10 MW: North America Gas Engine Market – Volume and Forecast, 2021–2031 (New Installation MW)
Figure 24. 5-10 MW: North America Gas Engine Market – Revenue and Forecast, 2021–2031 (US$ Million)
Figure 25.-15 MW: North America Gas Engine Market – Volume and Forecast, 2021–2031 (New Installation MW)
Figure 26.-15 MW: North America Gas Engine Market – Revenue and Forecast, 2021–2031 (US$ Million)
Figure 27. North America Gas Engine Market Share (%) – End-user, 2024 and 2031
Figure 28. Remote: North America Gas Engine Market – Volume and Forecast, 2021–2031 (New Installation MW)
Figure 29. Remote: North America Gas Engine Market – Revenue and Forecast, 2021–2031 (US$ Million)
Figure 30. Mid-Stream Oil and Gas: North America Gas Engine Market – Volume and Forecast, 2021–2031 (New Installation MW)
Figure 31. Mid-Stream Oil and Gas: North America Gas Engine Market – Revenue and Forecast, 2021–2031 (US$ Million)
Figure 32. Heavy Industries: North America Gas Engine Market – Volume and Forecast, 2021–2031 (New Installation MW)
Figure 33. Heavy Industries: North America Gas Engine Market – Revenue and Forecast, 2021–2031 (US$ Million)
Figure 34. Light Manufacturing: North America Gas Engine Market – Volume and Forecast, 2021–2031 (New Installation MW)
Figure 35. Light Manufacturing: North America Gas Engine Market – Revenue and Forecast, 2021–2031 (US$ Million)
Figure 36. Utilities: North America Gas Engine Market – Volume and Forecast, 2021–2031 (New Installation MW)
Figure 37. Utilities: North America Gas Engine Market – Revenue and Forecast, 2021–2031 (US$ Million)
Figure 38. Biogas: North America Gas Engine Market – Volume and Forecast, 2021–2031 (New Installation MW)
Figure 39. Biogas: North America Gas Engine Market – Revenue and Forecast, 2021–2031 (US$ Million)
Figure 40. Datacenters: North America Gas Engine Market – Volume and Forecast, 2021–2031 (New Installation MW)
Figure 41. Datacenters: North America Gas Engine Market – Revenue and Forecast, 2021–2031 (US$ Million)
Figure 42. MUSH: North America Gas Engine Market – Volume and Forecast, 2021–2031 (New Installation MW)
Figure 43. MUSH: North America Gas Engine Market – Revenue and Forecast, 2021–2031 (US$ Million)
Figure 44. Commercial: North America Gas Engine Market – Volume and Forecast, 2021–2031 (New Installation MW)
Figure 45. Commercial: North America Gas Engine Market – Revenue and Forecast, 2021–2031 (US$ Million)
Figure 46. North America Gas Engine Market Share (%) – Remote, 2024 and 2031
Figure 47. Mining: North America Gas Engine Market – Volume and Forecast, 2021–2031 (New Installation MW)
Figure 48. Mining: North America Gas Engine Market – Revenue and Forecast, 2021–2031 (US$ Million)
Figure 49. Drilling: North America Gas Engine Market – Volume and Forecast, 2021–2031 (New Installation MW)
Figure 50. Drilling: North America Gas Engine Market – Revenue and Forecast, 2021–2031 (US$ Million)
Figure 51. Others: North America Gas Engine Market – Volume and Forecast, 2021–2031 (New Installation MW)
Figure 52. Others: North America Gas Engine Market – Revenue and Forecast, 2021–2031 (US$ Million)
Figure 53. North America Gas Engine Market Share (%) – Heavy Industries, 2024 and 2031
Figure 54. Chemicals: North America Gas Engine Market – Volume and Forecast, 2021–2031 (New Installation MW)
Figure 55. Chemicals: North America Gas Engine Market – Revenue and Forecast, 2021–2031 (US$ Million)
Figure 56. Paper: North America Gas Engine Market – Volume and Forecast, 2021–2031 (New Installation MW)
Figure 57. Paper: North America Gas Engine Market – Revenue and Forecast, 2021–2031 (US$ Million)
Figure 58. Metals: North America Gas Engine Market – Volume and Forecast, 2021–2031 (New Installation MW)
Figure 59. Metals: North America Gas Engine Market – Revenue and Forecast, 2021–2031 (US$ Million)
Figure 60. Food and Beverages: North America Gas Engine Market – Volume and Forecast, 2021–2031 (New Installation MW)
Figure 61. Food and Beverages: North America Gas Engine Market – Revenue and Forecast, 2021–2031 (US$ Million)
Figure 62. Others: North America Gas Engine Market – Volume and Forecast, 2021–2031 (New Installation MW)
Figure 63. Others: North America Gas Engine Market – Revenue and Forecast, 2021–2031 (US$ Million)
Figure 64. North America Gas Engine Market Share (%) – Utilities, 2024 and 2031
Figure 65. Grid: North America Gas Engine Market – Volume and Forecast, 2021–2031 (New Installation MW)
Figure 66. Grid: North America Gas Engine Market – Revenue and Forecast, 2021–2031 (US$ Million)
Figure 67. IPP: North America Gas Engine Market – Volume and Forecast, 2021–2031 (New Installation MW)
Figure 68. IPP: North America Gas Engine Market – Revenue and Forecast, 2021–2031 (US$ Million)
Figure 69. Others: North America Gas Engine Market – Volume and Forecast, 2021–2031 (New Installation MW)
Figure 70. Others: North America Gas Engine Market – Revenue and Forecast, 2021–2031 (US$ Million)
Figure 71. North America Gas Engine Market Breakdown by Key Countries, 2024 and 2031 (%)
Figure 72. US: North America Gas Engine Market – Revenue and Forecast, 2021–2031 (US$ Million)
Figure 73. Canada: North America Gas Engine Market – Revenue and Forecast, 2021–2031 (US$ Million)
Figure 74. Mexico: North America Gas Engine Market – Revenue and Forecast, 2021–2031 (US$ Million)
Figure 75. Heat Map Analysis by Key Players
Figure 76. Company Positioning and Concentration
Yes! We provide a free sample of the report, which includes Report Scope (Table of Contents), report structure, and selected insights to help you assess the value of the full report. Please click on the "Download Sample" button or contact us to receive your copy.
Absolutely - analyst assistance is part of the package. You can connect with our analyst post-purchase to clarify report insights, methodology or discuss how the findings apply to your business needs.
Once your order is successfully placed, you will receive a confirmation email along with your invoice.
• For published reports: You'll receive access to the report within 4-6 working hours via a secured email sent to your email.
• For upcoming reports: Your order will be recorded as a pre-booking. Our team will share the estimated release date and keep you informed of any updates. As soon as the report is published, it will be delivered to your registered email.
We offer customization options to align the report with your specific objectives. Whether you need deeper insights into a particular region, industry segment, competitor analysis, or data cut, our research team can tailor the report accordingly. Please share your requirements with us, and we'll be happy to provide a customized proposal or scope.
The report is available in either PDF format or as an Excel dataset, depending on the license you choose.
The PDF version provides the full analysis and visuals in a ready-to-read format. The Excel dataset includes all underlying data tables for easy manipulation and further analysis.
Please review the license options at checkout or contact us to confirm which formats are included with your purchase.
Our payment process is fully secure and PCI-DSS compliant.
We use trusted and encrypted payment gateways to ensure that all transactions are protected with industry-standard SSL encryption. Your payment details are never stored on our servers and are handled securely by certified third-party processors.
You can make your purchase with confidence, knowing your personal and financial information is safe with us.
Yes, we do offer special pricing for bulk purchases.
If you're interested in purchasing multiple reports, we're happy to provide a customized bundle offer or volume-based discount tailored to your needs. Please contact our sales team with the list of reports you're considering, and we'll share a personalized quote.
Yes, absolutely.
Our team is available to help you make an informed decision. Whether you have questions about the report's scope, methodology, customization options, or which license suits you best, we're here to assist. Please reach out to us at sales@theinsightpartners.com, and one of our representatives will get in touch promptly.
Yes, a billing invoice will be automatically generated and sent to your registered email upon successful completion of your purchase.
If you need the invoice in a specific format or require additional details (such as company name, GST, or VAT information), feel free to contact us, and we'll be happy to assist.
Yes, certainly.
If you encounter any difficulties accessing or receiving your report, our support team is ready to assist you. Simply reach out to us via email or live chat with your order information, and we'll ensure the issue is resolved quickly so you can access your report without interruption.
The Insight Partners performs research in 4 major stages: Data Collection & Secondary Research, Primary Research, Data Analysis and Data Triangulation & Final Review.
- Data Collection and Secondary Research:
As a market research and consulting firm operating from a decade, we have published many reports and advised several clients across the globe. First step for any study will start with an assessment of currently available data and insights from existing reports. Further, historical and current market information is collected from Investor Presentations, Annual Reports, SEC Filings, etc., and other information related to company’s performance and market positioning are gathered from Paid Databases (Factiva, Hoovers, and Reuters) and various other publications available in public domain.
Several associations trade associates, technical forums, institutes, societies and organizations are accessed to gain technical as well as market related insights through their publications such as research papers, blogs and press releases related to the studies are referred to get cues about the market. Further, white papers, journals, magazines, and other news articles published in the last 3 years are scrutinized and analyzed to understand the current market trends.
- Primary Research:
The primarily interview analysis comprise of data obtained from industry participants interview and answers to survey questions gathered by in-house primary team.
For primary research, interviews are conducted with industry experts/CEOs/Marketing Managers/Sales Managers/VPs/Subject Matter Experts from both demand and supply side to get a 360-degree view of the market. The primary team conducts several interviews based on the complexity of the markets to understand the various market trends and dynamics which makes research more credible and precise.
A typical research interview fulfils the following functions:
- Provides first-hand information on the market size, market trends, growth trends, competitive landscape, and outlook
- Validates and strengthens in-house secondary research findings
- Develops the analysis team’s expertise and market understanding
Primary research involves email interactions and telephone interviews for each market, category, segment, and sub-segment across geographies. The participants who typically take part in such a process include, but are not limited to:
- Industry participants: VPs, business development managers, market intelligence managers and national sales managers
- Outside experts: Valuation experts, research analysts and key opinion leaders specializing in the electronics and semiconductor industry.
Below is the breakup of our primary respondents by company, designation, and region:

Once we receive the confirmation from primary research sources or primary respondents, we finalize the base year market estimation and forecast the data as per the macroeconomic and microeconomic factors assessed during data collection.
- Data Analysis:
Once data is validated through both secondary as well as primary respondents, we finalize the market estimations by hypothesis formulation and factor analysis at regional and country level.
- 3.1 Macro-Economic Factor Analysis:
We analyse macroeconomic indicators such the gross domestic product (GDP), increase in the demand for goods and services across industries, technological advancement, regional economic growth, governmental policies, the influence of COVID-19, PEST analysis, and other aspects. This analysis aids in setting benchmarks for various nations/regions and approximating market splits. Additionally, the general trend of the aforementioned components aid in determining the market's development possibilities.
- 3.2 Country Level Data:
Various factors that are especially aligned to the country are taken into account to determine the market size for a certain area and country, including the presence of vendors, such as headquarters and offices, the country's GDP, demand patterns, and industry growth. To comprehend the market dynamics for the nation, a number of growth variables, inhibitors, application areas, and current market trends are researched. The aforementioned elements aid in determining the country's overall market's growth potential.
- 3.3 Company Profile:
The “Table of Contents” is formulated by listing and analyzing more than 25 - 30 companies operating in the market ecosystem across geographies. However, we profile only 10 companies as a standard practice in our syndicate reports. These 10 companies comprise leading, emerging, and regional players. Nonetheless, our analysis is not restricted to the 10 listed companies, we also analyze other companies present in the market to develop a holistic view and understand the prevailing trends. The “Company Profiles” section in the report covers key facts, business description, products & services, financial information, SWOT analysis, and key developments. The financial information presented is extracted from the annual reports and official documents of the publicly listed companies. Upon collecting the information for the sections of respective companies, we verify them via various primary sources and then compile the data in respective company profiles. The company level information helps us in deriving the base number as well as in forecasting the market size.
- 3.4 Developing Base Number:
Aggregation of sales statistics (2020-2022) and macro-economic factor, and other secondary and primary research insights are utilized to arrive at base number and related market shares for 2022. The data gaps are identified in this step and relevant market data is analyzed, collected from paid primary interviews or databases. On finalizing the base year market size, forecasts are developed on the basis of macro-economic, industry and market growth factors and company level analysis.
- Data Triangulation and Final Review:
The market findings and base year market size calculations are validated from supply as well as demand side. Demand side validations are based on macro-economic factor analysis and benchmarks for respective regions and countries. In case of supply side validations, revenues of major companies are estimated (in case not available) based on industry benchmark, approximate number of employees, product portfolio, and primary interviews revenues are gathered. Further revenue from target product/service segment is assessed to avoid overshooting of market statistics. In case of heavy deviations between supply and demand side values, all thes steps are repeated to achieve synchronization.
We follow an iterative model, wherein we share our research findings with Subject Matter Experts (SME’s) and Key Opinion Leaders (KOLs) until consensus view of the market is not formulated – this model negates any drastic deviation in the opinions of experts. Only validated and universally acceptable research findings are quoted in our reports.
We have important check points that we use to validate our research findings – which we call – data triangulation, where we validate the information, we generate from secondary sources with primary interviews and then we re-validate with our internal data bases and Subject matter experts. This comprehensive model enables us to deliver high quality, reliable data in shortest possible time.
 Get Free Sample For