Asia Pacific Glass Wafers Market Size and Competitive Analysis by 2028
Asia Pacific Glass Wafers Market Forecast to 2028 - COVID-19 Impact and Regional Analysis By Application (CMOS image sensor, Integrated Circuit (IC) Packaging, LED, Microfluidics, FO-WLP, MEMs and RF), End Use (Energy, IT & Telecommunication, Consumer Electronics, Aerospace & Defense, Automotive, Healthcare and Biotechnology)
- Report Date : May 2021
- Report Code : TIPRE00022129
- Category : Chemicals and Materials
- Status : Published
- Available Report Formats :


- No. of Pages : 126
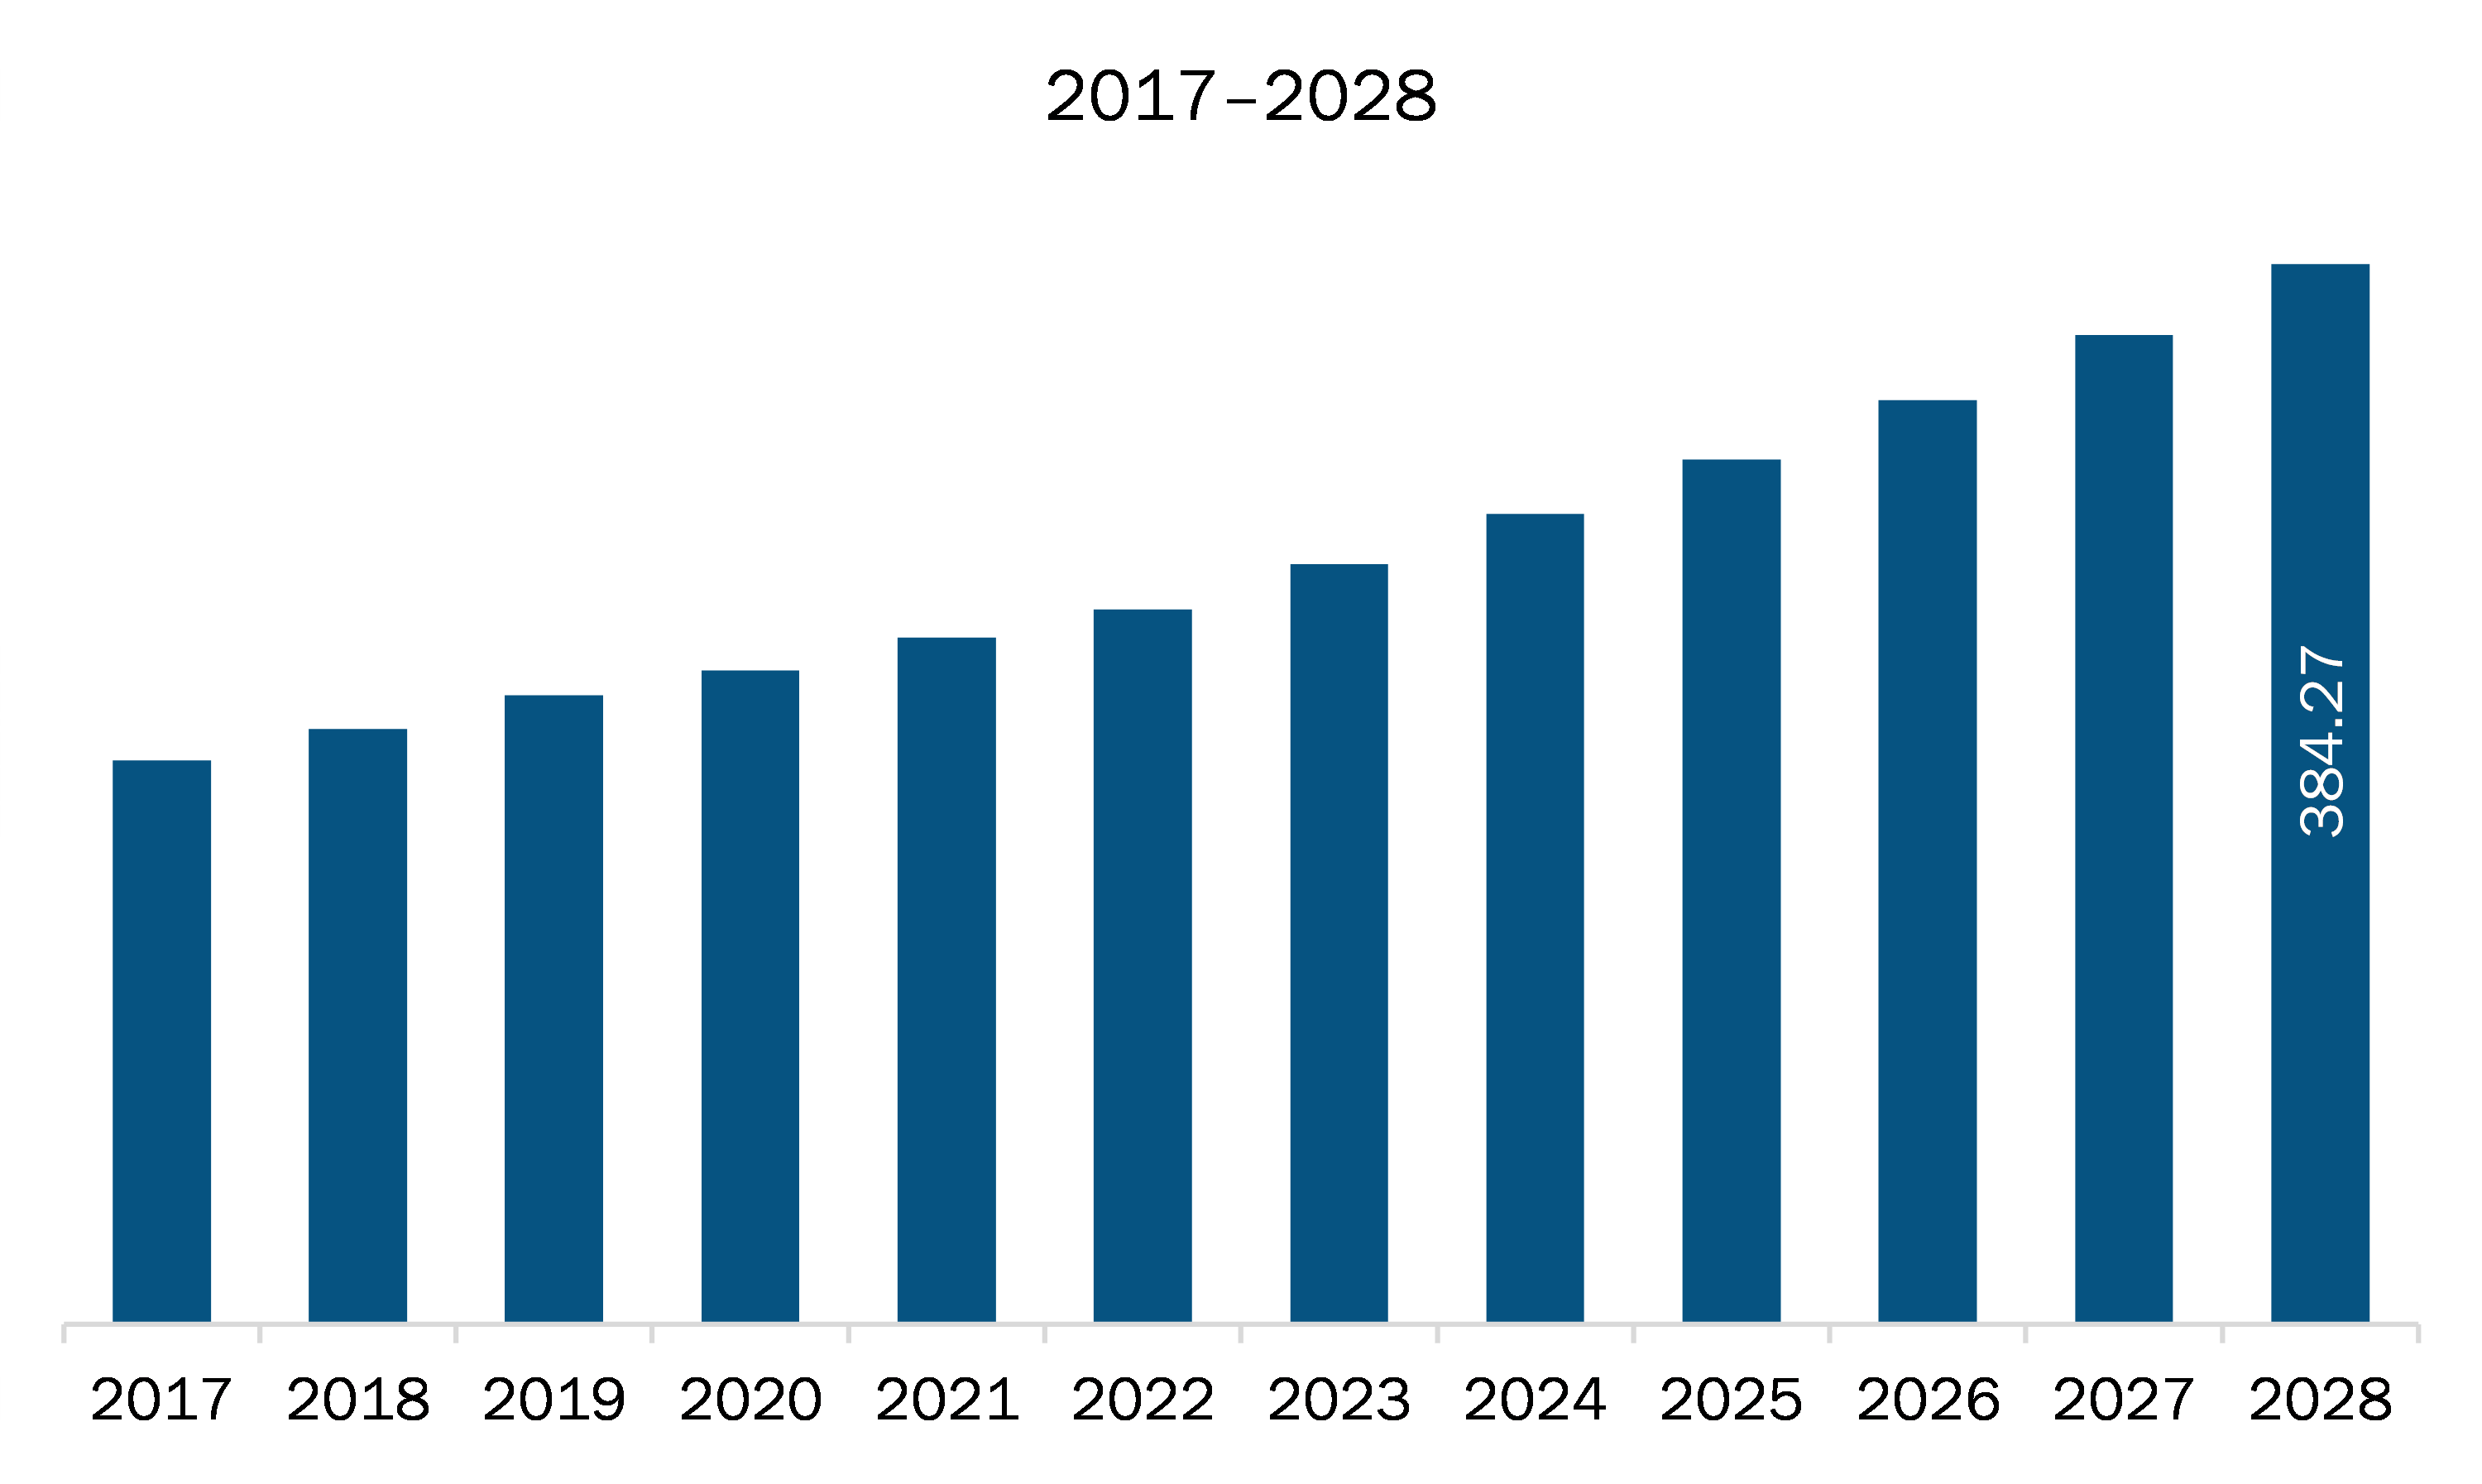
The glass wafers market in Asia Pacific is expected to grow from US$ 186.83 million in 2020 to US$ 384.27 million by 2028; it is estimated to grow at a CAGR of 9.3% from 2021 to 2028.
Asia Pacific continent comprises several developing economies such as India, China, Japan, South Korea, Australia, among others. These emerging countries are witnessing an upsurge in industrialization and urbanization activities, offering ample opportunities for the key market players in the glass wafer market. The glass wafer market in the countries of Asia Pacific has experienced a considerable shift over the years. The massive growth of the Asia-Pacific region is due to a manufacturing base in the emerging economies, such as India, Japan, China, South Korea, Singapore, Taiwan, and Indonesia have large manufacturing industries. The Asia Pacific region encompasses an ample amount of opportunities for the growth of glass wafer. The glass wafer market in the Asia Pacific region has been driven by various properties of glass wafer which are thermal stability, chemical resistance, superior functionality and is extremely reliable in order to withstand harsh environments. Attributed to the Asia Pacific region's flourishing economic conditions, there has been a spur in its industrial activities.
In case of COVID-19, in Asia Pacific, especially India, witnessed an unprecedented rise in number of coronavirus cases, which led to the discontinuation of glass wafers manufacturing activities; other glass components manufacturing sector has subsequently impacted the demand for glass wafers during the early months of 2020. Moreover, decline in the overall manufacturing activities has led to discontinuation of glass equipment manufacturing projects, thereby reducing the demand for glass wafers. Similar trend was witnessed in other Asia Pacific countries, i.e., Japan, China, Australia and South Korea. However, the countries are likely to overcome thus drop in demand with the economic activities regaining their pace, especially in the beginning of the 2021.
- Sample PDF showcases the content structure and the nature of the information with qualitative and quantitative analysis.
- Request discounts available for Start-Ups & Universities
Asia Pacific Glass Wafers Market Segmentation
A
sia Pacific Glass Wafers Market – By Application
- CMOS Image Sensor
- Integrated Circuit (IC) Packaging
- LED
- Microfluidics
- FO-WLP
- Mems and RF
- Others
Asia Pacific Glass wafers Market – By End Use
- Energy
- IT and Telecommunication
- Consumer Electronics
- Aerospace and Defense
- Automotive
- Healthcare and Biotechnology
- Others
Asia Pacific Glass Wafers Market, by Country
- Australia
- China
- India
- Japan
- South Korea
- Rest of Asia Pacific
Asia Pacific Glass Wafers Market-Companies Mentioned
- Schott AG
- AGC Inc.
- Corning Incorporated
- Plan Optik AG
- Bullen
- Nippon Electric Glass Co. Ltd.
- Samtec Inc.
- Shin-Etsu Chemical Co., Ltd.

Report Coverage
Revenue forecast, Company Analysis, Industry landscape, Growth factors, and Trends

Segment Covered
Application Packaging, End Use

Regional Scope
North America, Europe, Asia Pacific, Middle East & Africa, South & Central America

Country Scope
Australia, China, Japan, South Korea
1. Introduction
1.1 Study Scope
1.2 The Insight Partners Research Report Guidance
1.3 Market Segmentation
2. Key Takeaways
3. Research Methodology
3.1 Scope of the Study
3.2 Research Methodology
3.2.1 Data Collection:
3.2.2 Primary Interviews:
3.2.3 Hypothesis formulation:
3.2.4 Macro-economic factor analysis:
3.2.5 Developing base number:
3.2.6 Data Triangulation:
3.2.7 Country level data:
4. Asia Pacific Glass Wafers Market Landscape
4.1 Market Overview
4.2 PEST Analysis
4.3 Expert Opinion
5. Glass Wafers Market – Key Market Dynamics
5.1 Market Drivers
5.1.1 Rapid Adoption of MEMs Technology
5.1.2 Widescale application of Glass Wafer in Various Industries
5.2 Restraint
5.2.1 High Installation Cost
5.3 Opportunity
5.3.1 Increase in demand from Asia Pacific
5.4 Future Trend
5.4.1 Innovative and Technical Applications for Glass Wafer
5.5 Impact Analysis of Drivers and Restraints
6. Glass Wafers – Asia Pacific Market Analysis
6.1 Glass Wafers Market Overview
6.2 Asia Pacific Glass Wafers Market –Revenue and Forecast to 2027 (US$ Million)
7. Asia Pacific Glass Wafer Market Analysis – By Application
7.1 Overview
7.2 Asia Pacific Glass Wafer Market Breakdown, By Application, 2020 & 2028
7.3 CMOS Image Sensor
7.3.1 Overview
7.3.2 CMOS Image Sensor: Glass wafer Market – Revenue, and Forecast to 2028 (US$ Million)
7.4 Integrated Circuit Packaging
7.4.1 Overview
7.4.2 Integrated Circuit Packaging: Glass Wafer Market – Revenue, and Forecast to 2028 (US$ Million)
7.5 LED
7.5.1 Overview
7.5.2 LED: Glass Wafer Market – Revenue, and Forecast to 2028 (US$ Million)
7.6 MEMs and RF
7.6.1 Overview
7.6.2 MEMs and RF: Glass wafer Market – Revenue, and Forecast to 2028 (US$ Million)
7.7 Microfluidics
7.7.1 Overview
7.7.2 Microfluidics: Glass wafer Market – Revenue, and Forecast to 2028 (US$ Million)
7.8 FO WLP
7.8.1 Overview
7.8.2 FO WLP: Glass wafer Market – Revenue, and Forecast to 2028 (US$ Million)
7.9 Other Applications
7.9.1 Overview
7.9.2 Other Applications: Glass wafer Market – Revenue, and Forecast to 2028 (US$ Million)
8. Asia Pacific Glass wafer Market Analysis – By End Use
8.1 Overview
8.2 Glass Wafer Market Breakdown, By End Use2020 & 2028
8.3 Energy
8.3.1 Overview
8.3.2 Energy: Glass wafer Market – Revenue, and Forecast to 2028 (US$ Million)
8.4 IT and Telecommunications
8.4.1 Overview
8.4.2 IT and Telecommunications: Glass Wafer Market – Revenue, and Forecast to 2028 (US$ Million)
8.5 Consumer Electronics
8.5.1 Overview
8.5.2 Consumer Electronics: Glass wafer Market – Revenue, and Forecast to 2028 (US$ Million)
8.6 Aerospace and Defense
8.6.1 Overview
8.6.2 Aerospace and Defense: Glass wafer Market – Revenue, and Forecast to 2028 (US$ Million)
8.7 Automotive
8.7.1 Overview
8.7.2 Automotive: Glass Wafer Market – Revenue, and Forecast to 2028 (US$ Million)
8.8 Healthcare and Biotechnology
8.8.1 Overview
8.8.2 Healthcare and Biotechnology: Glass wafer Market – Revenue, and Forecast to 2028 (US$ Million)
8.9 Other End-Use
8.9.1 Overview
8.9.2 Others End-Use: Glass wafer Market – Revenue, and Forecast to 2028 (US$ Million)
9. Asia Pacific Glass Wafer Market – Country Analysis
9.1 Overview
9.1.1 Asia Pacific: Glass wafer Market, by Key Country
9.1.1.1 Australia: Glass wafer Market –Revenue and Forecast to 2028 (US$ Million)
9.1.1.1.1 Australia: Glass wafer Market, by Application
9.1.1.1.2 Australia: Glass wafer Market, by End Use
9.1.1.2 China: Glass wafer Market –Revenue and Forecast to 2028 (US$ Million)
9.1.1.2.1 China: Glass wafer Market, by Application
9.1.1.2.2 China: Glass wafer Market, by End Use
9.1.1.3 Japan: Glass wafer Market –Revenue and Forecast to 2028 (US$ Million)
9.1.1.3.1 Japan: Glass wafer Market, by Application
9.1.1.3.2 Japan: Glass wafer Market, by End Use
9.1.1.4 India: Glass wafer Market –Revenue and Forecast to 2028 (US$ Million)
9.1.1.4.1 India: Glass wafer Market, by Application
9.1.1.4.2 India: Glass wafer Market, by End Use
9.1.1.5 South Korea: Glass wafer Market –Revenue and Forecast to 2028 (US$ Million)
9.1.1.5.1 South Korea: Glass wafer Market, by Application
9.1.1.5.2 South Korea: Glass wafer Market, by End Use
9.1.1.6 Rest of Asia Pacific: Glass wafer Market –Revenue and Forecast to 2028 (US$ Million)
9.1.1.6.1 Rest of Asia Pacific: Glass wafer Market, by Application
9.1.1.6.2 Rest of Asia Pacific: Glass wafer Market, by End Use
10. Overview- Impact of COVID-19 on Asia Pacific Glass Wafers Market
10.1 Asia-Pacific: Impact Assessment of COVID-19 Pandemic
11. Industry Landscape
11.1 Overview
11.2 Product Launch
11.3 Product News
11.4 Partnership
11.5 Expansion
12. Company Profiles
12.1 SCHOTT AG
12.1.1 Key Facts
12.1.2 Business Description
12.1.3 Products and Services
12.1.4 Financial Overview
12.1.5 SWOT Analysis
12.1.6 Key Developments
12.2 AGC Inc.
12.2.1 Key Facts
12.2.2 Business Description
12.2.3 Products and Services
12.2.4 Financial Overview
12.2.5 SWOT Analysis
12.2.6 Key Developments
12.3 Corning Incorporated
12.3.1 Key Facts
12.3.2 Business Description
12.3.3 Products and Services
12.3.4 Financial Overview
12.3.5 SWOT Analysis
12.3.6 Key Developments
12.4 Plan Optik AG
12.4.1 Key Facts
12.4.2 Business Description
12.4.3 Products and Services
12.4.4 Financial Overview
12.4.5 SWOT Analysis
12.4.6 Key Developments
12.5 BULLEN
12.5.1 Key Facts
12.5.2 Business Description
12.5.3 Products and Services
12.5.4 Financial Overview
12.5.5 SWOT Analysis
12.5.6 Key Developments
12.6 Nippon Electric Glass Co.,Ltd.
12.6.1 Key Facts
12.6.2 Business Description
12.6.3 Products and Services
12.6.4 Financial Overview
12.6.5 SWOT Analysis
12.6.6 Key Developments
12.7 SAMTEC, Inc.
12.7.1 Key Facts
12.7.2 Business Description
12.7.3 Products and Services
12.7.4 Financial Overview
12.7.5 SWOT Analysis
12.7.6 Key Developments
12.8 Shin-Etsu Chemical Co., Ltd
12.8.1 Key Facts
12.8.2 Business Description
12.8.3 Products and Services
12.8.4 Financial Overview
12.8.5 SWOT Analysis
12.8.6 Key Developments
13. Appendix
13.1 About The Insight Partners
13.2 Glossary of TermsLIST OF TABLES
Table 1. Asia Pacific Glass Wafers Market –Revenue and Forecast to 2027 (US$ Million)
Table 2. Australia Glass Wafers Market, by Application – Revenue and Forecast to 2028 (USD Million)
Table 3. Australia Glass Wafers Market, by End-Use – Revenue and Forecast to 2028 (USD Million)
Table 4. China Glass Wafers Market, by Application – Revenue and Forecast to 2028 (USD Million)
Table 5. China Glass Wafers Market, by End-Use – Revenue and Forecast to 2028 (USD Million)
Table 6. Japan Glass Wafers Market, by Application – Revenue and Forecast to 2028 (USD Million)
Table 7. Japan Glass Wafers Market, by End-Use – Revenue and Forecast to 2028 (USD Million)
Table 8. India Glass Wafers Market, by Application – Revenue and Forecast to 2028 (USD Million)
Table 9. India Glass Wafers Market, by End-Use – Revenue and Forecast to 2028 (USD Million)
Table 10. South Korea Glass Wafers Market, by Application – Revenue and Forecast to 2028 (USD Million)
Table 11. South Korea Glass Wafers Market, by End-Use – Revenue and Forecast to 2028 (USD Million)
Table 12. Rest of APAC Glass Wafers Market, by Application – Revenue and Forecast to 2028 (USD Million)
Table 13. Rest of APAC Glass Wafers Market, by End-Use – Revenue and Forecast to 2028 (USD Million)
Table 14. Glossary of Terms, Glass Wafers MarketLIST OF FIGURES
Figure 1. Glass Wafers Market Segmentation
Figure 2. Asia Pacific Glass Wafers Market Segmentation – By Country
Figure 3. Asia Pacific Glass Wafers Market Overview
Figure 4. Consumer Electronics Segment Held Largest Share of Asia Pacific Glass Wafers Market
Figure 5. China Held Largest Share of Asia Pacific Glass Wafers Market
Figure 6. Asia Pacific Glass Wafers Market, Key Market Players
Figure 7. APAC: PEST Analysis
Figure 8. Expert Opinion
Figure 9. Asia Pacific Glass Wafer Market Impact Analysis of Drivers and Restraints
Figure 10. Asia Pacific: Glass Wafers Market – Revenue and Forecast to 2027 (US$ Million)
Figure 11. Asia Pacific Glass Wafer Market Breakdown, By Application, 2020 & 2028
Figure 12. CMOS Image Sensor: Glass wafer Market – Revenue, and Forecast to 2028 (US$ Million)
Figure 13. Integrated Circuit Packaging: Glass Wafer Market – Revenue, and Forecast to 2028 (US$ Million)
Figure 14. LED: Glass Wafer Market – Revenue, and Forecast to 2028 (US$ Million)
Figure 15. MEMs and RF: Glass wafer Market – Revenue, and Forecast to 2028 (US$ Million)
Figure 16. Microfluidics: Glass wafer Market – Revenue, and Forecast to 2028 (US$ Million)
Figure 17. FO WLP: Glass wafer Market – Revenue, and Forecast to 2028 (US$ Million)
Figure 18. Other Applications: Glass wafer Market – Revenue, and Forecast to 2028 (US$ Million)
Figure 19. Glass Wafer Market Breakdown, By End Use, 2020 & 2028 (%)
Figure 20. Energy: Glass wafer Market – Revenue, and Forecast to 2028 (US$ Million)
Figure 21. IT and Telecommunications: Glass Wafer Market – Revenue, and Forecast to 2028 (US$ Million)
Figure 22. Consumer Electronics: Glass wafer Market – Revenue, and Forecast to 2028 (US$ Million)
Figure 23. Aerospace and Defense: Glass wafer Market – Revenue, and Forecast to 2028 (US$ Million)
Figure 24. Automotive: Glass Wafer Market – Revenue, and Forecast to 2028 (US$ Million)
Figure 25. Healthcare and Biotechnology: Glass wafer Market – Revenue, and Forecast to 2028 (US$ Million)
Figure 26. Other End-Use: Glass wafer Market – Revenue, and Forecast to 2028 (US$ Million)
Figure 27. Asia Pacific: Glass Wafers Market, by Key Country – Revenue (2020) (USD Million)
Figure 28. Asia Pacific: Glass wafer Market Revenue Share, by Key Country (2020 and 2028)
Figure 29. Australia: Glass wafer Market –Revenue and Forecast to 2028 (US$ Million)
Figure 30. China: Glass wafer Market –Revenue and Forecast to 2028 (US$ Million)
Figure 31. Japan: Glass wafer Market –Revenue and Forecast to 2028 (US$ Million)
Figure 32. India: Glass wafer Market –Revenue and Forecast to 2028 (US$ Million)
Figure 33. South Korea: Glass wafer Market –Revenue and Forecast to 2028 (US$ Million)
Figure 34. Rest of Asia Pacific: Glass wafer Market –Revenue and Forecast to 2028 (US$ Million)
Figure 35. Impact of COVID-19 Pandemic in Asia Pacific Country MarketsYes! We provide a free sample of the report, which includes Report Scope (Table of Contents), report structure, and selected insights to help you assess the value of the full report. Please click on the "Download Sample" button or contact us to receive your copy.
Absolutely - analyst assistance is part of the package. You can connect with our analyst post-purchase to clarify report insights, methodology or discuss how the findings apply to your business needs.
Once your order is successfully placed, you will receive a confirmation email along with your invoice.
• For published reports: You'll receive access to the report within 4-6 working hours via a secured email sent to your email.
• For upcoming reports: Your order will be recorded as a pre-booking. Our team will share the estimated release date and keep you informed of any updates. As soon as the report is published, it will be delivered to your registered email.
We offer customization options to align the report with your specific objectives. Whether you need deeper insights into a particular region, industry segment, competitor analysis, or data cut, our research team can tailor the report accordingly. Please share your requirements with us, and we'll be happy to provide a customized proposal or scope.
The report is available in either PDF format or as an Excel dataset, depending on the license you choose.
The PDF version provides the full analysis and visuals in a ready-to-read format. The Excel dataset includes all underlying data tables for easy manipulation and further analysis.
Please review the license options at checkout or contact us to confirm which formats are included with your purchase.
Our payment process is fully secure and PCI-DSS compliant.
We use trusted and encrypted payment gateways to ensure that all transactions are protected with industry-standard SSL encryption. Your payment details are never stored on our servers and are handled securely by certified third-party processors.
You can make your purchase with confidence, knowing your personal and financial information is safe with us.
Yes, we do offer special pricing for bulk purchases.
If you're interested in purchasing multiple reports, we're happy to provide a customized bundle offer or volume-based discount tailored to your needs. Please contact our sales team with the list of reports you're considering, and we'll share a personalized quote.
Yes, absolutely.
Our team is available to help you make an informed decision. Whether you have questions about the report's scope, methodology, customization options, or which license suits you best, we're here to assist. Please reach out to us at sales@theinsightpartners.com, and one of our representatives will get in touch promptly.
Yes, a billing invoice will be automatically generated and sent to your registered email upon successful completion of your purchase.
If you need the invoice in a specific format or require additional details (such as company name, GST, or VAT information), feel free to contact us, and we'll be happy to assist.
Yes, certainly.
If you encounter any difficulties accessing or receiving your report, our support team is ready to assist you. Simply reach out to us via email or live chat with your order information, and we'll ensure the issue is resolved quickly so you can access your report without interruption.
The Insight Partners performs research in 4 major stages: Data Collection & Secondary Research, Primary Research, Data Analysis and Data Triangulation & Final Review.
- Data Collection and Secondary Research:
As a market research and consulting firm operating from a decade, we have published many reports and advised several clients across the globe. First step for any study will start with an assessment of currently available data and insights from existing reports. Further, historical and current market information is collected from Investor Presentations, Annual Reports, SEC Filings, etc., and other information related to company’s performance and market positioning are gathered from Paid Databases (Factiva, Hoovers, and Reuters) and various other publications available in public domain.
Several associations trade associates, technical forums, institutes, societies and organizations are accessed to gain technical as well as market related insights through their publications such as research papers, blogs and press releases related to the studies are referred to get cues about the market. Further, white papers, journals, magazines, and other news articles published in the last 3 years are scrutinized and analyzed to understand the current market trends.
- Primary Research:
The primarily interview analysis comprise of data obtained from industry participants interview and answers to survey questions gathered by in-house primary team.
For primary research, interviews are conducted with industry experts/CEOs/Marketing Managers/Sales Managers/VPs/Subject Matter Experts from both demand and supply side to get a 360-degree view of the market. The primary team conducts several interviews based on the complexity of the markets to understand the various market trends and dynamics which makes research more credible and precise.
A typical research interview fulfils the following functions:
- Provides first-hand information on the market size, market trends, growth trends, competitive landscape, and outlook
- Validates and strengthens in-house secondary research findings
- Develops the analysis team’s expertise and market understanding
Primary research involves email interactions and telephone interviews for each market, category, segment, and sub-segment across geographies. The participants who typically take part in such a process include, but are not limited to:
- Industry participants: VPs, business development managers, market intelligence managers and national sales managers
- Outside experts: Valuation experts, research analysts and key opinion leaders specializing in the electronics and semiconductor industry.
Below is the breakup of our primary respondents by company, designation, and region:

Once we receive the confirmation from primary research sources or primary respondents, we finalize the base year market estimation and forecast the data as per the macroeconomic and microeconomic factors assessed during data collection.
- Data Analysis:
Once data is validated through both secondary as well as primary respondents, we finalize the market estimations by hypothesis formulation and factor analysis at regional and country level.
- 3.1 Macro-Economic Factor Analysis:
We analyse macroeconomic indicators such the gross domestic product (GDP), increase in the demand for goods and services across industries, technological advancement, regional economic growth, governmental policies, the influence of COVID-19, PEST analysis, and other aspects. This analysis aids in setting benchmarks for various nations/regions and approximating market splits. Additionally, the general trend of the aforementioned components aid in determining the market's development possibilities.
- 3.2 Country Level Data:
Various factors that are especially aligned to the country are taken into account to determine the market size for a certain area and country, including the presence of vendors, such as headquarters and offices, the country's GDP, demand patterns, and industry growth. To comprehend the market dynamics for the nation, a number of growth variables, inhibitors, application areas, and current market trends are researched. The aforementioned elements aid in determining the country's overall market's growth potential.
- 3.3 Company Profile:
The “Table of Contents” is formulated by listing and analyzing more than 25 - 30 companies operating in the market ecosystem across geographies. However, we profile only 10 companies as a standard practice in our syndicate reports. These 10 companies comprise leading, emerging, and regional players. Nonetheless, our analysis is not restricted to the 10 listed companies, we also analyze other companies present in the market to develop a holistic view and understand the prevailing trends. The “Company Profiles” section in the report covers key facts, business description, products & services, financial information, SWOT analysis, and key developments. The financial information presented is extracted from the annual reports and official documents of the publicly listed companies. Upon collecting the information for the sections of respective companies, we verify them via various primary sources and then compile the data in respective company profiles. The company level information helps us in deriving the base number as well as in forecasting the market size.
- 3.4 Developing Base Number:
Aggregation of sales statistics (2020-2022) and macro-economic factor, and other secondary and primary research insights are utilized to arrive at base number and related market shares for 2022. The data gaps are identified in this step and relevant market data is analyzed, collected from paid primary interviews or databases. On finalizing the base year market size, forecasts are developed on the basis of macro-economic, industry and market growth factors and company level analysis.
- Data Triangulation and Final Review:
The market findings and base year market size calculations are validated from supply as well as demand side. Demand side validations are based on macro-economic factor analysis and benchmarks for respective regions and countries. In case of supply side validations, revenues of major companies are estimated (in case not available) based on industry benchmark, approximate number of employees, product portfolio, and primary interviews revenues are gathered. Further revenue from target product/service segment is assessed to avoid overshooting of market statistics. In case of heavy deviations between supply and demand side values, all thes steps are repeated to achieve synchronization.
We follow an iterative model, wherein we share our research findings with Subject Matter Experts (SME’s) and Key Opinion Leaders (KOLs) until consensus view of the market is not formulated – this model negates any drastic deviation in the opinions of experts. Only validated and universally acceptable research findings are quoted in our reports.
We have important check points that we use to validate our research findings – which we call – data triangulation, where we validate the information, we generate from secondary sources with primary interviews and then we re-validate with our internal data bases and Subject matter experts. This comprehensive model enables us to deliver high quality, reliable data in shortest possible time.

May 2021
Rhamnolipids Market
Size and Forecast (2021 - 2031), Global and Regional Share, Trend, and Growth Opportunity Analysis Report Coverage: By Type (Mono-rhamnolipids and Di-rhamnolipids), Application [Daily Chemicals (Laundry Detergents, Dishwashers, Surface Cleaners, and Others), Personal Care and Cosmetics, Agriculture, Food, Pharmaceuticals, Oilfield and Petroleum, Environmental Protection, and Others] and Geography (North America, Europe, Asia Pacific, Middle East and Africa, and South and Central America)
May 2021
Europe Spray Marking Paints Market
Size and Forecast (2021 - 2035), Regional Share, Trend, and Growth Opportunity Analysis Report Coverage: By Propellant Type [LPG, Dimethyl Ether (DME), and Others], By Technology (Solvent-Based, Water-Based, and Others), By Application [Construction (Geodesy and Topography in Building and Construction, Railway Marking, Landscaped/Agricultural/Military Site Marking, and Others), Forestry [Tree Marking, Log Marking, Plank Marking, and Others], Line Marking (Information Marking and Signaling, Parking Spaces, Safety Marking and Signage, and Space Delimitation), Packaging, and Others], and Country
May 2021
Adhesives Market
Size and Forecast (2021 - 2031), Global and Regional Share, Trend, and Growth Opportunity Analysis Report Coverage: By Resin Type (Epoxy, Polyurethane, Acrylic, and Others), By End-Use Industry (Automotive, Aerospace, Paper and Packaging, Building and Construction, Electrical and Electronics, Medical, and Others), and Geography (North America, Europe, Asia Pacific, Middle East and Africa, and South and Central America)
May 2021
Ester for Synthetic and Bio-Based Lubricants Market
Size and Forecast (2021 - 2031), Global and Regional Share, Trend, and Growth Opportunity Analysis Report Coverage: By Ester Type [Monoesters, Diesters, Polyol Esters (Trimethylolpropane Esters, Pentaerythritol Esters, Neopentyl Glycol Esters, Trimethylol Ethane Esters, and Dipentaerythritol Esters), Trimellitate Esters, Complex Esters, and Others], Lubricant Type (Synthetic Lubricants and Biobased Lubricants), Application [Engine Oil (MCO, PCMO, HDEO, and Other Engines), Compressor Oil, (Refrigeration, Air Compressors, Natural Gas Compressors, and Others Compressors), Hydraulic Fluids, Gear Oil, Transmission Oil, Coolants, and Others], and End Use [Automotive (Conventional Vehicles and Electric Vehicles), Textile, Marine, Mining and Metallurgy, Aviation, Energy and Power, and Others]
May 2021
Synthetic Ester Lubricants for the Telecommunications Market
Size and Forecast (2021 - 2031), Global and Regional Share, Trend, and Growth Opportunity Analysis Report Coverage: By Product Type (Gear Oil, Transformer Oil, Immersion Cooling Fluids, Refrigeration Oil, and Grease), End Use (Data Centers, Telecommunication Infrastructure, and Others), and Geography (North America, Europe, Asia Pacific, Middle East and Africa, and South and Central America
May 2021
Synthetic Ester Lubricants for Electrical and Electronics Market
Size and Forecast (2021 - 2031), Global and Regional Share, Trend, and Growth Opportunity Analysis Report Coverage: By Product Type (Gear Oil, Transformer Oil, Immersion Cooling Fluids, Refrigeration Oil, Grease, Metalworking Fluids, and Others) and End Use (General Air Conditioners, Automotive Air Conditioners, Refrigerators, and Others)
May 2021
Synthetic Ester Lubricants for Construction Market
Size and Forecast (2021 - 2031), Global and Regional Share, Trend, and Growth Opportunity Analysis Report Coverage: By Product Type (Engine Oil, Hydraulic Oil, Gear Oil, Grease, Turbine Oil, Metalworking Fluids, and Others) and End Use (Construction Machinery, Concrete and Construction Tools, Wire Ropes and Chains, and Others)
May 2021
Synthetic Ester Lubricants for Energy and Power Market
Size and Forecast (2021 - 2031), Global and Regional Share, Trend, and Growth Opportunity Analysis Report Coverage: By Product Type (Engine Oil, Hydraulic Oil, Gear Oil, Transformer Oil, Immersion Cooling Fluids, Refrigeration Oil, Grease, Turbine Oil, Metalworking Fluids, and Others) and End Use (River Dam, Offshore Wind Power, Energy Storage Systems, and Others)
 Get Free Sample For