Asia Pacific Microfluidics Market Key Players and Opportunities by 2027
Asia Pacific Microfluidics Market Forecast to 2027 - COVID-19 Impact and Regional Analysis by Product (Microfluidic Chips, Microfluidic Sensors, Devices , Micropumps, Microneedles and Other Products), Material (PDMS, Polymers, Glass, Silicon, and Other Materials), Application (In Vitro Diagnostics, Pharmaceutical and Life Science Research, Drug Discovery, and Other Applications); and Country
- Report Date : Aug 2020
- Report Code : TIPRE00013011
- Category : Life Sciences
- Status : Published
- Available Report Formats :


- No. of Pages : 173
The Asia Pacific microfluidics market was valued at US$ 2,294.22 million in 2019 and is projected to reach US$ 8,788.24 million by 2027; it is expected to grow at a CAGR of 18.6% during 2020–2027.
The growth of the microfluidics market is mainly attributed to the factors such as application of microfluidics technologies in point-of-care testing, and technological development in microfluidics products are expected to propel the growth of the market. However, lower adoption in emerging economies is the major factor hindering the market growth..
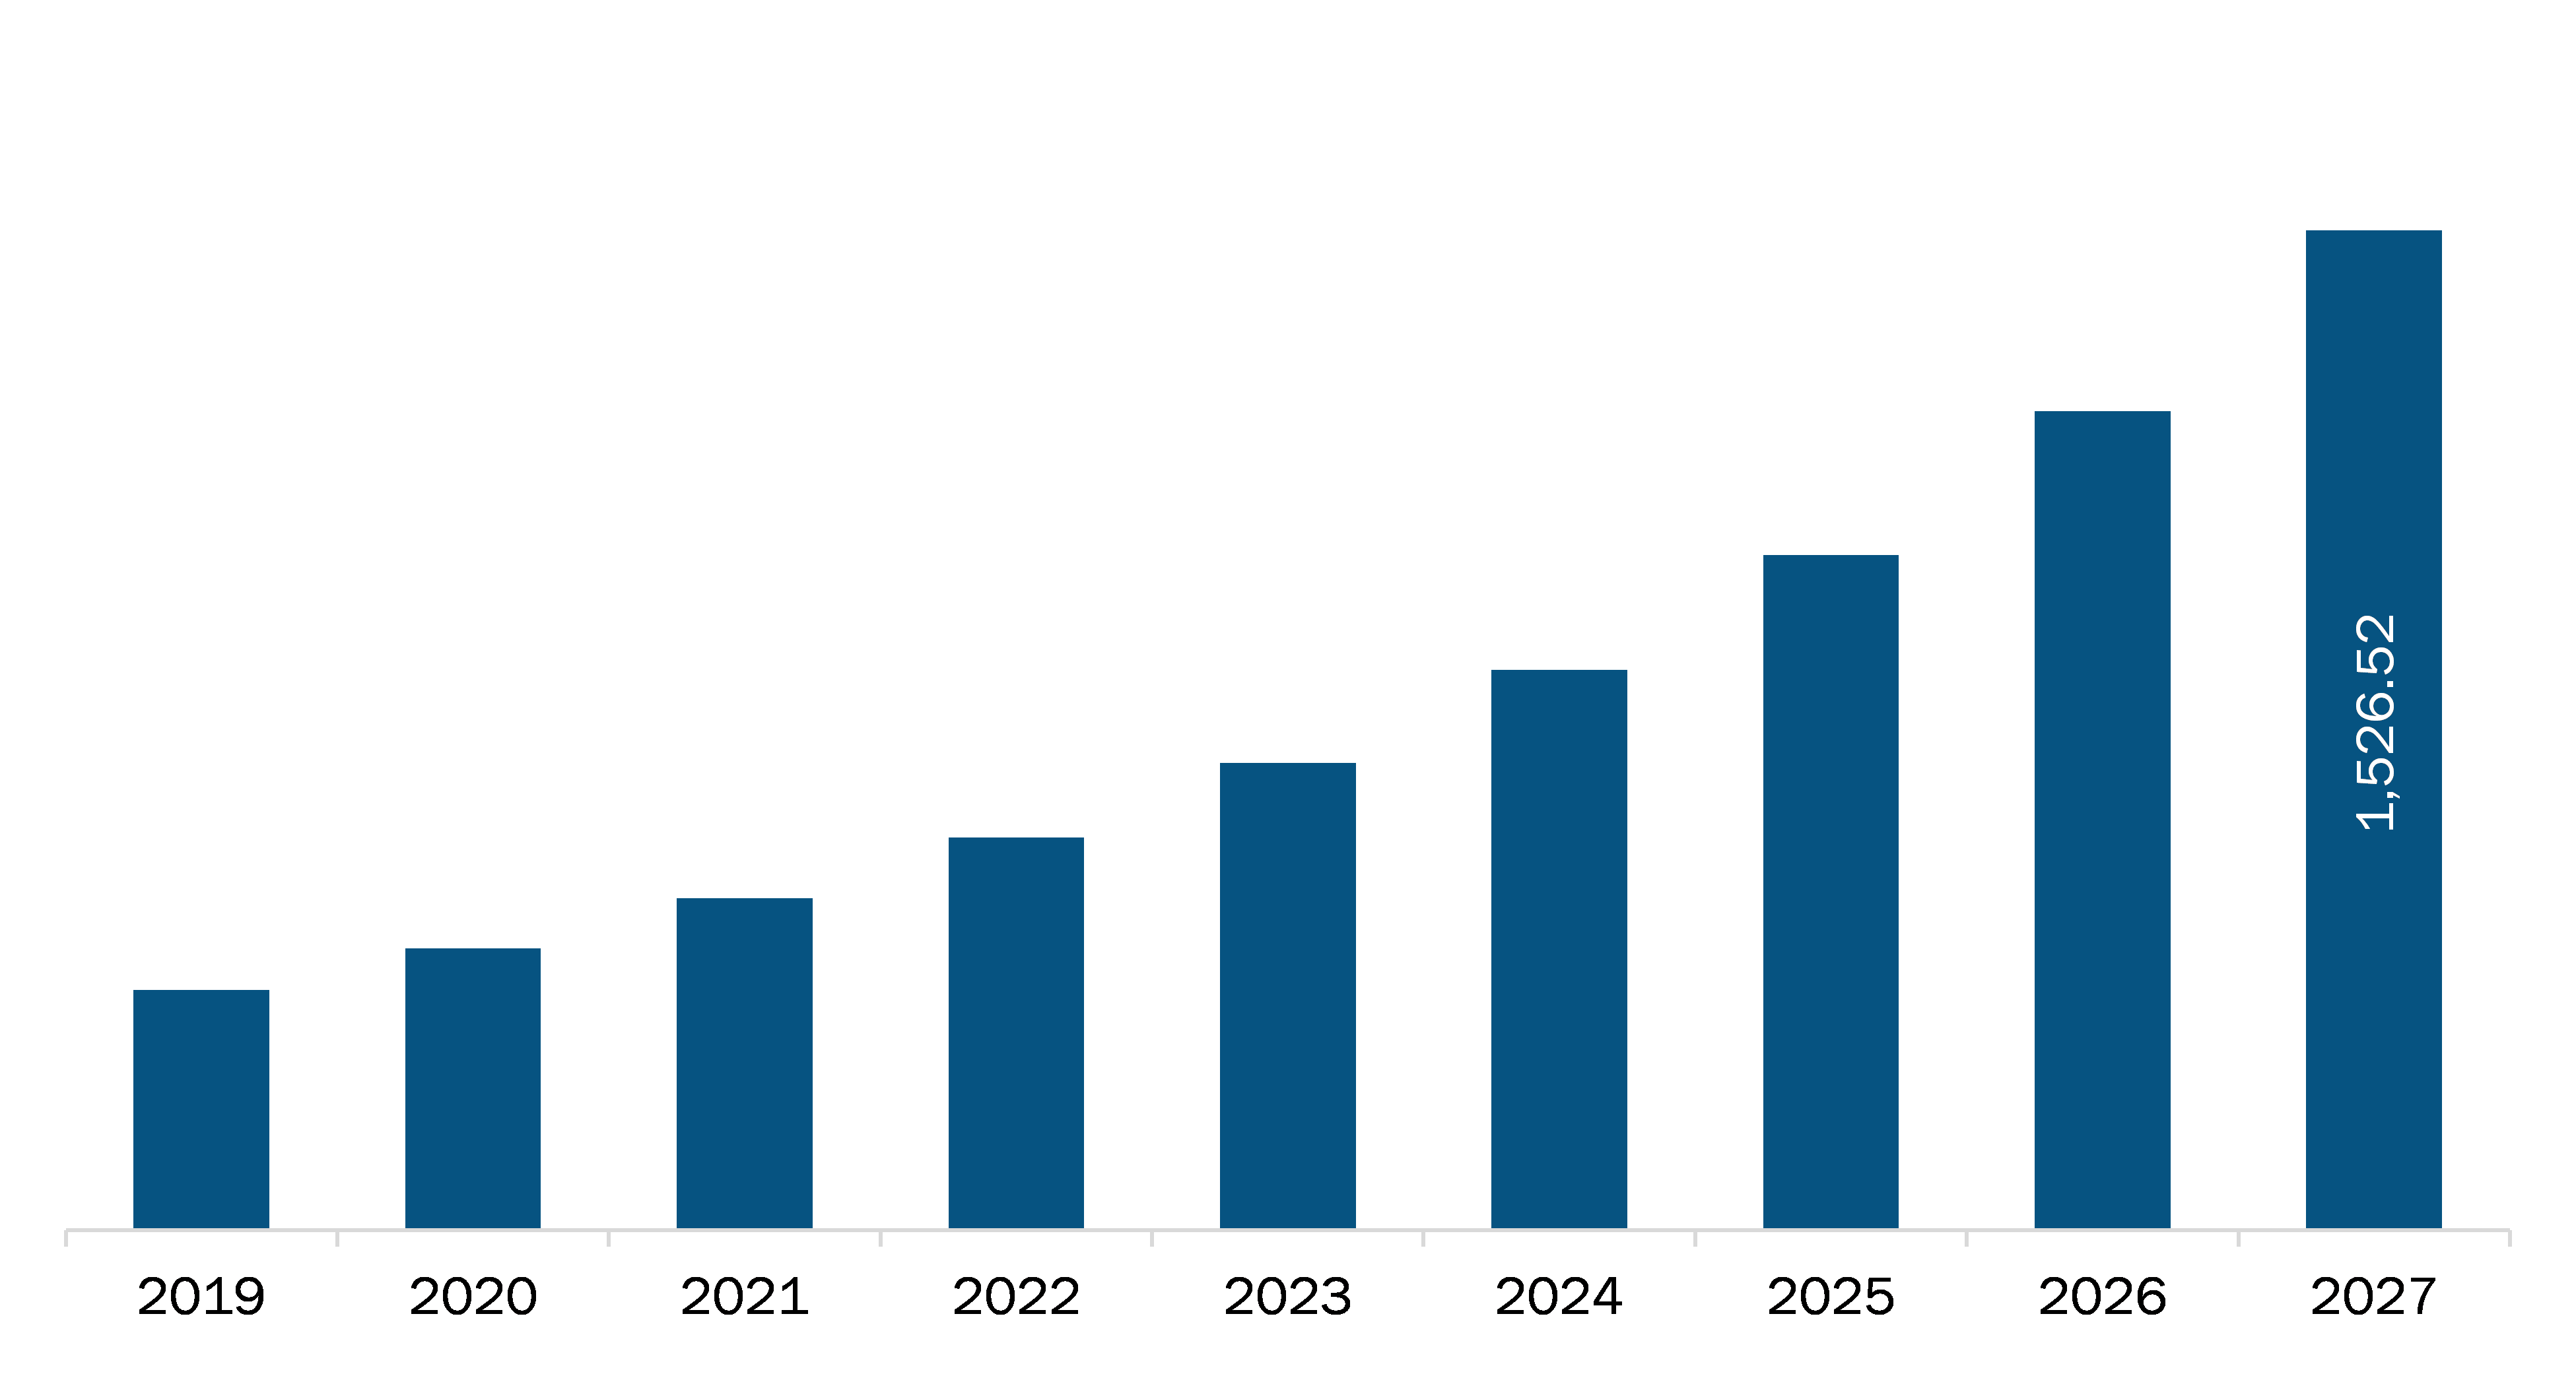
The India has observed the fastest growth in the Asia Pacific micro fluidics market within the past few years and is expected to lead the market in Asia Pacific during the forecast period. The rising innovation through market players is a significant factor that is contributing to the growth of the market in India. For instance, a Bengaluru-based biotech start-up Achira Labs has hit the market in 2016 with its product, Acix 100. Achira Labs is a pioneering Indian technology company, which has strong expertise in developing microfluidics-based solutions for in vitro diagnostics. Also, Hyderabad-based Theranosis Life Sciences Pvt Ltd is focusing on a type of liquid biopsy that used to detect the live cancer cells in blood circulation. The company’s innovative microfluidics lab-on-a-chip technology-enabled to capture the circulating tumor cells (CTCs) in peripheral blood.
India Microfluidics Market Revenue and Forecast to 2027 (US$ Million)
- Sample PDF showcases the content structure and the nature of the information with qualitative and quantitative analysis.
- Request discounts available for Start-Ups & Universities
- Sample PDF showcases the content structure and the nature of the information with qualitative and quantitative analysis.
- Request discounts available for Start-Ups & Universities
ASIA PACIFIC MICROFLUIDICS – MARKET SEGMENTATION
Microfluidics Market – By Product
- Devices
- Microfluidic Chips
- Microfluidic Sensors
- Micropumps
- Microneedles
- Other Products
Microfluidics Market – By Material
- PDMS
- Glass
- Silicon
- Polymer
- Other Materials
Microfluidics Market – By Application
- In Vitro Diagnostics
- Point-of-Care Testing
- Clinical Diagnostics
- Pharmaceutical and Life Science Research
- Drug Discovery
- Other Applications
By Country
- China
- Japan
- India
- South Korea
- Australia
Company Profiles
- Agilent Technologies, Inc.,
- BD
- Bio-Rad Laboratories Inc.
- Danaher
- Dolomite Microfluidics (Blacktrace Holdings Ltd.)
- Fludigm Corporation
- Illumina, Inc.
- microfluidic ChipShop GmbH,
- Perkin Elmer, Inc.
- Thermo Fisher Scientific Inc.

Report Coverage
Revenue forecast, Company Analysis, Industry landscape, Growth factors, and Trends

Segment Covered
Product, Material, Application, and Country

Regional Scope
North America, Europe, Asia Pacific, Middle East & Africa, South & Central America

Country Scope
Australia, China, Japan, South Korea
1. Introduction
1.1 Scope of the Study
1.2 The Insight Partners Research Report Guidance
1.3 Market Segmentation
1.3.1 Asia Pacific Microfluidics Market – By Product
1.3.2 Asia Pacific Microfluidics Market – By Material
1.3.3 Asia Pacific Microfluidics Market – By Application
1.3.4 Asia Pacific Microfluidics Market– By Region
2. Microfluidics Market – Key Takeaways
3. Research Methodology
3.1 Coverage
3.2 Secondary Research
3.3 Primary Research
4. Microfluidics – Market Landscape
4.1 Overview
4.2 PEST Analysis
4.2.1 Asia Pacific
4.3 Expert Opinion
5. Asia Pacific Microfluidics Market – Industry Dynamics
5.1 Market Drivers
5.1.1 Application of Microfluidics Technologies in Point-Of-Care Testing
5.1.2 Technological Development in Microfluidics Product
5.2 Market Restraints
5.2.1 Lower Adoption in Emerging Economies
5.3 Market Opportunities
5.3.1 Increasing Application of Microfluidics in Drug Discovery
5.4 Future Trends
5.4.1 3D Printing in Microfluidics
5.5 Impact Analysis
6. Microfluidics Market – Regional Analysis
6.1 Asia Pacific Microfluidics Market Revenue Forecast And Analysis
7. Asia Pacific Microfluidics Market Analysis – By Product Type
7.1 Overview
7.2 Microfluidics Market Revenue Share, by Product (2019 and 2027)
7.3 Microfluidic Chips
7.3.1 Overview
7.3.2 Microfluidic Chips: Microfluidics Market – Revenue and Forecast to 2027 (US$ Million)
7.4 Microfluidic Sensors
7.4.1 Overview
7.4.2 Microfluidic Sensors: Microfluidics Market – Revenue and Forecast to 2027 (US$ Million)
7.5 Micropumps
7.5.1 Overview
7.5.2 Micropumps: Microfluidics Market – Revenue and Forecast to 2027 (US$ Million)
7.6 Microneedles
7.6.1 Overview
7.6.2 Microneedles: Microfluidics Market – Revenue and Forecast to 2027 (US$ Million)
7.7 Devices
7.7.1 Overview
7.7.2 Devices: Microfluidics Market – Revenue and Forecast to 2027 (US$ Million)
7.8 Other Products
7.8.1 Overview
7.8.2 Other Products: Microfluidics Market – Revenue and Forecast to 2027 (US$ Million)
8. Microfluidics Market Analysis, by Material
8.1 Overview
8.2 Microfluidics Market Revenue Share, by Material (2019 and 2027)
8.3 Polymers
8.3.1 Overview
8.3.2 Polymers: Microfluidics Market – Revenue and Forecast to 2027 (US$ Million)
8.4 Glass
8.4.1 Overview
8.4.2 Glass: Microfluidics Market – Revenue and Forecast to 2027 (US$ Million)
8.5 Silicon
8.5.1 Overview
8.5.2 Silicon: Microfluidics Market – Revenue and Forecast to 2027 (US$ Million)
8.6 PDMS (Polydimethylsiloxane)
8.6.1 Overview
8.6.2 PDMS (Polydimethylsiloxane): Microfluidics Market – Revenue and Forecast to 2027 (US$ Million)
8.7 Other Materials
8.7.1 Overview
8.7.2 Other Materials: Microfluidics Market – Revenue and Forecast to 2027 (US$ Million)
9. Microfluidics Market Analysis, by Application
9.1 Overview
9.2 Microfluidics Market Revenue Share, by Application (2019 and 2027)
9.3 In Vitro Diagnostics
9.3.1 Overview
9.3.2 In Vitro Diagnostics: Microfluidics Market – Revenue and Forecast to 2027 (US$ Million)
9.3.3 Point-of-Care Testing
9.3.3.1 Overview
9.3.3.2 Point of Care Testing (POCT) Market: Microfluidics Market– Revenue and Forecast to 2027 (US$ Million)
9.3.4 Clinical Diagnostics
9.3.4.1 Overview
9.3.4.2 Clinical Diagnostics: Microfluidics Market– Revenue and Forecast to 2027 (US$ Million)
9.4 Pharmaceutical and Life Science Research
9.4.1 Overview
9.4.2 Pharmaceutical and Life Science Research: Microfluidics Market – Revenue and Forecast to 2027 (US$ Million)
9.5 Drug Discovery
9.5.1 Overview
9.5.2 Drug Discovery: Microfluidics Market – Revenue and Forecast to 2027 (US$ Million)
9.6 Other Applications
9.6.1 Overview
9.6.2 Other Applications: Microfluidics Market – Revenue and Forecast to 2027 (US$ Million)
10. Microfluidics Market – Geographic Analysis
10.1 Asia Pacific: Microfluidics Market
10.1.1 Overview
10.1.2 Asia Pacific: Microfluidics Market - Revenue and Forecast to 2027 (USD Million)
10.1.3 Asia Pacific: Microfluidics Market, by Product, 2018–2027 (USD Million)
10.1.4 Asia Pacific: Microfluidics Market, by Material, 2018–2027 (USD Million)
10.1.5 Asia Pacific: Microfluidics Market, by Application, 2018–2027 (USD Million)
10.1.5.1 Asia Pacific: Microfluidics Market, by In Vitro Diagnostics, 2018–2027 (USD Million)
10.1.6 Asia Pacific: Microfluidics Market, by Country, 2019 & 2027 (%)
10.1.7 China: Microfluidics Market – Revenue and Forecast to 2027 (USD Million)
10.1.7.1 China: Microfluidics Market – Revenue and Forecast to 2027 (USD Million)
10.1.7.2 China: Microfluidics Market, by Product, 2018–2027 (USD Million)
10.1.7.3 China: Microfluidics Market, by Material, 2018–2027 (USD Million)
10.1.7.4 China: Microfluidics Market, by Application, 2018–2027 (USD Million)
10.1.7.4.1 China: Microfluidics Market, by In Vitro Diagnostics, 2018–2027 (USD Million)
10.1.8 Japan: Microfluidics Market – Revenue and Forecast to 2027 (USD Million)
10.1.8.1 Japan: Microfluidics Market – Revenue and Forecast to 2027 (USD Million)
10.1.8.2 Japan: Microfluidics Market, by Product, 2018–2027 (USD Million)
10.1.8.3 Japan: Microfluidics Market, by Material, 2018–2027 (USD Million)
10.1.8.4 Japan: Microfluidics Market, by Application, 2018–2027 (USD Million)
10.1.8.4.1 Japan: Microfluidics Market, by In Vitro Diagnostics, 2018–2027 (USD Million)
10.1.9 India: Microfluidics Market – Revenue and Forecast to 2027 (USD Million)
10.1.9.1 India: Microfluidics Market – Revenue and Forecast to 2027 (USD Million)
10.1.9.2 India: Microfluidics Market, by Product, 2018–2027 (USD Million)
10.1.9.3 India: Microfluidics Market, by Material, 2018–2027 (USD Million)
10.1.9.4 India: Microfluidics Market, by Application, 2018–2027 (USD Million)
10.1.9.4.1 India: Microfluidics Market, by In Vitro Diagnostics, 2018–2027 (USD Million)
10.1.10 South Korea: Microfluidics Market – Revenue and Forecast to 2027 (USD Million)
10.1.10.1 South Korea: Microfluidics Market – Revenue and Forecast to 2027 (USD Million)
10.1.10.2 South Korea: Microfluidics Market, by Product, 2018–2027 (USD Million)
10.1.10.3 South Korea: Microfluidics Market, by Material, 2018–2027 (USD Million)
10.1.10.4 South Korea: Microfluidics Market, by Application, 2018–2027 (USD Million)
10.1.10.4.1 South Korea: Microfluidics Market, by In Vitro Diagnostics, 2018–2027 (USD Million)
10.1.11 Australia: Microfluidics Market – Revenue and Forecast to 2027 (USD Million)
10.1.11.1 Australia: Microfluidics Market – Revenue and Forecast to 2027 (USD Million)
10.1.11.2 Australia: Microfluidics Market, by Product, 2018–2027 (USD Million)
10.1.11.3 Australia: Microfluidics Market, by Material, 2018–2027 (USD Million)
10.1.11.4 Australia: Microfluidics Market, by Application, 2018–2027 (USD Million)
10.1.11.4.1 Australia: Microfluidics Market, by In Vitro Diagnostics, 2018–2027 (USD Million)
11. Impact Of COVID-19 Pandemic On Asia Pacific Microfluidics Market
12. Company Profiles
12.1 Danaher
12.1.1 Key Facts
12.1.2 Business Description
12.1.3 Products and Services
12.1.4 Financial Overview
12.1.5 SWOT Analysis
12.1.6 Key Developments
12.2 Thermo Fisher Scientific Inc.
12.2.1 Key Facts
12.2.2 Business Description
12.2.3 Products and Services
12.2.4 Financial Overview
12.2.5 SWOT Analysis
12.2.6 Key Developments
12.3 Perkin Elmer, Inc.
12.3.1 Key Facts
12.3.2 Business Description
12.3.3 Products and Services
12.3.4 Financial Overview
12.3.5 SWOT Analysis
12.3.6 Key Developments
12.5 BIO-RAD LABORATORIES INC.
12.5.1 Key Facts
12.5.2 Business Description
12.5.3 Products and Services
12.5.4 Financial Overview
12.5.5 SWOT Analysis
12.5.6 Key Developments
12.6 Agilent Technologies, Inc.
12.6.1 Key Facts
12.6.2 Business Description
12.6.3 Products and Services
12.6.4 Financial Overview
12.6.5 SWOT Analysis
12.6.6 Key Developments
12.7 Fludigm Corporation
12.7.1 Key Facts
12.7.2 Business Description
12.7.3 Products and Services
12.7.4 Financial Overview
12.7.5 SWOT Analysis
12.7.6 Key Developments
12.8 Illumina, Inc.
12.8.1 Key Facts
12.8.2 Business Description
12.8.3 Products and Services
12.8.4 Financial Overview
12.8.5 SWOT Analysis
12.8.6 Key Developments
12.9 BD
12.9.1 Key Facts
12.9.2 Business Description
12.9.3 Products and Services
12.9.4 Financial Overview
12.9.5 SWOT Analysis
12.9.6 Key Developments
13. Appendix
LIST OF TABLES
Table 1. Asia Pacific Microfluidics Market, by Product – Revenue and Forecast to 2027 (USD Million)
Table 2. Asia Pacific Microfluidics Market, by Material – Revenue and Forecast to 2027 (USD Million)
Table 3. Asia Pacific Microfluidics Market, by Application – Revenue and Forecast to 2027 (USD Million)
Table 4. Asia Pacific Microfluidics Market, by In Vitro Diagnostics– Revenue and Forecast to 2027 (USD Million)
Table 5. China Microfluidics Market, by Product – Revenue and Forecast to 2027 (USD Million)
Table 6. China Microfluidics Market, by Material – Revenue and Forecast to 2027 (USD Million)
Table 7. China Microfluidics Market, by Application – Revenue and Forecast to 2027 (USD Million)
Table 8. China Microfluidics Market, by In Vitro Diagnostics– Revenue and Forecast to 2027 (USD Million)
Table 9. Japan Microfluidics Market, by Product – Revenue and Forecast to 2027 (USD Million)
Table 10. Japan Microfluidics Market, by Material – Revenue and Forecast to 2027 (USD Million)
Table 11. Japan Microfluidics Market, by Application – Revenue and Forecast to 2027 (USD Million)
Table 12. Japan Microfluidics Market, by In Vitro Diagnostics– Revenue and Forecast to 2027 (USD Million)
Table 13. India Microfluidics Market, by Product – Revenue and Forecast to 2027 (USD Million)
Table 14. India Microfluidics Market, by Material – Revenue and Forecast to 2027 (USD Million)
Table 15. India Microfluidics Market, by Application – Revenue and Forecast to 2027 (USD Million)
Table 16. India Microfluidics Market, by In Vitro Diagnostics– Revenue and Forecast to 2027 (USD Million)
Table 17. South Korea Microfluidics Market, by Product – Revenue and Forecast to 2027 (USD Million)
Table 18. South Korea Microfluidics Market, by Material – Revenue and Forecast to 2027 (USD Million)
Table 19. South Korea Microfluidics Market, by Application – Revenue and Forecast to 2027 (USD Million)
Table 20. South Korea Microfluidics Market, by In Vitro Diagnostics– Revenue and Forecast to 2027 (USD Million)
Table 21. Australia Microfluidics Market, by Product – Revenue and Forecast to 2027 (USD Million)
Table 22. Australia Microfluidics Market, by Material – Revenue and Forecast to 2027 (USD Million)
Table 23. Australia Microfluidics Market, by Application – Revenue and Forecast to 2027 (USD Million)
Table 24. Australia Microfluidics Market, by In Vitro Diagnostics– Revenue and Forecast to 2027 (USD Million)
Table 25. Glossary of Terms, Microfluidics Market
LIST OF FIGURES
Figure 1. Microfluidics Market Segmentation
Figure 2. Microfluidics Segmentation – By Region
Figure 3. Asia Pacific Microfluidics Market Overview
Figure 4. Devices Segment Held Largest Share of Microfluidics Market
Figure 5. Microfluidics Market in India to Show Remarkable Growth During Forecast Period
Figure 6. Asia Pacific Microfluidics Market- Leading Country Markets (US$ Million)
Figure 8. Asia Pacific PEST Analysis
Figure 9. Microfluidics Market Impact Analysis of Driver and Restraints
Figure 10. Asia Pacific Microfluidics Market – Revenue Forecast And Analysis – 2019- 2027
Figure 11. Microfluidics Market Revenue Share, by Product (2019 and 2027)
Figure 12. Microfluidic Chips: Microfluidics Market – Revenue and Forecast to 2027 (US$ Million)
Figure 13. Microfluidic Sensors: Microfluidics Market – Revenue and Forecast to 2027 (US$ Million)
Figure 14. Micropumps: Microfluidics Market – Revenue and Forecast to 2027 (US$ Million)
Figure 15. Microneedles: Microfluidics Market – Revenue and Forecast to 2027 (US$ Million)
Figure 16. Devices: Microfluidics Market – Revenue and Forecast to 2027 (US$ Million)
Figure 17. Other Products: Microfluidics Market – Revenue and Forecast to 2027 (US$ Million)
Figure 18. Microfluidics Market Revenue Share, by Material (2019 and 2027)
Figure 19. Polymers: Microfluidics Market – Revenue and Forecast to 2027 (US$ Million)
Figure 20. Glass: Microfluidics Market – Revenue and Forecast to 2027 (US$ Million)
Figure 21. Silicon: Microfluidics Market – Revenue and Forecast to 2027 (US$ Million)
Figure 22. PDMS (Polydimethylsiloxane): Microfluidics Market – Revenue and Forecast to 2027 (US$ Million)
Figure 23. Other Materials : Microfluidics Market – Revenue and Forecast to 2027 (US$ Million)
Figure 24. Microfluidics Market Revenue Share, by Application (2019 and 2027)
Figure 25. In Vitro Diagnostics: Microfluidics Market – Revenue and Forecast to 2027 (US$ Million)
Figure 26. Point of Care Testing (POCT) Market: Microfluidics Market– Revenue and Forecast to 2027 (US$ Million)
Figure 27. Clinical Diagnostics: Market: Microfluidics Market– Revenue and Forecast to 2027 (US$ Million)
Figure 28. Pharmaceutical and Life Science Research : Microfluidics Market – Revenue and Forecast to 2027 (US$ Million)
Figure 29. Drug Discovery : Microfluidics Market – Revenue and Forecast to 2027 (US$ Million)
Figure 30. Other Applications: Microfluidics Market – Revenue and Forecast to 2027 (US$ Million)
Figure 31. Asia Pacific: Microfluidics Market, by Key Country – Revenue (2019) (USD Million)
Figure 32. Asia Pacific Microfluidics Market Revenue and Forecast to 2027 (USD Million)
Figure 33. Asia Pacific: Microfluidics Market, by Country, 2019 & 2027 (%)
Figure 34. China: Microfluidics Market – Revenue and Forecast to 2027 (USD Million)
Figure 35. Japan: Microfluidics Market – Revenue and Forecast to 2027 (USD Million)
Figure 36. India: Microfluidics Market – Revenue and Forecast to 2027 (USD Million)
Figure 37. South Korea: Microfluidics Market – Revenue and Forecast to 2027 (USD Million)
Figure 38. Australia: Microfluidics Market – Revenue and Forecast to 2027 (USD Million)
Figure 39. Impact of COVID-19 Pandemic on Microfluidics Market in Asia Pacific Countries
Yes! We provide a free sample of the report, which includes Report Scope (Table of Contents), report structure, and selected insights to help you assess the value of the full report. Please click on the "Download Sample" button or contact us to receive your copy.
Absolutely - analyst assistance is part of the package. You can connect with our analyst post-purchase to clarify report insights, methodology or discuss how the findings apply to your business needs.
Once your order is successfully placed, you will receive a confirmation email along with your invoice.
• For published reports: You'll receive access to the report within 4-6 working hours via a secured email sent to your email.
• For upcoming reports: Your order will be recorded as a pre-booking. Our team will share the estimated release date and keep you informed of any updates. As soon as the report is published, it will be delivered to your registered email.
We offer customization options to align the report with your specific objectives. Whether you need deeper insights into a particular region, industry segment, competitor analysis, or data cut, our research team can tailor the report accordingly. Please share your requirements with us, and we'll be happy to provide a customized proposal or scope.
The report is available in either PDF format or as an Excel dataset, depending on the license you choose.
The PDF version provides the full analysis and visuals in a ready-to-read format. The Excel dataset includes all underlying data tables for easy manipulation and further analysis.
Please review the license options at checkout or contact us to confirm which formats are included with your purchase.
Our payment process is fully secure and PCI-DSS compliant.
We use trusted and encrypted payment gateways to ensure that all transactions are protected with industry-standard SSL encryption. Your payment details are never stored on our servers and are handled securely by certified third-party processors.
You can make your purchase with confidence, knowing your personal and financial information is safe with us.
Yes, we do offer special pricing for bulk purchases.
If you're interested in purchasing multiple reports, we're happy to provide a customized bundle offer or volume-based discount tailored to your needs. Please contact our sales team with the list of reports you're considering, and we'll share a personalized quote.
Yes, absolutely.
Our team is available to help you make an informed decision. Whether you have questions about the report's scope, methodology, customization options, or which license suits you best, we're here to assist. Please reach out to us at sales@theinsightpartners.com, and one of our representatives will get in touch promptly.
Yes, a billing invoice will be automatically generated and sent to your registered email upon successful completion of your purchase.
If you need the invoice in a specific format or require additional details (such as company name, GST, or VAT information), feel free to contact us, and we'll be happy to assist.
Yes, certainly.
If you encounter any difficulties accessing or receiving your report, our support team is ready to assist you. Simply reach out to us via email or live chat with your order information, and we'll ensure the issue is resolved quickly so you can access your report without interruption.
The Insight Partners performs research in 4 major stages: Data Collection & Secondary Research, Primary Research, Data Analysis and Data Triangulation & Final Review.
- Data Collection and Secondary Research:
As a market research and consulting firm operating from a decade, we have published many reports and advised several clients across the globe. First step for any study will start with an assessment of currently available data and insights from existing reports. Further, historical and current market information is collected from Investor Presentations, Annual Reports, SEC Filings, etc., and other information related to company’s performance and market positioning are gathered from Paid Databases (Factiva, Hoovers, and Reuters) and various other publications available in public domain.
Several associations trade associates, technical forums, institutes, societies and organizations are accessed to gain technical as well as market related insights through their publications such as research papers, blogs and press releases related to the studies are referred to get cues about the market. Further, white papers, journals, magazines, and other news articles published in the last 3 years are scrutinized and analyzed to understand the current market trends.
- Primary Research:
The primarily interview analysis comprise of data obtained from industry participants interview and answers to survey questions gathered by in-house primary team.
For primary research, interviews are conducted with industry experts/CEOs/Marketing Managers/Sales Managers/VPs/Subject Matter Experts from both demand and supply side to get a 360-degree view of the market. The primary team conducts several interviews based on the complexity of the markets to understand the various market trends and dynamics which makes research more credible and precise.
A typical research interview fulfils the following functions:
- Provides first-hand information on the market size, market trends, growth trends, competitive landscape, and outlook
- Validates and strengthens in-house secondary research findings
- Develops the analysis team’s expertise and market understanding
Primary research involves email interactions and telephone interviews for each market, category, segment, and sub-segment across geographies. The participants who typically take part in such a process include, but are not limited to:
- Industry participants: VPs, business development managers, market intelligence managers and national sales managers
- Outside experts: Valuation experts, research analysts and key opinion leaders specializing in the electronics and semiconductor industry.
Below is the breakup of our primary respondents by company, designation, and region:

Once we receive the confirmation from primary research sources or primary respondents, we finalize the base year market estimation and forecast the data as per the macroeconomic and microeconomic factors assessed during data collection.
- Data Analysis:
Once data is validated through both secondary as well as primary respondents, we finalize the market estimations by hypothesis formulation and factor analysis at regional and country level.
- 3.1 Macro-Economic Factor Analysis:
We analyse macroeconomic indicators such the gross domestic product (GDP), increase in the demand for goods and services across industries, technological advancement, regional economic growth, governmental policies, the influence of COVID-19, PEST analysis, and other aspects. This analysis aids in setting benchmarks for various nations/regions and approximating market splits. Additionally, the general trend of the aforementioned components aid in determining the market's development possibilities.
- 3.2 Country Level Data:
Various factors that are especially aligned to the country are taken into account to determine the market size for a certain area and country, including the presence of vendors, such as headquarters and offices, the country's GDP, demand patterns, and industry growth. To comprehend the market dynamics for the nation, a number of growth variables, inhibitors, application areas, and current market trends are researched. The aforementioned elements aid in determining the country's overall market's growth potential.
- 3.3 Company Profile:
The “Table of Contents” is formulated by listing and analyzing more than 25 - 30 companies operating in the market ecosystem across geographies. However, we profile only 10 companies as a standard practice in our syndicate reports. These 10 companies comprise leading, emerging, and regional players. Nonetheless, our analysis is not restricted to the 10 listed companies, we also analyze other companies present in the market to develop a holistic view and understand the prevailing trends. The “Company Profiles” section in the report covers key facts, business description, products & services, financial information, SWOT analysis, and key developments. The financial information presented is extracted from the annual reports and official documents of the publicly listed companies. Upon collecting the information for the sections of respective companies, we verify them via various primary sources and then compile the data in respective company profiles. The company level information helps us in deriving the base number as well as in forecasting the market size.
- 3.4 Developing Base Number:
Aggregation of sales statistics (2020-2022) and macro-economic factor, and other secondary and primary research insights are utilized to arrive at base number and related market shares for 2022. The data gaps are identified in this step and relevant market data is analyzed, collected from paid primary interviews or databases. On finalizing the base year market size, forecasts are developed on the basis of macro-economic, industry and market growth factors and company level analysis.
- Data Triangulation and Final Review:
The market findings and base year market size calculations are validated from supply as well as demand side. Demand side validations are based on macro-economic factor analysis and benchmarks for respective regions and countries. In case of supply side validations, revenues of major companies are estimated (in case not available) based on industry benchmark, approximate number of employees, product portfolio, and primary interviews revenues are gathered. Further revenue from target product/service segment is assessed to avoid overshooting of market statistics. In case of heavy deviations between supply and demand side values, all thes steps are repeated to achieve synchronization.
We follow an iterative model, wherein we share our research findings with Subject Matter Experts (SME’s) and Key Opinion Leaders (KOLs) until consensus view of the market is not formulated – this model negates any drastic deviation in the opinions of experts. Only validated and universally acceptable research findings are quoted in our reports.
We have important check points that we use to validate our research findings – which we call – data triangulation, where we validate the information, we generate from secondary sources with primary interviews and then we re-validate with our internal data bases and Subject matter experts. This comprehensive model enables us to deliver high quality, reliable data in shortest possible time.

Aug 2020
MRI-guided Focused Ultrasound Therapy Market
Size and Forecast (2021 - 2034), Global and Regional Share, Trend, and Growth Opportunity Analysis Report Coverage: By Application (Breast Cancer, Prostate Cancer, Liver Cancer, Pancreatic Cancer, Breast Lifting and Aesthetic Application, Nipple and Areola Preservation, Post Surgical Applications, and Others), End User (Healthcare Facilities, Diagnostic Imaging Centers, and Research Centers), and Geography (North America, Europe, Asia Pacific, Middle East and Africa, and South and Central America)
Aug 2020
Gene Therapy CDMO Market
Size and Forecast (2021 - 2034), Global and Regional Share, Trend, and Growth Opportunity Analysis Report Coverage: By Service Type (Drug Development and Manufacturing, Testing and Regulatory Services, and Other Service Types), End User (Pharmaceutical Companies, Biopharmaceutical Companies, and Other End Users), and Geography (North America, Europe, Asia Pacific, Middle East and Africa, and South and Central America)
Aug 2020
RT-PCR Market
Size and Forecast (2021 - 2031), Global and Regional Share, Trend, and Growth Opportunity Analysis Report Coverage: By Product (Reagents & Consumables, Instruments, and Software & Services), Application (Research Application, Clinical Application, and Forensic Application), End user (Hospitals and Diagnostic Centers, Pharmaceutical and Biotechnology Companies, Research Laboratories and Academic Institutes, Forensic Laboratories, and Clinical Research Organizations)
Aug 2020
dPCR Market
Size and Forecast (2021 - 2031), Global and Regional Share, Trend, and Growth Opportunity Analysis Report Coverage: By Product (Reagents & Consumables, Instruments, and Software & Services), Application (Research Application, Clinical Application, and Forensic Application), End user (Hospitals and Diagnostic Centers, Pharmaceutical and Biotechnology Companies, Research Laboratories and Academic Institutes, Forensic Laboratories, and Clinical Research Organizations)
Aug 2020
Oscillometry Market
Size and Forecast (2021 - 2031), Global and Regional Share, Trend, and Growth Opportunity Analysis Report Coverage: By Product (Device and Accessories), Technology (Impulse Oscillometry, Forced Oscillation Technique, and Hybrid Oscillometry Devices), Application (Asthma, COPD, and Others), End User (Hospitals, Diagnostic Laboratories, and Others)
Aug 2020
Prenatal Testing Services Market
Size and Forecast (2021 - 2031), Global and Regional Share, Trend, and Growth Opportunity Analysis Report Coverage: By Diagnostic Type (Noninvasive and Invasive), Disease (Aneuploidy, Microdeletions, Structural Chromosomal Abnormalities, and Others), End User (Hospitals, Diagnostic Laboratories, Specialty Clinics, and Other End Users), and Geography (North America, Europe, Asia Pacific, Middle East and Africa, and South and Central America)
Aug 2020
Joint Resurfacing Devices Market
Size and Forecast (2021 - 2031), Global and Regional Share, Trend, and Growth Opportunity Analysis Report Coverage: By Type (Knee, Hip, Shoulder, Ankle, and Others), Material (Metal, Ceramic, and Others), End User (Hospitals, Orthopedic Clinics, Ambulatory Surgical Centers, and Others), and Geography (North America, Europe, Asia Pacific, Middle East & Africa, and South and Central America)
Aug 2020
Embolization Plugs Market
Size and Forecast (2021 - 2031), Global and Regional Share, Trend, and Growth Opportunity Analysis Report Coverage: By Application (Neurology, Peripheral Vascular Disease, Oncology, Urology, and Others), End User (Hospital, Ambulatory Centers, and Others), and Geography (North America, Europe, Asia Pacific, Middle East and Africa, and South and Central America)
 Get Free Sample For