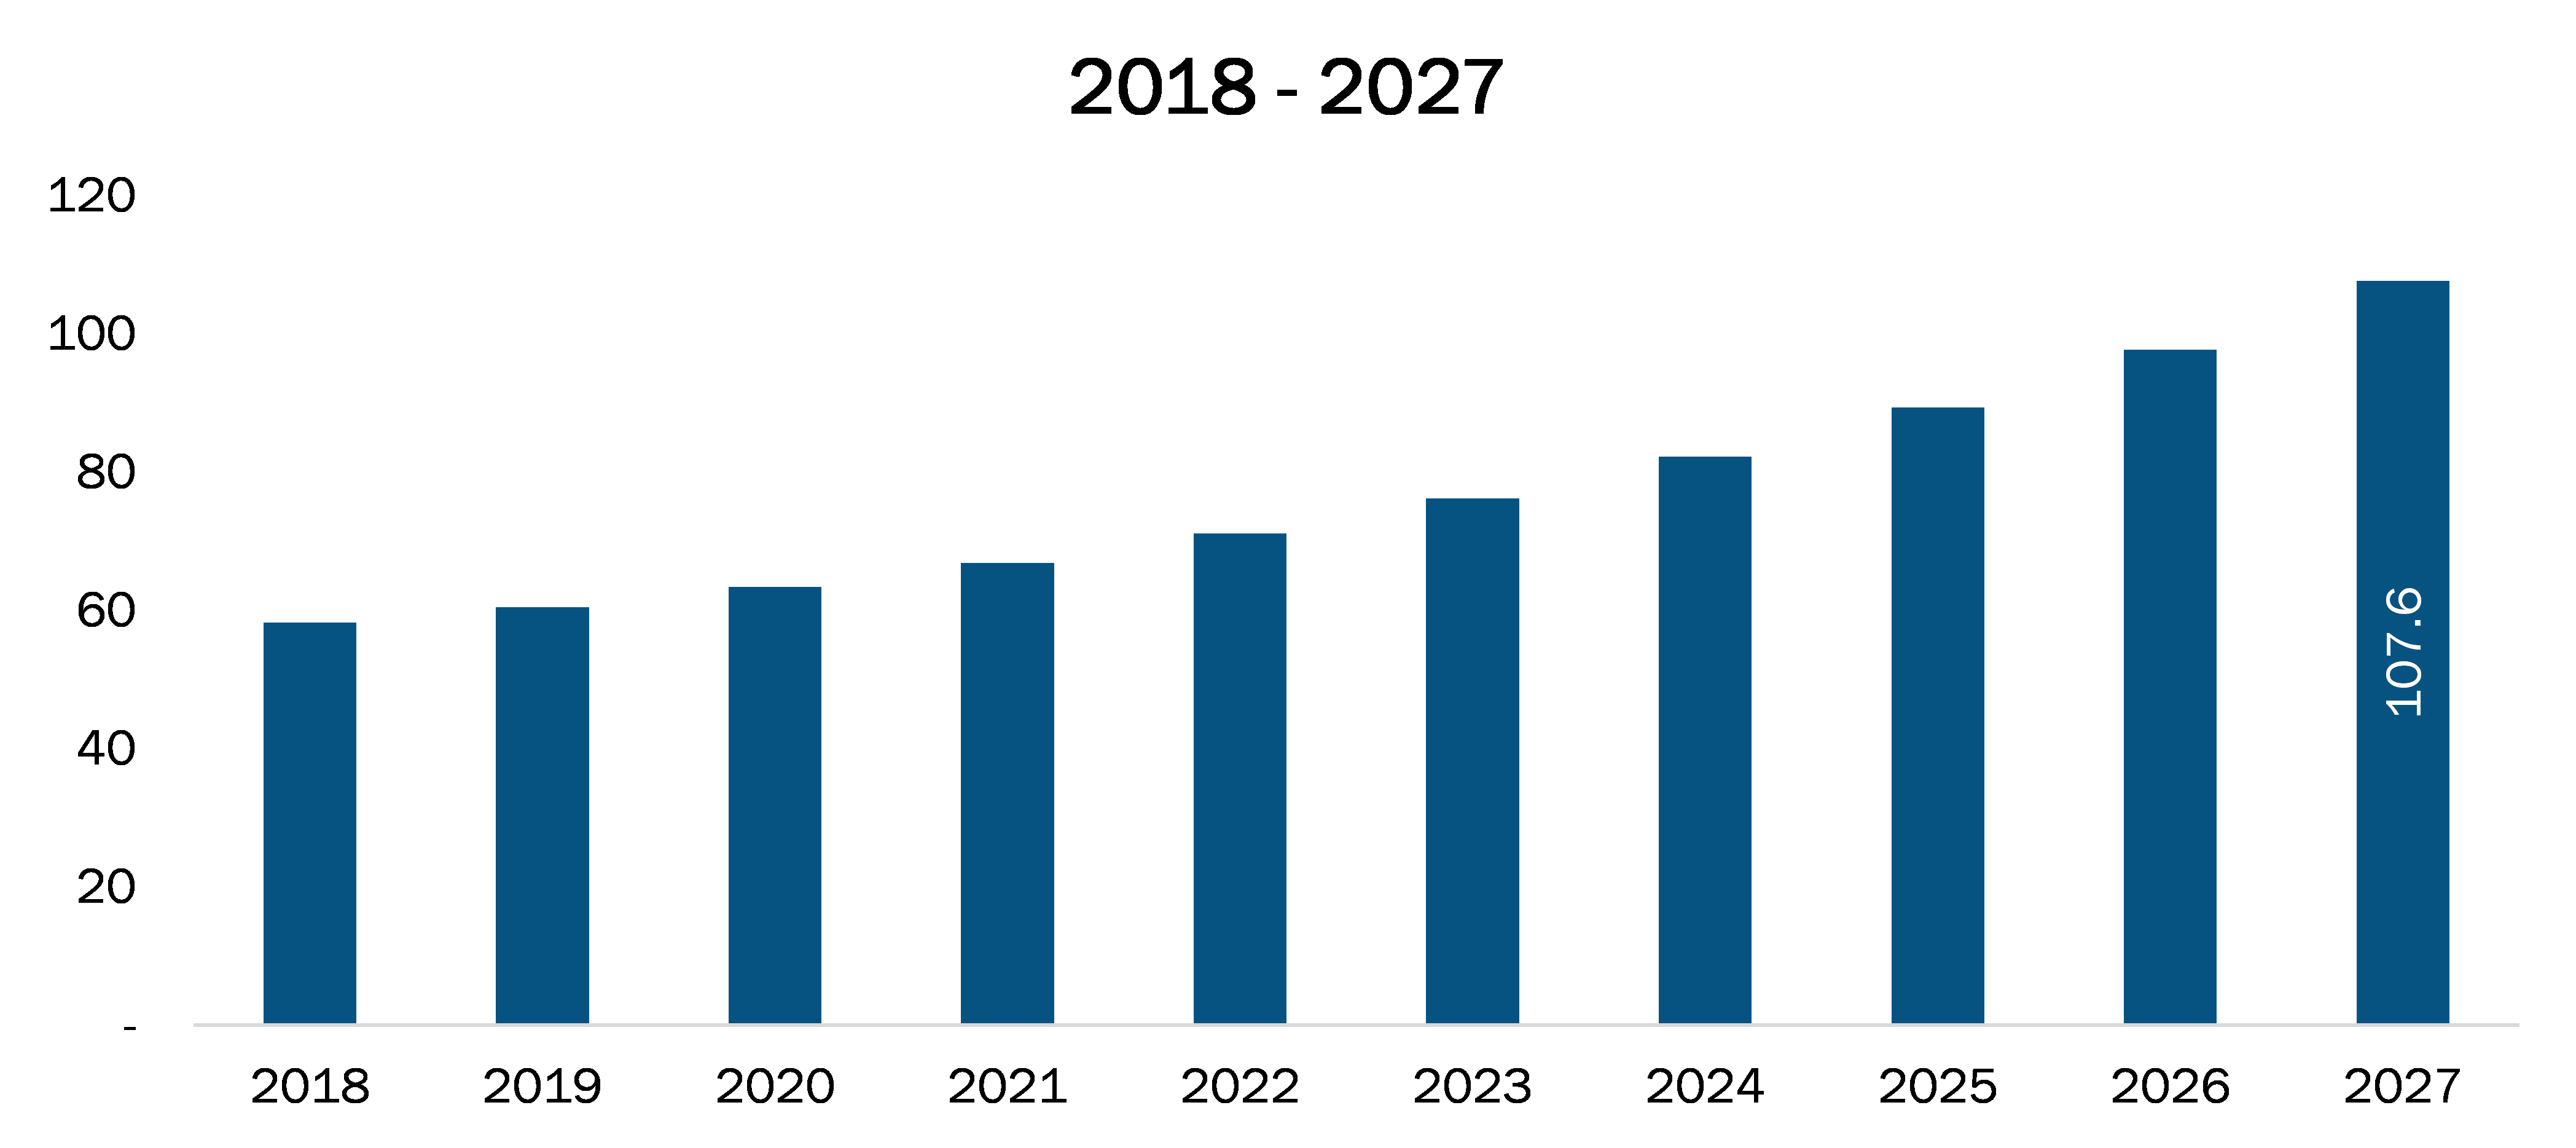
The Asia Pacific PACS and RIS market is expected to reach US$ 1,223.18 Mn in 2027 from US$ 628.83 Mn in 2018. The market is estimated to grow with a CAGR of 8.1% from 2019-2027.
The growth of the market is driven by the factors such as, increasing rate of obesity and growing ageing population in Asia Pacific. However, the market is likely to slower down its growth due to shortage of skilled workers in the region.
The high growth of the market is anticipated on account of the rising global geriatric population. In both males as well as females, the risk of cardiovascular diseases increases with increase in age. Increasing age makes the blood vessels less flexible and reduction in blood flow. Thus, the risk of heart disease is high in elder population. Also, according to the Heart Disease and Stroke Statistics 2018, average age at the first heart attack is 65.6 years for males and 72.0 years for females.
According to a report of United Nation (2017), in Asia approximately 549.2 million people were 60 years old or more and is estimated to reach 1273.2 million by 2050. Furthermore, the United Nations Population Fund also reported that the number of ageing people in the Asia-Pacific region is growing at an unprecedented rate. It also predicted that by 2050, one in four people in Asia Pacific region will be over 60 years old.
Japan is expected to lead the market in the Asia Pacific region owing to the rising prevalence of chronic diseases such as coronary diseases & cancer and increase in awareness regarding cancer in the country. Moreover, cancer has been the leading cause of deaths in Japan since various decades. Therefore, considering the above mentioned factors the growth of the market in the country is likely to contribute largest share in the Asia Pacific region during the forecast period.
Rest of Asia Pacific PACS and RIS Market Revenue and Forecasts to 2027 (US$ Mn)
- Sample PDF showcases the content structure and the nature of the information with qualitative and quantitative analysis.
- Request discounts available for Start-Ups & Universities
ASIA PACIFIC PACS AND RIS – MARKET SEGMENTATION
By Product
- Picture Archiving And Communication System (PACS)
- Dental PACS
- Cardiology PACS
- Oncology PACS
- Orthopedic PACS
- Others
- Radiology Information System (RIS)
By Component
- Hardware
- Software
- Services
By Deployment
- Web-Based
- On-Premise
- Cloud-Based
By End User
- Hospitals
- Diagnostic Centers
- Other End Users
By Geography
- Asia Pacific
- China
- Japan
- India
- Australia
- South Korea
Company Profiles
- McKesson Corporation
- General Electric
- Fujifilm Holdings Corporation
- Koninklijke Philips N.V.
- Siemens AG
- Cerner Corporation
- IBM
- Novarad
- Agfa-Gevaert Group
- INFINITT Healthcare Co., Ltd.

Report Coverage
Revenue forecast, Company Analysis, Industry landscape, Growth factors, and Trends

Segment Covered
Product, Component, Deployment, End User, and Country

Regional Scope
North America, Europe, Asia Pacific, Middle East & Africa, South & Central America

Country Scope
Australia, China, Japan, South Korea
1. Introduction
1.1 Scope of the Study
1.2 The Insight Partners Research Report Guidance
2. Asia Pacific PACS and RIS Market – Key Takeaways
3. Asia Pacific PACS and RIS Market – Market Landscape
3.1 Overview
3.2 Market Segmentation
3.2.1 Asia Pacific PACS and RIS Market – By Product
3.2.2 Asia Pacific PACS and RIS Market – By Component
3.2.3 Asia Pacific PACS and RIS Market – By Deployment
3.2.4 Asia Pacific PACS and RIS Market – By End User
3.2.5 Asia Pacific PACS and RIS Market – By Country
3.3 PEST Analysis
4. Asia Pacific PACS and RIS Market - Key Market Dynamics
4.1 Key Market Drivers
4.1.1 Increasing Rate of Obesity
4.1.2 Growing Ageing Population in Asia Pacific
4.2 Key Market Restraints
4.2.1 Shortage of Skilled Workers
4.3 Key Market Opportunities
4.3.1 Dental Tourism in Emerging Nations
4.4 Trend
4.4.1 Innovative Cloud-Based Practice Management Solutions
4.5 Impact Analysis
5. PACS and RIS Market – Asia Pacific Analysis
5.1 Asia Pacific PACS and RIS Market Revenue Forecasts And Analysis
5.2 Market Positioning
5.3 Company Share By Geography (2018)
6. Asia Pacific PACS and RIS Market Analysis – By Product
6.1 Overview
6.2 Asia Pacific PACS and RIS Market By Product, 2018 & 2027 (%)
6.3 Asia Pacific PACS and RIS Market Revenue And Forecasts to 2027, By Product (US$ Mn)
6.4 Picture Archive and Communication System (PACS) Market
6.4.1 Overview
6.4.2 Asia Pacific Picture Archive and Communication System (PACS) Market Revenue and Forecasts to 2027 (US$ Mn)
6.5 Radiology Information System (RIS) Market
6.5.1 Overview
6.5.2 Asia Pacific Radiology Information System (RIS) Market Revenue and Forecasts to 2027 (US$ Mn)
7. Asia Pacific PACS and RIS Market Analysis – By Component
7.1 Overview
7.2 Asia Pacific PACS and RIS Market, By Component, 2018 & 2027 (%)
7.3 Asia Pacific PACS and RIS Market Revenue And Forecasts to 2027, By Component (US$ Mn)
7.4 Software Market
7.4.1 Overview
7.4.2 Asia Pacific Software Market Revenue and Forecasts to 2027 (US$ Mn)
7.5 Hardware Market
7.5.1 Overview
7.5.2 Asia Pacific Hardware Market Revenue and Forecasts to 2027 (US$ Mn)
7.6 Services Market
7.6.1 Overview
7.6.2 Asia Pacific Services Market Revenue and Forecasts to 2027 (US$ Mn)
8. Global PACS and RIS Market Analysis– by Deployment
8.1 Overview
8.2 Asia Pacific PACS and RIS Market, By Deployment 2018 & 2027 (%)
8.3 Asia Pacific PACS and RIS Market Revenue And Forecasts to 2027, By Deployment (US$ Mn)
8.4 Web-Based Market
8.4.1 Overview
8.4.2 Asia Pacific Web-Based Market Revenue and Forecasts to 2027 (US$ Mn)
8.5 On-Premise Market
8.5.1 Overview
8.5.2 Asia Pacific On-Premise Market Revenue and Forecasts to 2027 (US$ Mn)
8.6 Cloud-Based Market
8.6.1 Overview
8.6.2 Asia Pacific Cloud-Based Market Revenue and Forecasts to 2027 (US$ Mn)
9. Asia Pacific PACS and RIS Market Analysis– by End User
9.1 Overview
9.2 Asia Pacific PACS and RIS Market, By End User 2018 & 2027 (%)
9.3 Asia Pacific PACS and RIS Market Revenue And Forecasts to 2027, By End User (US$ Mn)
9.4 Hospitals Market
9.4.1 Overview
9.4.2 Asia Pacific Hospitals Market Revenue and Forecasts to 2027 (US$ Mn)
9.5 Diagnostic Centers Market
9.5.1 Overview
9.5.2 Asia Pacific Diagnostic Centers Market Revenue and Forecasts to 2027 (US$ Mn)
9.6 Others Market
9.6.1 Overview
9.6.2 Asia Pacific Others Market Revenue and Forecasts to 2027 (US$ Mn)
10. Asia Pacific PACS and RIS Market Revenue and Forecasts To 2027
10.1 Overview
10.2 Asia Pacific PACS and RIS Market Revenue And Forecasts to 2027 (US$ Mn)
10.3 Asia Pacific PACS and RIS Market Revenue And Forecasts to 2027, By Product (US$ Mn)
10.4 Asia Pacific PACS and RIS Market Revenue And Forecasts to 2027, By Component (US$ Mn)
10.5 Asia Pacific PACS and RIS Market Revenue And Forecasts to 2027, By Deployment (US$ Mn)
10.6 Asia Pacific PACS and RIS Market Revenue And Forecasts to 2027, By End User (US$ Mn)
10.7 Asia Pacific PACS and RIS Market Revenue And Forecasts to 2027, By Country (%)
10.7.1 Japan PACS and RIS Market Revenue and Forecasts to 2027 (US$ Mn)
10.7.1.1 Japan PACS and RIS Market Revenue and Forecasts to 2027 (US$ Mn)
10.7.1.2 Japan PACS and RIS Market Revenue And Forecasts to 2027, By Product (US$ Mn)
10.7.1.3 Japan PACS and RIS Market Revenue And Forecasts to 2027, By Component (US$ Mn)
10.7.1.4 Japan PACS and RIS Market Revenue And Forecasts to 2027, By Deployment (US$ Mn)
10.7.1.5 Japan PACS and RIS Market Revenue And Forecasts to 2027, By End User (US$ Mn)
10.7.2 China PACS and RIS Market Revenue and Forecasts to 2027 (US$ Mn)
10.7.2.1 China PACS and RIS Market Revenue and Forecasts to 2027 (US$ Mn)
10.7.2.2 China PACS and RIS Market Revenue And Forecasts to 2027, By Product (US$ Mn)
10.7.2.3 China PACS and RIS Market Revenue And Forecasts to 2027, By Component (US$ Mn)
10.7.2.4 China PACS and RIS Market Revenue And Forecasts to 2027, By Deployment (US$ Mn)
10.7.2.5 China PACS and RIS Market Revenue And Forecasts to 2027, By End User (US$ Mn)
10.7.3 India PACS and RIS Market Revenue and Forecasts to 2027 (US$ Mn)
10.7.3.1 India PACS and RIS Market Revenue and Forecasts to 2027 (US$ Mn)
10.7.3.2 India PACS and RIS Market Revenue And Forecasts to 2027, By Product (US$ Mn)
10.7.3.3 India PACS and RIS Market Revenue And Forecasts to 2027, By Component (US$ Mn)
10.7.3.4 India PACS and RIS Market Revenue And Forecasts to 2027, By Deployment (US$ Mn)
10.7.3.5 India PACS and RIS Market Revenue And Forecasts to 2027, By End User (US$ Mn)
10.7.4 South Korea PACS and RIS Market Revenue and Forecasts to 2027 (US$ Mn)
10.7.4.1 South Korea PACS and RIS Market Revenue and Forecasts to 2027 (US$ Mn)
10.7.4.2 South Korea PACS and RIS Market Revenue And Forecasts to 2027, By Product (US$ Mn)
10.7.4.3 South Korea PACS and RIS Market Revenue And Forecasts to 2027, By Component (US$ Mn)
10.7.4.4 South Korea PACS and RIS Market Revenue And Forecasts to 2027, By Deployment (US$ Mn)
10.7.4.5 South Korea PACS and RIS Market Revenue And Forecasts to 2027, By End User (US$ Mn)
10.7.5 Australia PACS and RIS Market Revenue and Forecasts to 2027 (US$ Mn)
10.7.5.1 Australia PACS and RIS Market Revenue and Forecasts to 2027 (US$ Mn)
10.7.5.2 Australia PACS and RIS Market Revenue And Forecasts to 2027, By Product (US$ Mn)
10.7.5.3 Australia PACS and RIS Market Revenue And Forecasts to 2027, By Component (US$ Mn)
10.7.5.4 Australia PACS and RIS Market Revenue And Forecasts to 2027, By Deployment (US$ Mn)
10.7.5.5 Australia PACS and RIS Market Revenue And Forecasts to 2027, By End User (US$ Mn)
11. PACS and RIS Market – Industry Landscape
11.1 Overview
11.2 Growth Strategies In The PACS and RIS Market, 2016-2019
11.3 Inorganic Growth Strategies
11.3.1 Overview
11.4 Inorganic Growth Strategies in the PACS and RIS Market, 2016-2019 (%)
11.4.1 Collaborations
11.4.1.1 Recent Collaborations By Players In The PACS and RIS Market
11.4.2 Agreements, Partnerships and Joint Ventures
11.4.2.1 Recent Agreements, Partnerships And Joint Ventures By Players In The PACS and RIS Market
11.4.3 Acquisitions
11.4.3.1 Recent Acquisitions By Players In The PACS and RIS Market
11.5 Organic Growth Strategies
11.5.1 Overview
11.6 Organic Growth Strategies in the PACS and RIS Market, 2016-2019 (%)
11.6.1 Product Launches
11.6.1.1 Recent Product Launches By Players In The PACS and RIS Market
11.6.2 Product Approval & Other Organic Growth Strategies
11.6.2.1 Recent Product Approval & Other Organic Growth Strategies By Players In The PACS and RIS Market
12. PACS and RIS Market–Key Company Profiles
12.1 Agfa-Gevaert Group
12.1.1 Key Facts
12.1.2 Business Description
12.1.3 Financial Overview
12.1.4 Product Portfolio
12.1.5 SWOT Analysis
12.1.6 Key Developments
12.2 INFINITT Healthcare Co., Ltd.
12.2.1 Key Facts
12.2.2 Business Description
12.2.3 Financial Overview
12.2.4 Product Portfolio
12.2.5 SWOT Analysis
12.2.6 Key Developments
12.3 McKesson Corporation
12.3.1 Key Facts
12.3.2 Business Description
12.3.3 Financial Overview
12.3.4 Product Portfolio
12.3.5 SWOT Analysis
12.3.6 Key Developments
12.4 Cerner Corporation
12.4.1 Key Facts
12.4.2 Business Description
12.4.3 Financial Overview
12.4.4 Product Portfolio
12.4.5 SWOT Analysis
12.4.6 Key Developments
12.5 General Electric Company
12.5.1 Key Facts
12.5.2 Business Description
12.5.3 Financial Overview
12.5.4 Product Portfolio
12.5.5 SWOT Analysis
12.5.6 Key Developments
12.6 Koninklijke Philips N.V.
12.6.1 Key Facts
12.6.2 Business Description
12.6.3 Financial Overview
12.6.4 Product Portfolio
12.6.5 SWOT Analysis
12.6.6 Key Developments
12.7 FUJIFILM Holdings Corporation
12.7.1 Key Facts
12.7.2 Business Description
12.7.3 Financial Overview
12.7.4 Product Portfolio
12.7.5 SWOT Analysis
12.7.6 Key Developments
12.8 Siemens AG
12.8.1 Key Facts
12.8.2 Business Description
12.8.3 Financial Overview
12.8.4 Product Portfolio
12.8.5 SWOT Analysis
12.8.6 Key Developments
12.9 IBM
12.9.1 Key Facts
12.9.2 Business Description
12.9.3 Financial Overview
12.9.4 Product Portfolio
12.9.5 SWOT Analysis
12.9.6 Key Developments
12.10 Novarad
12.10.1 Key Facts
12.10.2 Business Description
12.10.3 Financial Overview
12.10.4 Product Portfolio
12.10.5 SWOT Analysis
12.10.6 Key Developments
13. Appendix
13.1 About The Insight Partners
13.2 Glossary Of Terms
13.3 Methodology
13.3.1 Coverage
13.3.2 Secondary Research
13.3.3 Primary Research
LIST OF TABLES
Table 1. Asia Pacific PACS and RIS Market Revenue And Forecasts to 2027, By Product (US$ Mn)
Table 2. Asia Pacific PACS and RIS Market Revenue And Forecasts to 2027, By Component (US$ Mn)
Table 3. Asia Pacific PACS and RIS Market Revenue And Forecasts to 2027, By Deployment (US$ Mn)
Table 4. Asia Pacific PACS and RIS Market Revenue And Forecasts to 2027, By End User (US$ Mn)
Table 5. Asia Pacific PACS and RIS Market Revenue And Forecasts to 2027, By Product (US$ Mn)
Table 6. Asia Pacific PACS and RIS Market Revenue And Forecasts to 2027, By Component (US$ Mn)
Table 7. Asia Pacific PACS and RIS Market Revenue And Forecasts to 2027, By Deployment (US$ Mn)
Table 8. Asia Pacific PACS and RIS Market Revenue And Forecasts to 2027, By End User (US$ Mn)
Table 9. Japan PACS and RIS Market Revenue And Forecasts to 2027, By Product (US$ Mn)
Table 10. Japan PACS and RIS Market Revenue And Forecasts to 2027, By Component (US$ Mn)
Table 11. Japan PACS and RIS Market Revenue And Forecasts to 2027, By Deployment (US$ Mn)
Table 12. Japan PACS and RIS Market Revenue And Forecasts to 2027, By End User (US$ Mn)
Table 13. China PACS and RIS Market Revenue And Forecasts to 2027, By Product (US$ Mn)
Table 14. China PACS and RIS Market Revenue And Forecasts to 2027, By Component (US$ Mn)
Table 15. China PACS and RIS Market Revenue And Forecasts to 2027, By Deployment (US$ Mn)
Table 16. China PACS and RIS Market Revenue And Forecasts to 2027, By End User (US$ Mn)
Table 17. India PACS and RIS Market Revenue And Forecasts to 2027, By Product (US$ Mn)
Table 18. India PACS and RIS Market Revenue And Forecasts to 2027, By Component (US$ Mn)
Table 19. India PACS and RIS Market Revenue And Forecasts to 2027, By Deployment (US$ Mn)
Table 20. India PACS and RIS Market Revenue And Forecasts to 2027, By End User (US$ Mn)
Table 21. South Korea PACS and RIS Market Revenue And Forecasts to 2027, By Product (US$ Mn)
Table 22. South Korea PACS and RIS Market Revenue And Forecasts to 2027, By Component (US$ Mn)
Table 23. South Korea PACS and RIS Market Revenue And Forecasts to 2027, By Deployment (US$ Mn)
Table 24. South Korea PACS and RIS Market Revenue And Forecasts to 2027, By End User (US$ Mn)
Table 25. Australia PACS and RIS Market Revenue And Forecasts to 2027, By Product (US$ Mn)
Table 26. Australia PACS and RIS Market Revenue And Forecasts to 2027, By Component (US$ Mn)
Table 27. Australia PACS and RIS Market Revenue And Forecasts to 2027, By Deployment (US$ Mn)
Table 28. Australia PACS and RIS Market Revenue And Forecasts to 2027, By End User (US$ Mn)
Table 29. Recent Collaborations By Players In The PACS and RIS Market
Table 30. Recent Agreements, Partnerships And Joint Ventures By Players In The PACS and RIS Market
Table 31. Recent Acquisitions By Players In The PACS and RIS Market
Table 32. Recent Product Launches in the PACS and RIS Market
Table 33. Recent Product Approval & Other Organic Growth Strategies in the PACS and RIS Market
Table 34. Glossary of Terms, PACS and RIS Market
LIST OF FIGURES
Figure 1. Japan PACS and RIS Market, Revenue (US$ Mn), By Country 2018 & 2027
Figure 2. Asia Pacific PACS and RIS Market By Product, Market Share (%), 2018
Figure 3. Asia Pacific PACS and RIS Market By Component, Market Share (%), 2018
Figure 4. Asia Pacific PACS and RIS Market By Deployment, Market Share (%), 2018
Figure 5. Asia Pacific PACS and RIS Market By End User, Market Share (%), 2018
Figure 6. PACS and RIS Market Segmentation
Figure 7. Asia Pacific PEST Analysis
Figure 8. PACS and RIS Market Impact Analysis of Drivers & Restraints
Figure 9. Asia Pacific PACS and RIS Market – Revenue Forecasts And Analysis – 2018- 2027
Figure 10. Market Positioning Of Key Player In Global PACS and RIS Market
Figure 11. Asia Pacific PACS and RIS Market, By Product 2018 & 2027 (%)
Figure 12. Asia Pacific Picture Archive and Communication System (PACS) Market Revenue and Forecasts to 2027 (US$ Mn)
Figure 13. Asia Pacific Radiology Information System (RIS) Market Revenue and Forecasts to 2027 (US$ Mn)
Figure 14. Asia Pacific PACS and RIS Market By Component, 2018 & 2027 (%)
Figure 15. Asia Pacific Software Market Revenue and Forecasts to 2027 (US$ Mn)
Figure 16. Asia Pacific Hardware Market Revenue and Forecasts to 2027 (US$ Mn)
Figure 17. Asia Pacific Services Market Revenue and Forecasts to 2027 (US$ Mn)
Figure 18. Asia Pacific PACS and RIS Market, By Deployment 2018 & 2027 (%)
Figure 19. Asia Pacific Web-Based Market Revenue and Forecasts to 2027 (US$ Mn)
Figure 20. Asia Pacific On-Premise Market Revenue and Forecasts to 2027 (US$ Mn)
Figure 21. Asia Pacific Cloud-Based Market Revenue and Forecasts to 2027 (US$ Mn)
Figure 22. Asia Pacific PACS and RIS Market, By End User 2018 & 2027 (%)
Figure 23. Asia Pacific Hospitals Market Revenue and Forecasts to 2027 (US$ Mn)
Figure 24. Asia Pacific Diagnostic Centers Market Revenue and Forecasts to 2027 (US$ Mn)
Figure 25. Asia Pacific Others Market Revenue and Forecasts to 2027 (US$ Mn)
Figure 26. Asia Pacific PACS and RIS Market Revenue Overview, By Country, 2018 (US$ Mn)
Figure 27. Asia Pacific PACS and RIS Market Revenue and Forecasts to 2027 (US$ Mn)
Figure 28. Asia Pacific PACS and RIS Market Revenue And Forecasts to 2027, By Country (%)
Figure 29. Japan PACS and RIS Market Revenue and Forecasts to 2027 (US$ Mn)
Figure 30. China PACS and RIS Market Revenue and Forecasts to 2027 (US$ Mn)
Figure 31. India PACS and RIS Market Revenue and Forecasts to 2027 (US$ Mn)
Figure 32. South Korea PACS and RIS Market Revenue and Forecasts to 2027 (US$ Mn)
Figure 33. Australia PACS and RIS Market Revenue and Forecasts to 2027 (US$ Mn)
Figure 34. Growth Strategies in the PACS and RIS Market, 2016-2019
Figure 35. Inorganic Developments in the PACS and RIS Market, 2016-2019(%)
Figure 36. Organic Growth Strategies in the PACS and RIS Market, 2016-2019 (%)
The List of Companies
1. McKesson Corporation
2. General Electric
3. Fujifilm Holdings Corporation
4. Koninklijke Philips N.V.
5. Siemens AG
6. Cerner Corporation
7. IBM
8. Novarad
9. Agfa-Gevaert Group
10. INFINITT Healthcare Co., Ltd.
The Insight Partners performs research in 4 major stages: Data Collection & Secondary Research, Primary Research, Data Analysis and Data Triangulation & Final Review.
- Data Collection and Secondary Research:
As a market research and consulting firm operating from a decade, we have published many reports and advised several clients across the globe. First step for any study will start with an assessment of currently available data and insights from existing reports. Further, historical and current market information is collected from Investor Presentations, Annual Reports, SEC Filings, etc., and other information related to company’s performance and market positioning are gathered from Paid Databases (Factiva, Hoovers, and Reuters) and various other publications available in public domain.
Several associations trade associates, technical forums, institutes, societies and organizations are accessed to gain technical as well as market related insights through their publications such as research papers, blogs and press releases related to the studies are referred to get cues about the market. Further, white papers, journals, magazines, and other news articles published in the last 3 years are scrutinized and analyzed to understand the current market trends.
- Primary Research:
The primarily interview analysis comprise of data obtained from industry participants interview and answers to survey questions gathered by in-house primary team.
For primary research, interviews are conducted with industry experts/CEOs/Marketing Managers/Sales Managers/VPs/Subject Matter Experts from both demand and supply side to get a 360-degree view of the market. The primary team conducts several interviews based on the complexity of the markets to understand the various market trends and dynamics which makes research more credible and precise.
A typical research interview fulfils the following functions:
- Provides first-hand information on the market size, market trends, growth trends, competitive landscape, and outlook
- Validates and strengthens in-house secondary research findings
- Develops the analysis team’s expertise and market understanding
Primary research involves email interactions and telephone interviews for each market, category, segment, and sub-segment across geographies. The participants who typically take part in such a process include, but are not limited to:
- Industry participants: VPs, business development managers, market intelligence managers and national sales managers
- Outside experts: Valuation experts, research analysts and key opinion leaders specializing in the electronics and semiconductor industry.
Below is the breakup of our primary respondents by company, designation, and region:

Once we receive the confirmation from primary research sources or primary respondents, we finalize the base year market estimation and forecast the data as per the macroeconomic and microeconomic factors assessed during data collection.
- Data Analysis:
Once data is validated through both secondary as well as primary respondents, we finalize the market estimations by hypothesis formulation and factor analysis at regional and country level.
- 3.1 Macro-Economic Factor Analysis:
We analyse macroeconomic indicators such the gross domestic product (GDP), increase in the demand for goods and services across industries, technological advancement, regional economic growth, governmental policies, the influence of COVID-19, PEST analysis, and other aspects. This analysis aids in setting benchmarks for various nations/regions and approximating market splits. Additionally, the general trend of the aforementioned components aid in determining the market's development possibilities.
- 3.2 Country Level Data:
Various factors that are especially aligned to the country are taken into account to determine the market size for a certain area and country, including the presence of vendors, such as headquarters and offices, the country's GDP, demand patterns, and industry growth. To comprehend the market dynamics for the nation, a number of growth variables, inhibitors, application areas, and current market trends are researched. The aforementioned elements aid in determining the country's overall market's growth potential.
- 3.3 Company Profile:
The “Table of Contents” is formulated by listing and analyzing more than 25 - 30 companies operating in the market ecosystem across geographies. However, we profile only 10 companies as a standard practice in our syndicate reports. These 10 companies comprise leading, emerging, and regional players. Nonetheless, our analysis is not restricted to the 10 listed companies, we also analyze other companies present in the market to develop a holistic view and understand the prevailing trends. The “Company Profiles” section in the report covers key facts, business description, products & services, financial information, SWOT analysis, and key developments. The financial information presented is extracted from the annual reports and official documents of the publicly listed companies. Upon collecting the information for the sections of respective companies, we verify them via various primary sources and then compile the data in respective company profiles. The company level information helps us in deriving the base number as well as in forecasting the market size.
- 3.4 Developing Base Number:
Aggregation of sales statistics (2020-2022) and macro-economic factor, and other secondary and primary research insights are utilized to arrive at base number and related market shares for 2022. The data gaps are identified in this step and relevant market data is analyzed, collected from paid primary interviews or databases. On finalizing the base year market size, forecasts are developed on the basis of macro-economic, industry and market growth factors and company level analysis.
- Data Triangulation and Final Review:
The market findings and base year market size calculations are validated from supply as well as demand side. Demand side validations are based on macro-economic factor analysis and benchmarks for respective regions and countries. In case of supply side validations, revenues of major companies are estimated (in case not available) based on industry benchmark, approximate number of employees, product portfolio, and primary interviews revenues are gathered. Further revenue from target product/service segment is assessed to avoid overshooting of market statistics. In case of heavy deviations between supply and demand side values, all thes steps are repeated to achieve synchronization.
We follow an iterative model, wherein we share our research findings with Subject Matter Experts (SME’s) and Key Opinion Leaders (KOLs) until consensus view of the market is not formulated – this model negates any drastic deviation in the opinions of experts. Only validated and universally acceptable research findings are quoted in our reports.
We have important check points that we use to validate our research findings – which we call – data triangulation, where we validate the information, we generate from secondary sources with primary interviews and then we re-validate with our internal data bases and Subject matter experts. This comprehensive model enables us to deliver high quality, reliable data in shortest possible time.
Trends and growth analysis reports related to Asia Pacific PACS and RIS Market

May 2021
Emergency Call Systems Market
Size and Forecast (2020 - 2030), Global and Regional Share, Trend, and Growth Opportunity Analysis Report Coverage: By Application (Fall Prevention and Detection, Workflow Optimization, Patient Care Reminders, Alarms and Communication Management, Wander Management, Reporting and Analytics, Real-Time Staff Locating, and Others), End User (Hospital and Clinics, Assisted Living and Independent Living Facilities, Ambulatory Surgical Centers, and Others), Technology (Wired and Wireless), Offering (Hardware, Software, and Services), Product Type (Nurse Call Systems, Call Box Systems, Emergency Stanchions, Intercom System, and Others),, and Geography (North America, Europe, Asia Pacific, Middle East & Africa, and South & Central America)
May 2021
Outpatient Central Fulfillment Market
Size and Forecast (2020 - 2030), Global and Regional Share, Trend, and Growth Opportunity Analysis Report Coverage: By Product Type (Automated Medication Dispensing Systems, Automated Packaging and Labeling Systems, Automated Tabletop Counters, Automated Storage and Retrieval Systems, and Others), End User (Hospital Pharmacies, Retail Pharmacies, and Mail-Order Pharmacies), and Geography (North America, Europe, Asia Pacific, South & Central America, and Middle East & Africa)
May 2021
Well-Being Platform Market
Forecast to 2030 - Global Analysis by Service (Health Risk Assessment, Fitness, Smoking Cessation, Health Screening, Nutrition & Weight Management, Stress Management, Comprehensive Well-Being, and Others), Category (Fitness and Nutrition Consultant, Psychological Therapists, and Organizations/Employers), Delivery Model (Onsite and Offsite), End User (Small-Scale Organizations, Medium-Scale Organizations, Large-Scale Organizations, and Home Use), and Geography
May 2021
Product Design and Development Services Market
Forecast to 2028 - COVID-19 Impact and Global Analysis By Services (Research, Strategy, and Concept Generation; Concept and Requirement Development; Detailed Design and Process Development; Process Validation, Manufacturing Transfer, and Design Validation; and Other Services), Application (Diagnostic Equipment, Therapeutic Equipment, Surgical Instruments, Clinical Laboratory Equipment, Biological Storage, Consumables, and Others), and End User (Medical Companies, Pharmaceutical Companies, Biotechnology Companies, and Contract Research Organizations)
May 2021
Patient Engagement Technology Market
Forecast to 2028 - COVID-19 Impact and Global Analysis By Component (Services, Hardware, and Software), Therapeutic Area (Fitness, Chronic Diseases, Women’s Health, and others), Delivery Mode (Cloud-Based and On-Premises), Application (Health Management, Financial Health Management, Home Healthcare Management, and Others), and End User (Patients, Payers, Providers, and Others)
May 2021
IVD Contract Research Organization Market
Forecast to 2028 - COVID-19 Impact and Global Analysis By Type (Clinical Chemistry, Molecular Diagnostics, Immunochemistry, Companion Diagnostics, Hematology, Histology & Cytology, Microbiology, and Others), Services (Clinical Research, Biostatistics & Data Management Services, Therapeutic Expertise, Regulatory Services, Reimbursement Support Services, Assay Development Services, and Others), and Geography
May 2021
Dental CAD/CAM Market
Forecast to 2028 - COVID-19 Impact and Global Analysis By Product [Dental CAD/CAM Materials (Glass Ceramics, Alumina-Based Ceramics, Lithium Disilicate, Zirconia, and Others) and Dental CAD/CAM Systems], Type (In-Office Systems and In-Lab Systems), Components [Hardware (Dental Printers, Milling Machines, Scanners, and Others) and Software], Application (Dental Prosthesis, Dental Implants, and Others), and End User (Dental Clinics, Dental Laboratories, Milling Centers, and Others)
May 2021
Emergency Medical Software Market
Forecast to 2028 - COVID-19 Impact and Global Analysis By Product [Early Warning and Vulnerability Alert System (EWVAS), EMS Computer Aided Dispatch (CAD) System, Incident Response Software, Ambulance Management Software, and Others], Mode of Delivery [On Premises and Software as a Service (SaaS)], Platform (Android, iOS, Windows, and Others), and End User (Commercial, Municipal, State City Agencies, and Others)