South America Electronic Toll Collection System Market Size, Share, and Analysis by 2028
South America Electronic Toll Collection System Market Forecast to 2028 - COVID-19 Impact and Regional Analysis By Offering (Hardware Equipment and Service), Technology (ANPR, GNSS, DSRC, and Others), and Application (Highways and Urban Zones)
- Report Date : Nov 2021
- Report Code : TIPRE00025772
- Category : Electronics and Semiconductor
- Status : Published
- Available Report Formats :


- No. of Pages : 109
The electronic toll collection system market in SAM is expected to grow from US$ 312.56 million in 2021 to US$ 550.39 million by 2028; it is estimated to grow at a CAGR of 9.3% from 2021 to 2028.
Brazil, and Argentina are major economies in SAM. Mobile and satellites-based GPS systems witness rise in funding is the major factor driving the growth of the SAM electronic toll collection system market. The commercialization of global positioning systems (GPS or GNSS) has substantially broadened its scope of application in various daily activities. For instance, the use of GPS systems installed onboard vehicles could also be utilized for toll collection purposes thereby effectively eliminating the need for any tolling infrastructure or system requirements. Moreover, other benefits such as low cost per transaction, maintainability, accessibility to web-based account and no infrastructure required for integration of new route among other advantages are expected to drive the GPS based toll collection systems. In addition, the availability of cost of sharing the GPS technology owing to sharing of service also lowers the cost of maintenance and operational costs of this systems. Thus, providing a substantial advantage over the existing toll collection systems. However, the recent growing awareness towards data privacy, data protection regulations and its ability to enforce violation are expected to restrict the penetration of this technology to a wider audience. As a result, the post subsequent improvements in data privacy and protection are achieved and regulated by the government, the technology is expected to provide profitable opportunities for the market players.SAM countries have been witnessing growth in several industries over the past few years. Industries such as automotive, aerospace, and equipment manufacturing have experienced a fair growth rate. However, the COVID-19 pandemic has affected several sectors, including the toll collection activity. Due to the non-availability of raw materials, the market has been negatively affected. The electronic toll collection includes various semiconductor components, and most of these components are needed to import from other countries. Due to supply chain disruption, the work was halted, which has negatively impacted the market in 2020. Moreover, various governments-imposed lockdowns, resulting in restricted or no movement of people and goods in April and May 2020. However, restrictions have been lifted, and economies are slowly moving toward normal growth. Manufacturing units were hampered due to shutdowns and the availability of raw material and labor as transportation and traveling were restrictions. In 2021, with the release of lockdown measures and the beginning of the vaccination process, raw materials' shipment has started again, and the development of older toll collection systems has resumed. Therefore, this will fuel the growth of the electronic toll collection market in the region.
With the new features and technologies, vendors can attract new customers and expand their footprints in emerging markets. This factor is likely to drive the SAM electronic toll collection system market. The SAM electronic toll collection system market is expected to grow at a good CAGR during the forecast period.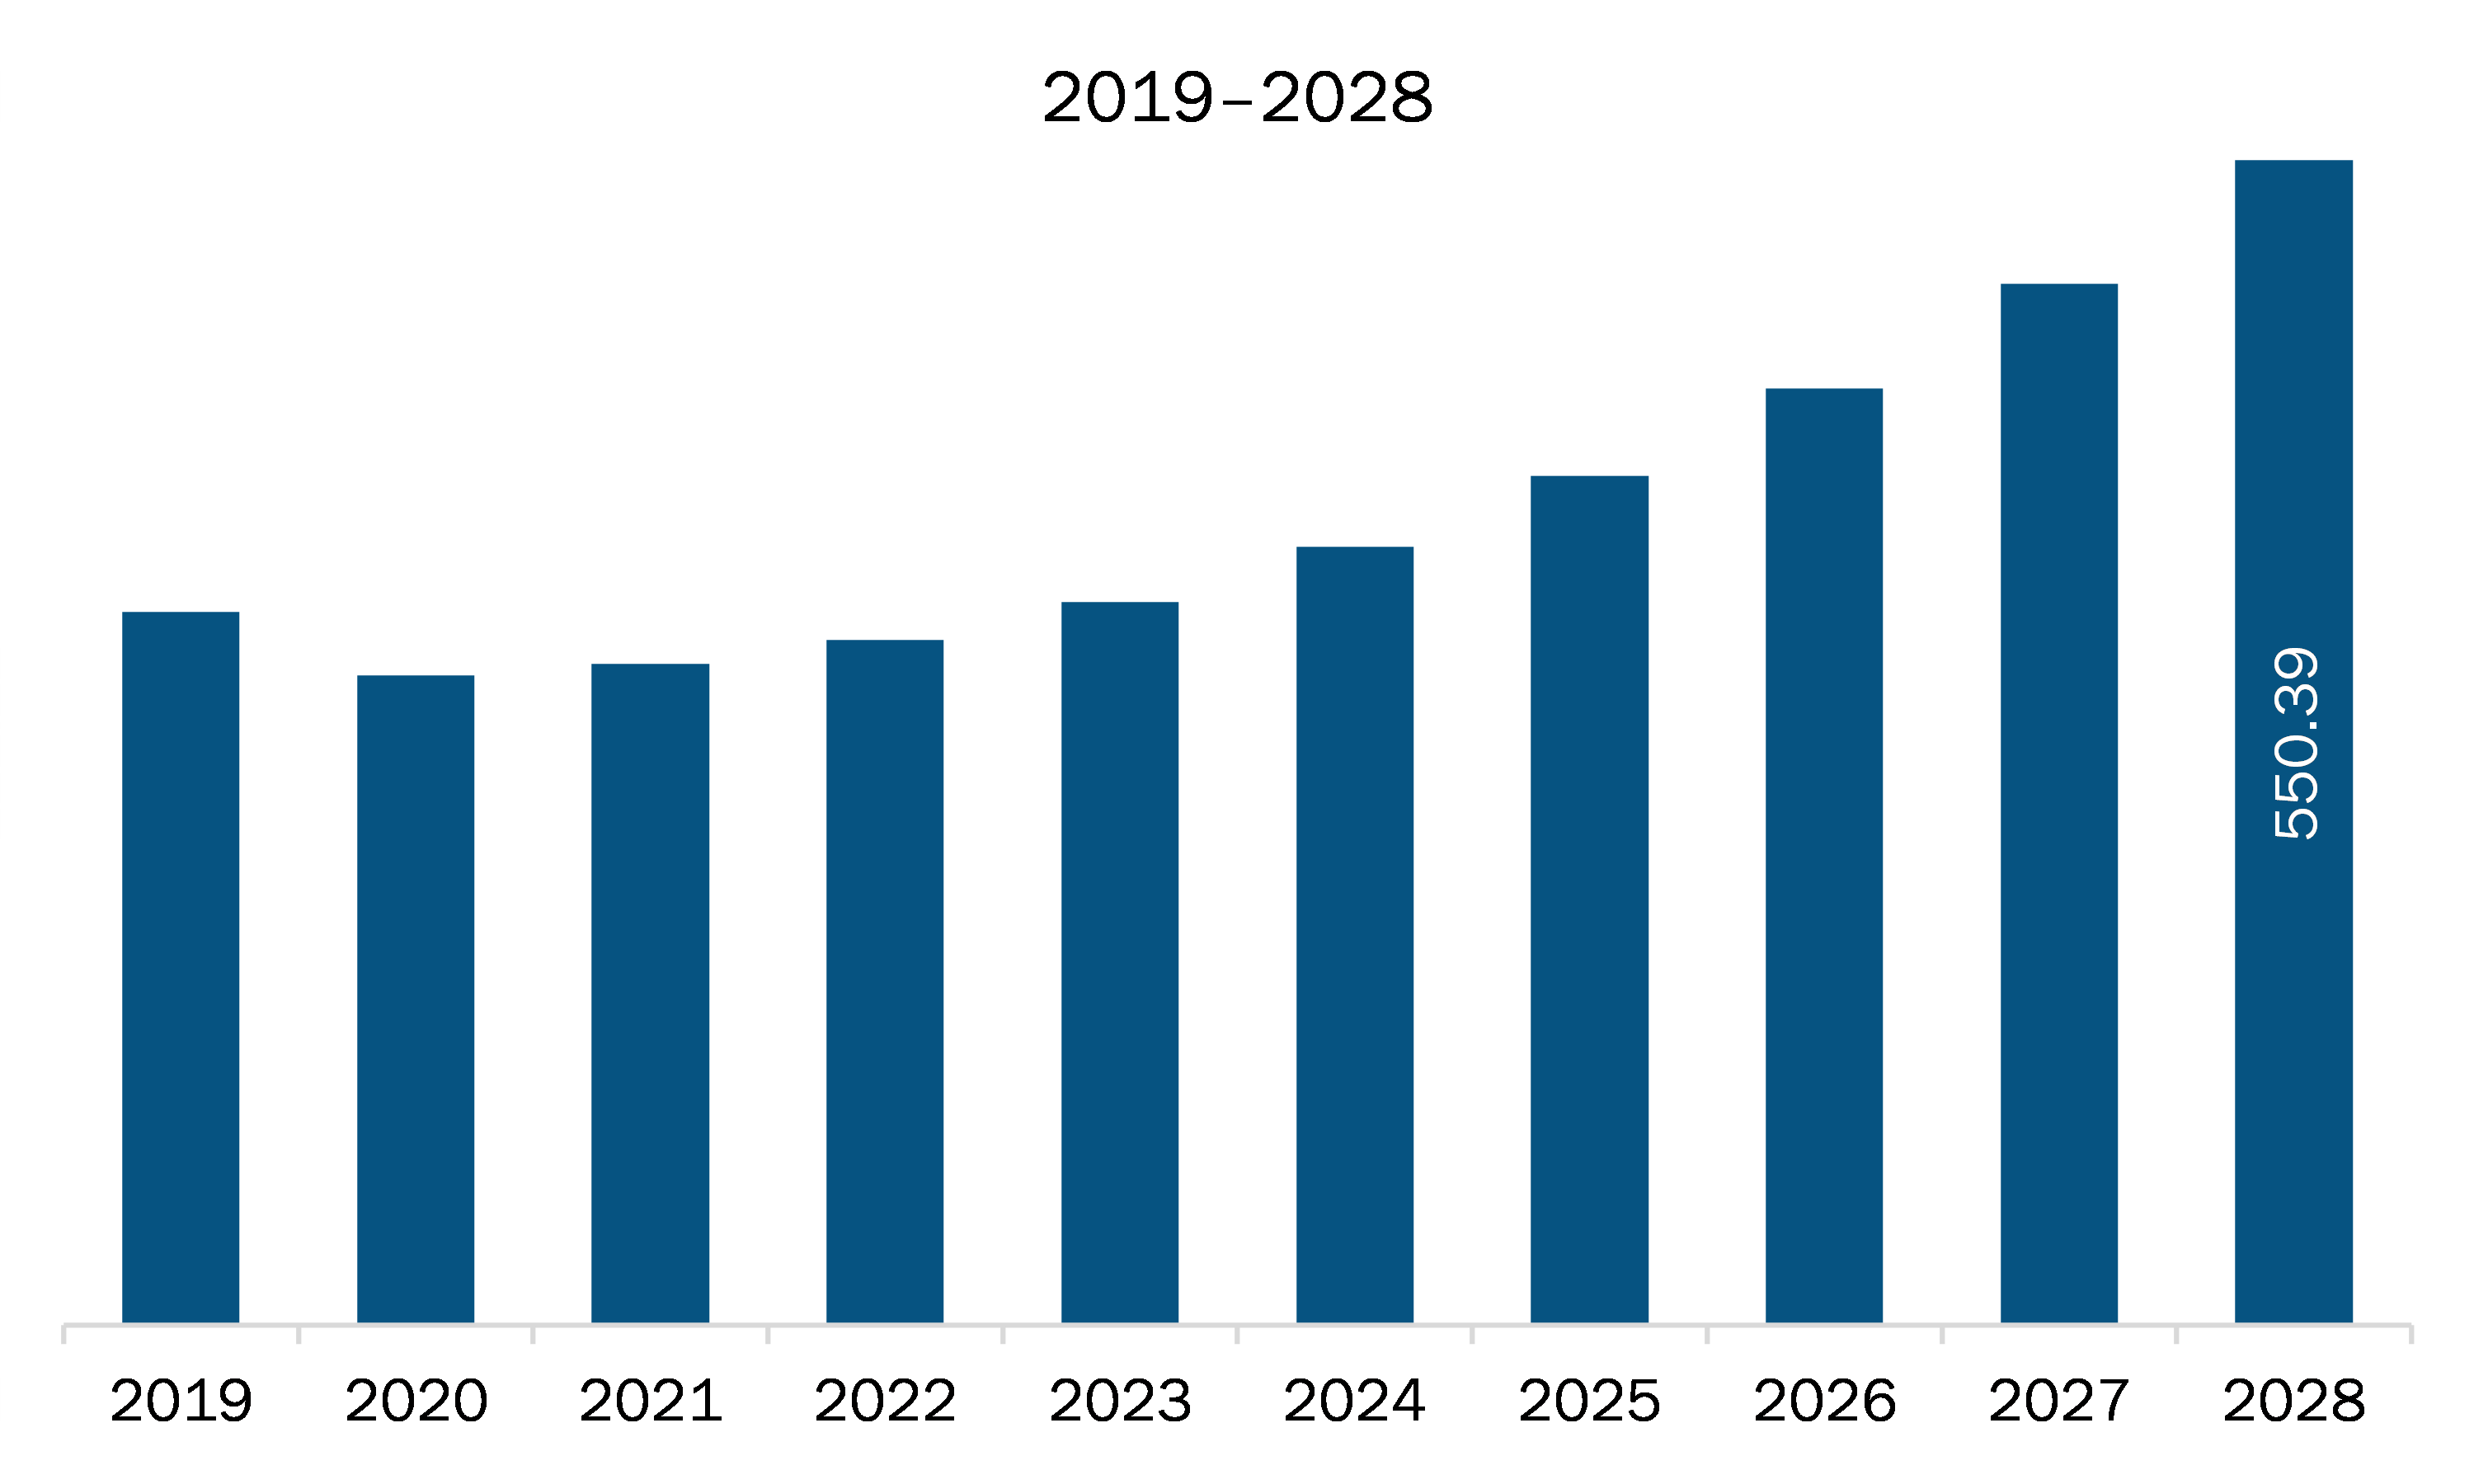
- Sample PDF showcases the content structure and the nature of the information with qualitative and quantitative analysis.
- Request discounts available for Start-Ups & Universities
SAM Electronic Toll Collection System Market Segmentation
SAM Electronic Toll Collection System Market – By Offering
- Hardware Equipment
- Service
SAM Electronic Toll Collection System Market – By Technology
- ANPR
- GNSS
- DSRC
- Others
SAM Electronic Toll Collection System Market – By Application
- Highways
- Urban Area
SAM Electronic Toll Collection System Market, by Country
- Brazil
- Argentina
- Rest of SAM
SAM Electronic Toll Collection System Market - Companies Mentioned
- Conduent, Inc.
- Efkon GmbH
- Kapsch Trafficcom AG
- Siemens AG
- Thales Group

Report Coverage
Revenue forecast, Company Analysis, Industry landscape, Growth factors, and Trends

Segment Covered
This text is related
to segments covered.

Regional Scope
North America, Europe, Asia Pacific, Middle East & Africa, South & Central America

Country Scope
This text is related
to country scope.
TABLE OF CONTENTS
1. Introduction
1.1 Study Scope
1.2 The Insight Partners Research Report Guidance
1.3 Market Segmentation
2. Key Takeaways
3. Research Methodology
3.1 Coverage
3.2 Secondary Research
3.3 Primary Research
4. SAM Electronic Toll Collection System Market Landscape
4.1 Market Overview
4.2 SAM PEST Analysis
4.3 Ecosystem Analysis
4.4 Expert Opinion
5. SAM Electronic Toll Collection System Market – Key Market Dynamics
5.1 Key Market Drivers
5.1.1 Economic and safety advantages in years to come
5.1.2 Significant need of interoperable electronic tolling systems
5.2 Key Market Restraints
5.2.1 Chances of leakage as well as high CapEx and OpEx expense
5.2.2 ETC systems suffer from a lack of standardisation and evaluation metrics
5.3 Future Trends
5.3.1 Mobile and satellites-based GPS systems witness rise in funding
5.4 Impact Analysis of Drivers and Restraints
6. Electronic Toll Collection System Market – SAM Analysis
6.1 SAM Electronic Toll Collection System Market Overview
6.2 SAM Electronic Toll Collection System Market – Revenue and Forecast to 2028 (US$ Million)
7. SAM Electronic Toll Collection System Market Analysis By Offering
7.1 Overview
7.2 SAM Electronic Toll Collection System Market, By Offering (2020 and 2028)
7.3 Hardware Equipment
7.3.1 Overview
7.3.2 Hardware Equipment: Electronic Toll Collection System Market – Revenue and Forecast to 2028 (US$ Million)
7.4 Service
7.4.1 Overview
7.4.2 Service: Electronic Toll Collection System Market – Revenue and Forecast to 2028 (US$ Million)
8. SAM Electronic Toll Collection System Market – By Technology
8.1 Overview
8.2 SAM Electronic Toll Collection System Market, by Technology (2020 and 2028)
8.3 ANPR
8.3.1 Overview
8.3.2 ANPR: Electronic Toll Collection System Market – Revenue and Forecast to 2028 (US$ Million)
8.4 GNSS
8.4.1 Overview
8.4.2 GNSS: Electronic Toll Collection System Market – Revenue and Forecast to 2028 (US$ Million)
8.5 DSRC
8.5.1 Overview
8.5.2 DSRC: Electronic Toll Collection System Market – Revenue and Forecast to 2028 (US$ Million)
8.6 Others
8.6.1 Overview
8.6.2 Others: Electronic Toll Collection System Market – Revenue and Forecast to 2028 (US$ Million)
9. SAM Electronic Toll Collection System Market – By Application
9.1 Overview
9.2 SAM Electronic Toll Collection System Market, by Application (2020 and 2028)
9.3 Highways
9.3.1 Overview
9.3.2 Highways: Electronic Toll Collection System Market – Revenue and Forecast to 2028 (US$ Million)
9.4 Urban Zones
9.4.1 Overview
9.4.2 Urban Zones: Electronic Toll Collection System Market – Revenue and Forecast to 2028 (US$ Million)
10. SAM Electronic Toll Collection System Market – Country Analysis
10.1 Overview
10.1.1 SAM: Electronic Toll Collection System Market- by Key Country
10.1.1.1 Brazil: Electronic Toll Collection System Market – Revenue and Forecast to 2028 (US$ Million)
10.1.1.1.1 Brazil: Electronic Toll Collection System Market- by Offering
10.1.1.1.2 Brazil: Electronic Toll Collection System Market- By Technology
10.1.1.1.3 Brazil: Electronic Toll Collection System Market- By Application
10.1.1.2 Argentina: Electronic Toll Collection System Market – Revenue and Forecast to 2028 (US$ Million)
10.1.1.2.1 Argentina: Electronic Toll Collection System Market- by Offering
10.1.1.2.2 Argentina: Electronic Toll Collection System Market- By Technology
10.1.1.2.3 Argentina: Electronic Toll Collection System Market- By Application
10.1.1.3 Rest of SAM: Electronic Toll Collection System Market – Revenue and Forecast to 2028 (US$ Million)
10.1.1.3.1 Rest of SAM: Electronic Toll Collection System Market- by Offering
10.1.1.3.2 Rest of SAM: Electronic Toll Collection System Market- By Technology
10.1.1.3.3 Rest of SAM: Electronic Toll Collection System Market- By Application
11. SAM Electronic Toll Collection System Market- COVID-19 Impact Analysis
11.1 SAM
12. Industry Landscape
12.1 Overview
12.2 Market Initiative
12.3 Merger and acquisition
12.4 New Product Development
13. Company Profiles
13.1 Conduent, Inc.
13.1.1 Key Facts
13.1.2 Business Description
13.1.3 Products and Services
13.1.4 Financial Overview
13.1.5 SWOT Analysis
13.1.6 Key Developments
13.2 EFKON GmbH
13.2.1 Key Facts
13.2.2 Business Description
13.2.3 Products and Services
13.2.4 Financial Overview
13.2.5 SWOT Analysis
13.2.6 Key Developments
13.3 Kapsch TrafficCom AG
13.3.1 Key Facts
13.3.2 Business Description
13.3.3 Products and Services
13.3.4 Financial Overview
13.3.5 SWOT Analysis
13.3.6 Key Developments
13.4 Siemens Mobility
13.4.1 Key Facts
13.4.2 Business Description
13.4.3 Products and Services
13.4.4 Financial Overview
13.4.5 SWOT Analysis
13.4.6 Key Developments
13.5 Thales Group
13.5.1 Key Facts
13.5.2 Business Description
13.5.3 Products and Services
13.5.4 Financial Overview
13.5.5 SWOT Analysis
13.5.6 Key Developments
14. Appendix
14.1 About The Insight Partners
14.2 Word Index
LIST OF TABLES
Table 1. SAM Electronic Toll Collection System Market – Revenue, and Forecast to 2028 (US$ Million)
Table 2. Brazil: Electronic Toll Collection System Market- by Offering –Revenue and Forecast to 2028 (US$ Million)
Table 3. Brazil: Electronic Toll Collection System Market- By Technology –Revenue and Forecast to 2028 (US$ Million)
Table 4. Brazil: Electronic Toll Collection System Market- By Application –Revenue and Forecast to 2028 (US$ Million)
Table 5. Argentina: Electronic Toll Collection System Market- by Offering –Revenue and Forecast to 2028 (US$ Million)
Table 6. Argentina: Electronic Toll Collection System Market- By Technology –Revenue and Forecast to 2028 (US$ Million)
Table 7. Argentina: Electronic Toll Collection System Market- By Application –Revenue and Forecast to 2028 (US$ Million)
Table 8. Rest of SAM: Electronic Toll Collection System Market- by Offering–Revenue and Forecast to 2028 (US$ Million)
Table 9. Rest of SAM: Electronic Toll Collection System Market- By Technology –Revenue and Forecast to 2028 (US$ Million)
Table 10. Rest of SAM: Electronic Toll Collection System Market- By Application –Revenue and Forecast to 2028 (US$ Million)
Table 11. List of Abbreviation
LIST OF FIGURES
Figure 1. SAM Electronic Toll Collection System Market Segmentation
Figure 2. SAM Electronic Toll Collection System Market Segmentation – By Country
Figure 3. SAM Electronic Toll Collection System Market Overview
Figure 4. Service Segment Held the Largest Market Share in 2020
Figure 5. DSRC Held the Largest Market Share in 2020
Figure 6. Highways Held the Largest Market Share in 2020
Figure 7. Europe was the Largest Revenue Contributor in 2020
Figure 8. SAM – PEST Analysis
Figure 9. SAM Electronic Toll Collection System Market– Ecosystem Analysis
Figure 10. Expert Opinion
Figure 11. SAM Electronic Toll Collection System Market: Impact Analysis of Drivers and Restraints
Figure 12. SAM Electronic Toll Collection System Market – Revenue and Forecast to 2028 (US$ Million)
Figure 13. SAM Electronic Toll Collection System Market Revenue Share, by Offering (2020 and 2028)
Figure 14. SAM Hardware Equipment: Electronic Toll Collection System Market – Revenue and Forecast to 2028 (US$ Million)
Figure 15. SAM Service Electronic Toll Collection System Market – Revenue and Forecast to 2028 (US$ Million)
Figure 16. SAM Electronic Toll Collection System Market Revenue Share, by Technology (2020 and 2028)
Figure 17. SAM ANPR: Electronic Toll Collection System Market – Revenue and Forecast to 2028 (US$ Million)
Figure 18. SAM GNSS: Electronic Toll Collection System Market – Revenue and Forecast to 2028 (US$ Million)
Figure 19. SAM DSRC: Electronic Toll Collection System Market – Revenue and Forecast to 2028 (US$ Million)
Figure 20. SAM Others: Electronic Toll Collection System Market – Revenue and Forecast to 2028 (US$ Million)
Figure 21. SAM Electronic Toll Collection System Market Revenue Share, by Application (2020 and 2028)
Figure 22. SAM Highways: Electronic Toll Collection System Market – Revenue and Forecast to 2028 (US$ Million)
Figure 23. SAM Urban Zones: Electronic Toll Collection System Market – Revenue and Forecast to 2028 (US$ Million)
Figure 24. SAM: Electronic Toll Collection System Market, by Key Country – Revenue (2020) (US$ Million)
Figure 25. SAM: Electronic Toll Collection System Market Revenue Share, By Key Country (2020 and 2028)
Figure 26. Brazil: Electronic Toll Collection System Market – Revenue and Forecast to 2028 (US$ Million)
Figure 27. Argentina: Electronic Toll Collection System Market – Revenue and Forecast to 2028 (US$ Million)
Figure 28. Rest of SAM: Electronic Toll Collection System Market – Revenue and Forecast to 2028 (US$ Million)
Figure 29. Impact of COVID-19 Pandemic in SAM Country Markets
Yes! We provide a free sample of the report, which includes Report Scope (Table of Contents), report structure, and selected insights to help you assess the value of the full report. Please click on the "Download Sample" button or contact us to receive your copy.
Absolutely - analyst assistance is part of the package. You can connect with our analyst post-purchase to clarify report insights, methodology or discuss how the findings apply to your business needs.
Once your order is successfully placed, you will receive a confirmation email along with your invoice.
• For published reports: You'll receive access to the report within 4-6 working hours via a secured email sent to your email.
• For upcoming reports: Your order will be recorded as a pre-booking. Our team will share the estimated release date and keep you informed of any updates. As soon as the report is published, it will be delivered to your registered email.
We offer customization options to align the report with your specific objectives. Whether you need deeper insights into a particular region, industry segment, competitor analysis, or data cut, our research team can tailor the report accordingly. Please share your requirements with us, and we'll be happy to provide a customized proposal or scope.
The report is available in either PDF format or as an Excel dataset, depending on the license you choose.
The PDF version provides the full analysis and visuals in a ready-to-read format. The Excel dataset includes all underlying data tables for easy manipulation and further analysis.
Please review the license options at checkout or contact us to confirm which formats are included with your purchase.
Our payment process is fully secure and PCI-DSS compliant.
We use trusted and encrypted payment gateways to ensure that all transactions are protected with industry-standard SSL encryption. Your payment details are never stored on our servers and are handled securely by certified third-party processors.
You can make your purchase with confidence, knowing your personal and financial information is safe with us.
Yes, we do offer special pricing for bulk purchases.
If you're interested in purchasing multiple reports, we're happy to provide a customized bundle offer or volume-based discount tailored to your needs. Please contact our sales team with the list of reports you're considering, and we'll share a personalized quote.
Yes, absolutely.
Our team is available to help you make an informed decision. Whether you have questions about the report's scope, methodology, customization options, or which license suits you best, we're here to assist. Please reach out to us at sales@theinsightpartners.com, and one of our representatives will get in touch promptly.
Yes, a billing invoice will be automatically generated and sent to your registered email upon successful completion of your purchase.
If you need the invoice in a specific format or require additional details (such as company name, GST, or VAT information), feel free to contact us, and we'll be happy to assist.
Yes, certainly.
If you encounter any difficulties accessing or receiving your report, our support team is ready to assist you. Simply reach out to us via email or live chat with your order information, and we'll ensure the issue is resolved quickly so you can access your report without interruption.
The Insight Partners performs research in 4 major stages: Data Collection & Secondary Research, Primary Research, Data Analysis and Data Triangulation & Final Review.
- Data Collection and Secondary Research:
As a market research and consulting firm operating from a decade, we have published many reports and advised several clients across the globe. First step for any study will start with an assessment of currently available data and insights from existing reports. Further, historical and current market information is collected from Investor Presentations, Annual Reports, SEC Filings, etc., and other information related to company’s performance and market positioning are gathered from Paid Databases (Factiva, Hoovers, and Reuters) and various other publications available in public domain.
Several associations trade associates, technical forums, institutes, societies and organizations are accessed to gain technical as well as market related insights through their publications such as research papers, blogs and press releases related to the studies are referred to get cues about the market. Further, white papers, journals, magazines, and other news articles published in the last 3 years are scrutinized and analyzed to understand the current market trends.
- Primary Research:
The primarily interview analysis comprise of data obtained from industry participants interview and answers to survey questions gathered by in-house primary team.
For primary research, interviews are conducted with industry experts/CEOs/Marketing Managers/Sales Managers/VPs/Subject Matter Experts from both demand and supply side to get a 360-degree view of the market. The primary team conducts several interviews based on the complexity of the markets to understand the various market trends and dynamics which makes research more credible and precise.
A typical research interview fulfils the following functions:
- Provides first-hand information on the market size, market trends, growth trends, competitive landscape, and outlook
- Validates and strengthens in-house secondary research findings
- Develops the analysis team’s expertise and market understanding
Primary research involves email interactions and telephone interviews for each market, category, segment, and sub-segment across geographies. The participants who typically take part in such a process include, but are not limited to:
- Industry participants: VPs, business development managers, market intelligence managers and national sales managers
- Outside experts: Valuation experts, research analysts and key opinion leaders specializing in the electronics and semiconductor industry.
Below is the breakup of our primary respondents by company, designation, and region:

Once we receive the confirmation from primary research sources or primary respondents, we finalize the base year market estimation and forecast the data as per the macroeconomic and microeconomic factors assessed during data collection.
- Data Analysis:
Once data is validated through both secondary as well as primary respondents, we finalize the market estimations by hypothesis formulation and factor analysis at regional and country level.
- 3.1 Macro-Economic Factor Analysis:
We analyse macroeconomic indicators such the gross domestic product (GDP), increase in the demand for goods and services across industries, technological advancement, regional economic growth, governmental policies, the influence of COVID-19, PEST analysis, and other aspects. This analysis aids in setting benchmarks for various nations/regions and approximating market splits. Additionally, the general trend of the aforementioned components aid in determining the market's development possibilities.
- 3.2 Country Level Data:
Various factors that are especially aligned to the country are taken into account to determine the market size for a certain area and country, including the presence of vendors, such as headquarters and offices, the country's GDP, demand patterns, and industry growth. To comprehend the market dynamics for the nation, a number of growth variables, inhibitors, application areas, and current market trends are researched. The aforementioned elements aid in determining the country's overall market's growth potential.
- 3.3 Company Profile:
The “Table of Contents” is formulated by listing and analyzing more than 25 - 30 companies operating in the market ecosystem across geographies. However, we profile only 10 companies as a standard practice in our syndicate reports. These 10 companies comprise leading, emerging, and regional players. Nonetheless, our analysis is not restricted to the 10 listed companies, we also analyze other companies present in the market to develop a holistic view and understand the prevailing trends. The “Company Profiles” section in the report covers key facts, business description, products & services, financial information, SWOT analysis, and key developments. The financial information presented is extracted from the annual reports and official documents of the publicly listed companies. Upon collecting the information for the sections of respective companies, we verify them via various primary sources and then compile the data in respective company profiles. The company level information helps us in deriving the base number as well as in forecasting the market size.
- 3.4 Developing Base Number:
Aggregation of sales statistics (2020-2022) and macro-economic factor, and other secondary and primary research insights are utilized to arrive at base number and related market shares for 2022. The data gaps are identified in this step and relevant market data is analyzed, collected from paid primary interviews or databases. On finalizing the base year market size, forecasts are developed on the basis of macro-economic, industry and market growth factors and company level analysis.
- Data Triangulation and Final Review:
The market findings and base year market size calculations are validated from supply as well as demand side. Demand side validations are based on macro-economic factor analysis and benchmarks for respective regions and countries. In case of supply side validations, revenues of major companies are estimated (in case not available) based on industry benchmark, approximate number of employees, product portfolio, and primary interviews revenues are gathered. Further revenue from target product/service segment is assessed to avoid overshooting of market statistics. In case of heavy deviations between supply and demand side values, all thes steps are repeated to achieve synchronization.
We follow an iterative model, wherein we share our research findings with Subject Matter Experts (SME’s) and Key Opinion Leaders (KOLs) until consensus view of the market is not formulated – this model negates any drastic deviation in the opinions of experts. Only validated and universally acceptable research findings are quoted in our reports.
We have important check points that we use to validate our research findings – which we call – data triangulation, where we validate the information, we generate from secondary sources with primary interviews and then we re-validate with our internal data bases and Subject matter experts. This comprehensive model enables us to deliver high quality, reliable data in shortest possible time.

Nov 2021
Parallel SLC NAND Flash Memory Market
Size and Forecast (2021 - 2031), Global and Regional Share, Trend, and Growth Opportunity Analysis Report Coverage: By Density (Above 8 GB, 8 GB, 4 GB, 2 GB, and 1 GB), Application (Industrial, Automotive, Consumer Electronics, Computers and IT, Communication, and Others), and Geography (North America, Europe, Asia Pacific, Middle East & Africa, and South & Central America)
Nov 2021
Serial SLC NAND Flash Memory Market
Size and Forecast (2021 - 2031), Global and Regional Share, Trend, and Growth Opportunity Analysis Report Coverage: By Density (1GB, 2GB, 4GB, 8GB, and Above 8GB); Application (Automotive, Industrial, Communication, Computers and IT, Consumer Electronics, and Others); and Geography (North America, Europe, Asia Pacific, Middle East & Africa, and South & Central America)
Nov 2021
Vertical Carousels ASRS Market
Size and Forecast (2021 - 2031), Global and Regional Share, Trend, and Growth Opportunity Analysis Report Coverage: By Type (Assembly, Distribution, Kitting, Order Picking, Storage, and Others), End use Industry (Automotive, Food and Beverages, Electronic and Semiconductors, E-Commerce, Chemicals, Aerospace, Retail, Pharmaceuticals and Others), and Geography (North America, Europe, Asia Pacific, Middle East and Africa, and South and Central America)
Nov 2021
Unit Load ASRS Market
Size and Forecast (2021 - 2031), Global and Regional Share, Trend, and Growth Opportunity Analysis Report Coverage: By Type (Assembly, Distribution, Kitting, Order Picking, Storage, Others), End Use Industry (Automotive, Food & Beverage, Electronic & Semiconductors, E-commerce, Chemicals, Aerospace, Retail, Pharmaceutical, Others), and Region (North America, Europe, Asia Pacific, Middle East and Africa, and South and Central America)
Nov 2021
Mini Load ASRS Market
Size and Forecast (2021 - 2031), Global and Regional Share, Trend, and Growth Opportunity Analysis Report Coverage: By Type (Storage, Order Picking, Distribution, Kitting, Assembly, and Others), End Use Industry (Automotive, Food & Beverages, Electronics & Semiconductor, E-Commerce, Chemicals, Aerospace, Retail, Pharmaceuticals, and Others), and Geography (North America, Europe, Asia Pacific, Middle East and Africa, and South and Central America)
Nov 2021
Horizontal Carousels ASRS Market
Size and Forecast (2021 - 2031), Global and Regional Share, Trend, and Growth Opportunity Analysis Report Coverage: By Type Type (Assembly, Distribution, Kitting, Order Picking, Storage, and Others), End-Use Industry (Automotive, Food & Beverage, Electronic & Semiconductors, E-commerce, Chemicals, Aerospace, Retail, Pharmaceutical, and Others), and Geography (North America, Europe, Asia Pacific, Middle East and Africa, and South and Central America)
Nov 2021
AutoStore ASRS Market
Size and Forecast (2021 - 2031), Global and Regional Share, Trend, and Growth Opportunity Analysis Report Coverage: By Type (Assembly, Distribution, Kitting, Order Picking, Storage, and Others), End-Use Industry (Automotive, Food and Beverages, Electronic and Semiconductors, E-Commerce, Chemicals, Aerospace, Retail, Pharmaceuticals, and Others), and Geography (North America, Europe, Asia Pacific, Middle East and Africa, and South and Central America)
Nov 2021
Board-to-Board EV Connectors Market
Size and Forecast (2021 - 2031), Global and Regional Share, Trend, and Growth Opportunity Analysis Report Coverage: By Type (Sealed Connector System and Unsealed Connector System), Application (ADAS and Safety System, Body Controls and Interior, Infotainment System, Engine Management and Powertrain, Battery Management System, Vehicle Lighting, and Others), Propulsion Type (Battery Electric Vehicle, Plug-In Hybrid Vehicle, Fuel Cell Electric Vehicle, and Hybrid Electric Vehicle), Voltage (Low Voltage, Medium Voltage, and High Voltage), and Geography (North America, Europe, Asia Pacific, Middle East and Africa, and South and Central America)
 Get Free Sample For